VibeFox Volume
- Indicators
- Version: 1.10
- Updated: 2 July 2026
- Activations: 5

VibeFox Volume — volume spikes, trend confirmation, entry signals
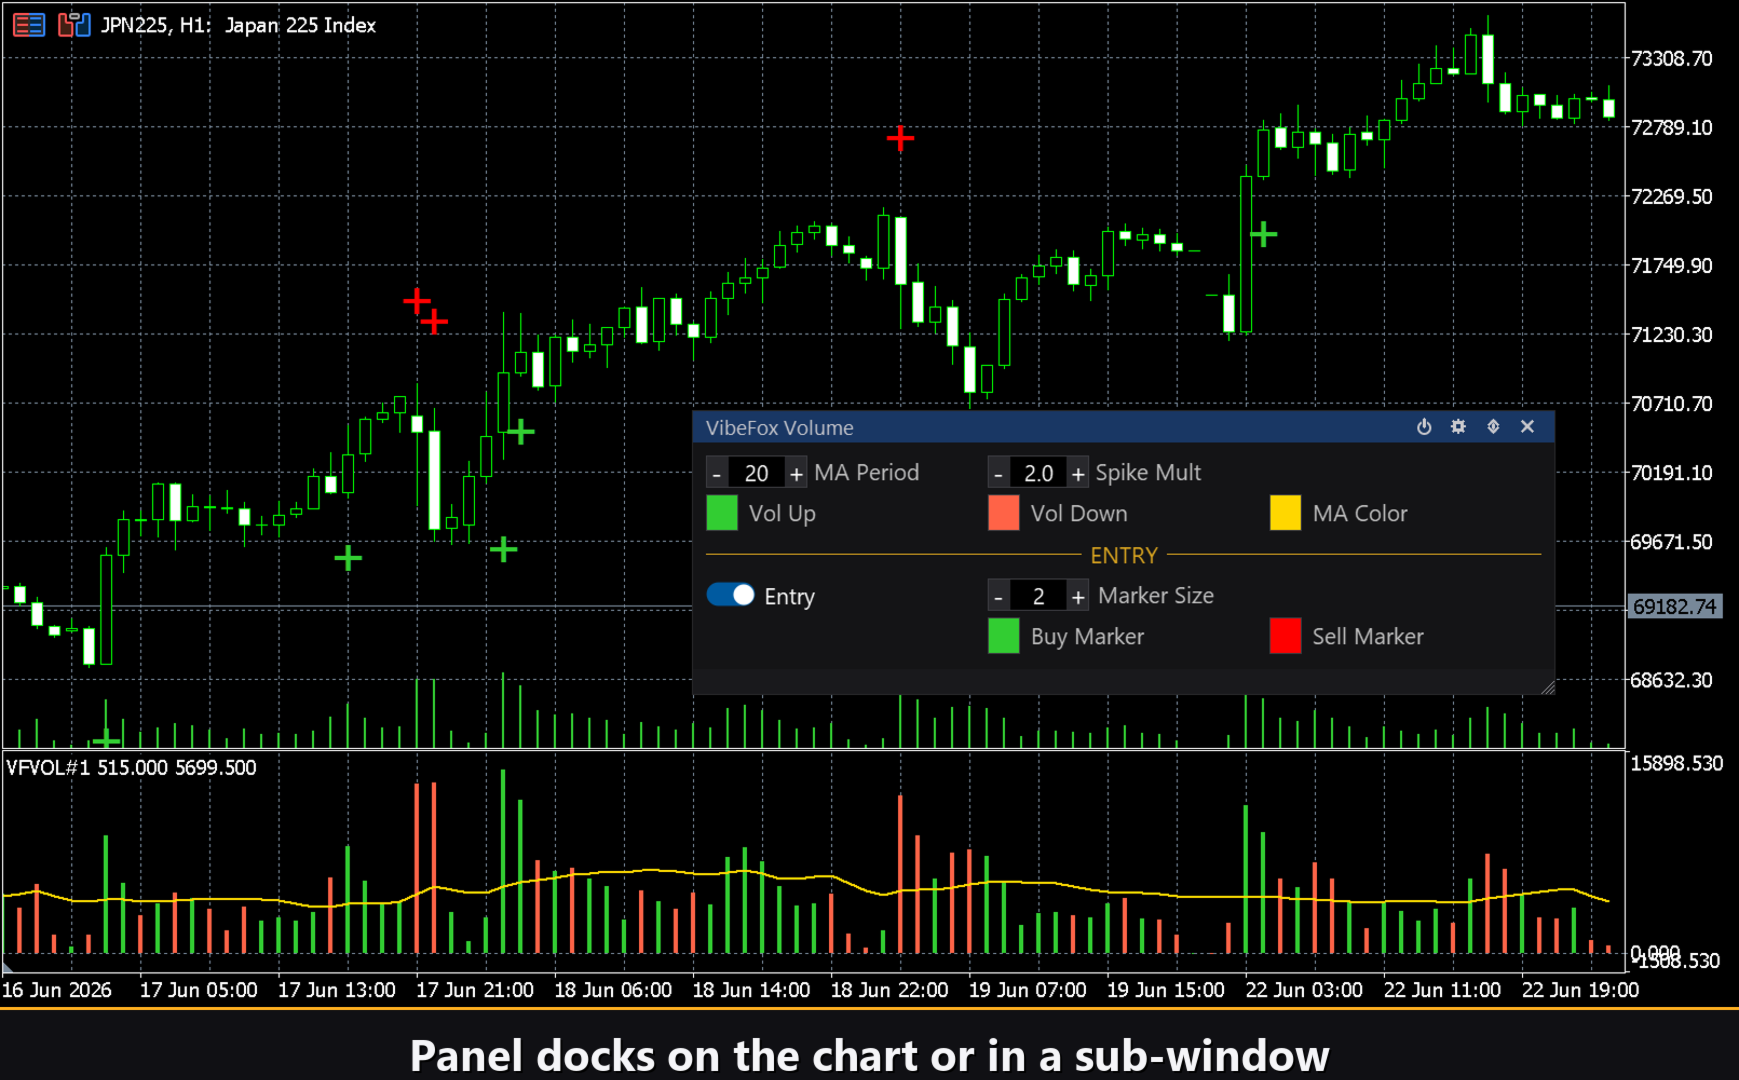
VibeFox Volume is a tick-volume indicator for MetaTrader 5 that turns the raw volume stream into an actionable tool. It draws a colour-coded histogram directly in a separate subwindow, overlays a moving-average line to show what "normal" volume looks like, and then marks every bar where volume erupts above that average with a BUY or SELL arrow right on the price chart. You no longer need to squint at the volume bar and do mental arithmetic — the indicator does the comparison and the signal appears the moment the condition is met.
The volume histogram
Every bar produces one volume column. Bullish bars (close at or above open) are painted in the Vol Up colour; bearish bars (close below open) use the Vol Down colour. The contrast makes it immediately obvious whether buyers or sellers are driving the activity. Each colour has its own transparency slider, so you can tone down bars that are not currently spiking and keep the focus where it belongs.
The volume moving average and the Spike Multiplier
Across the histogram runs a Vol MA line — a simple moving average of tick volume calculated over MA Period bars. The line is your personal "normal" baseline: it tells you what a typical bar's volume looks like on this instrument and timeframe right now. The Spike Mult parameter is a multiplier applied to that average. If Vol MA is 1 000 ticks and Spike Mult is 2.0, the threshold is 2 000 ticks — any bar exceeding that is a spike. Raise the multiplier to filter only explosive outliers; lower it to catch more moderate surges.
Entry points
VibeFox Volume has one entry type with its own on/off toggle.
Entry — Volume Spike
When a closed bar's tick volume exceeds Vol MA × Spike Mult, the indicator treats it as a significant volume event. The direction of the signal is taken directly from the bar: a bullish bar (close ≥ open) generates a BUY arrow, a bearish bar generates a SELL arrow. The arrows are placed on the price chart at the bar's closing price. The indicator scans the last 500 closed bars on every recalculation, so historical spikes are also marked and you always see the full picture even after loading the indicator mid-session.
Arrow colour and size are fully adjustable: Buy Marker Color and Sell Marker Color let you colour-code the direction at a glance, and Marker Size scales the arrows from 1 to 5 so they are readable on any chart density.
Full visual control
Every colour is adjustable and every colour comes with a transparency slider (0 = fully opaque, 100 = invisible). Set the Vol Up and Vol Down bar colours, the Vol MA line colour, and the Buy Marker and Sell Marker arrow colours independently. All changes apply immediately in the live panel — no need to re-open the Inputs dialog.
Interactive on-chart panel
All controls live in a smooth canvas-based panel designed for fast mouse interaction. The header strip carries four icon buttons.
Power — switches the histogram and all entry markers on and off without removing the indicator from the chart.
Settings (gear icon) — opens and closes the Settings section where you adjust panel appearance and notification options.
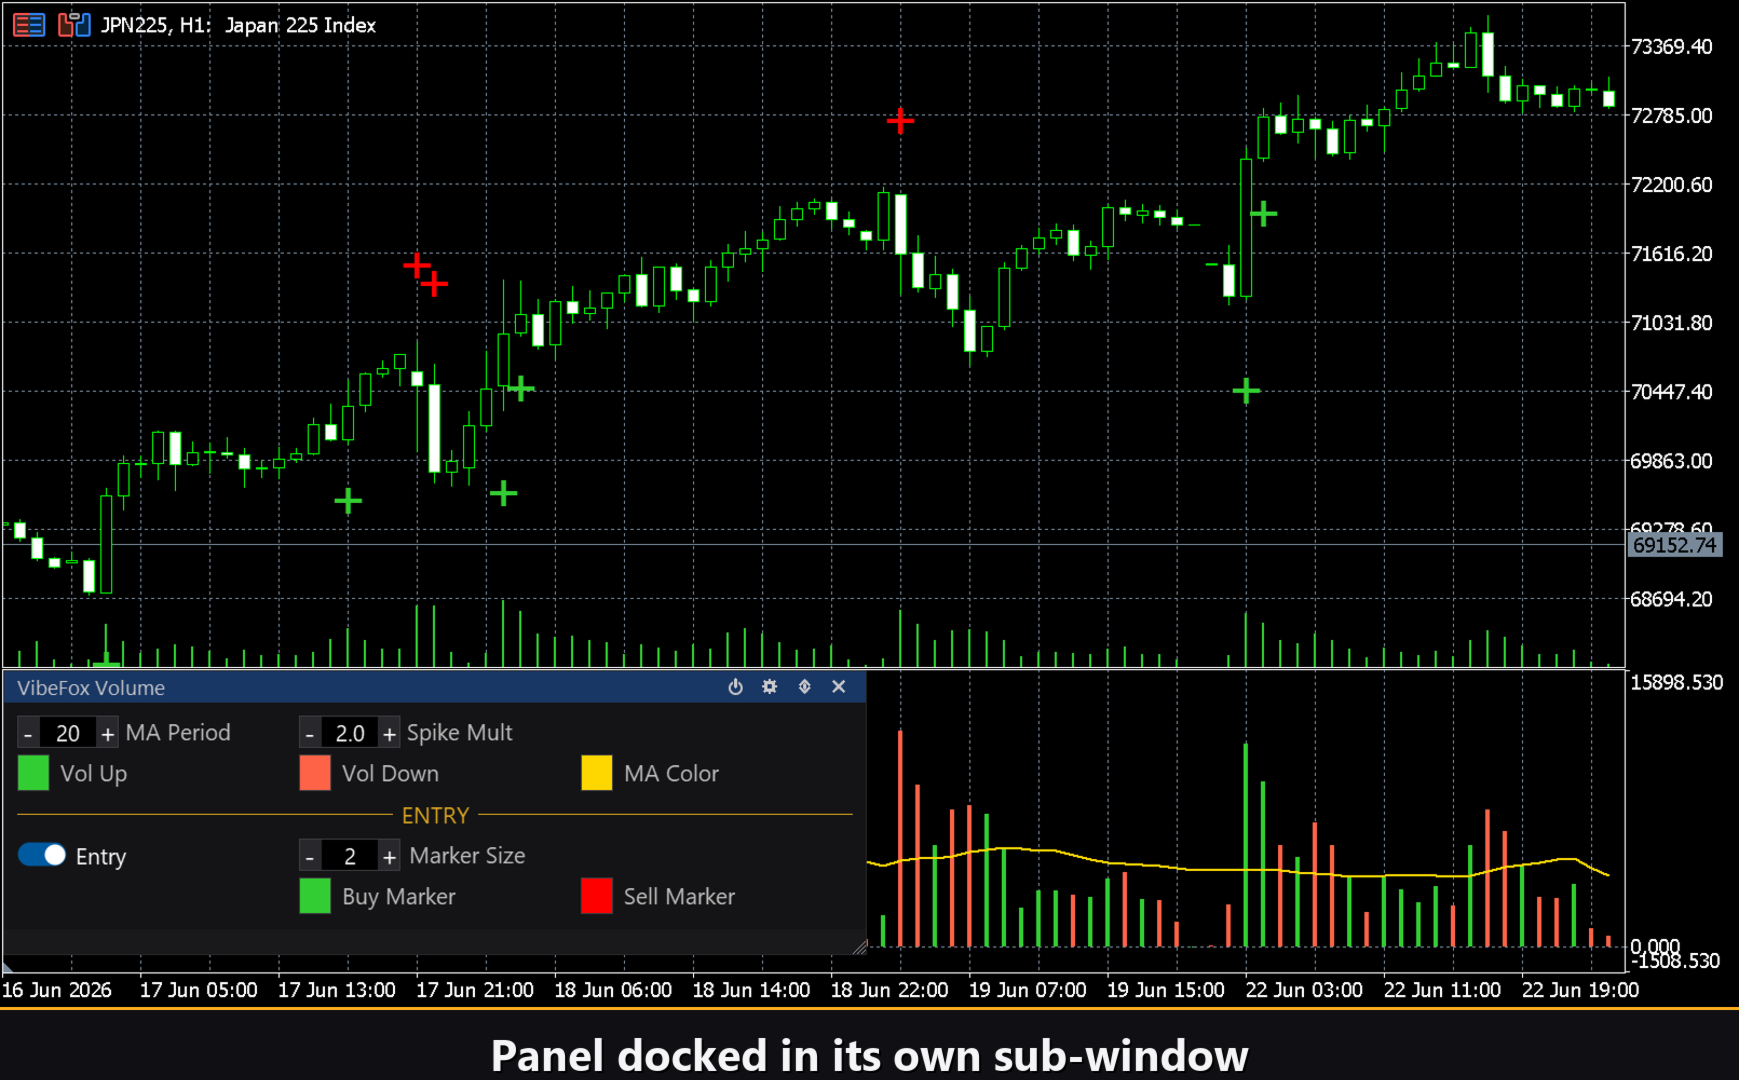
Updown (arrows) — moves the panel between the separate subwindow and the main price chart so it never obscures the data you need to see.
Close (cross) — removes the indicator from the chart cleanly.
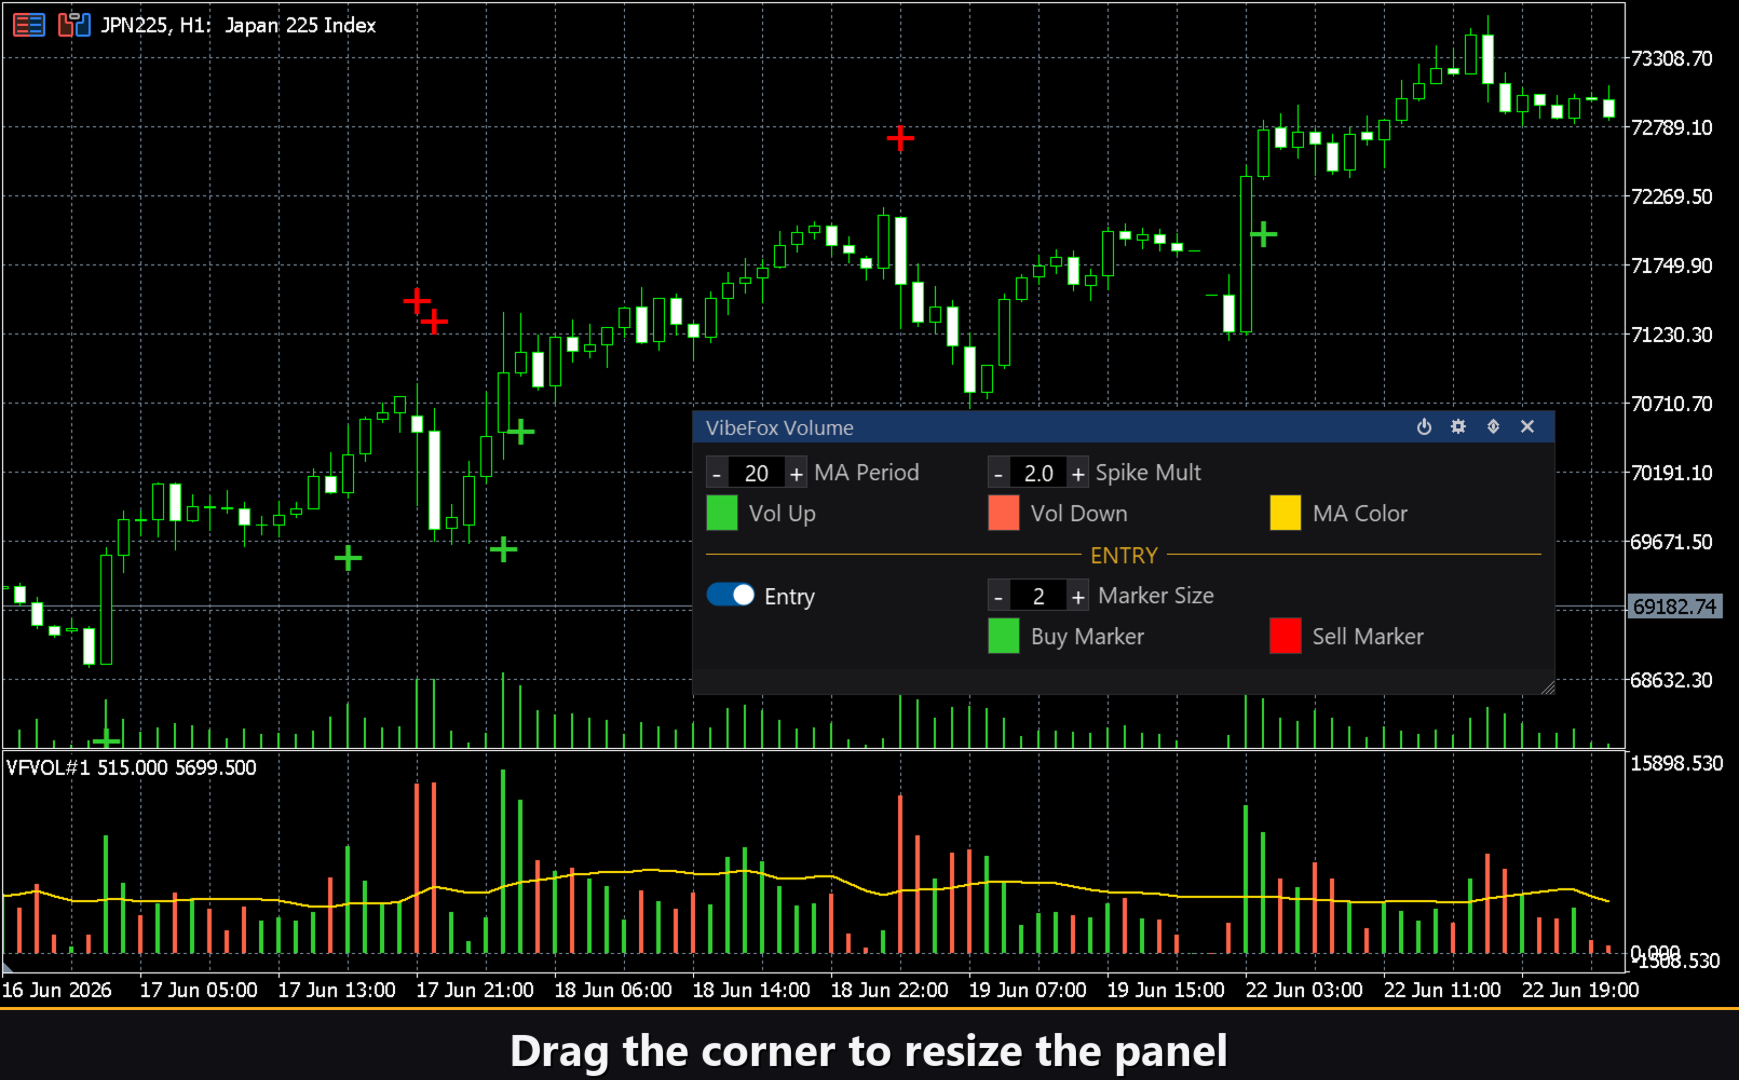
Resizable — drag the bottom-right corner of the panel to resize it to any width that suits your workspace.
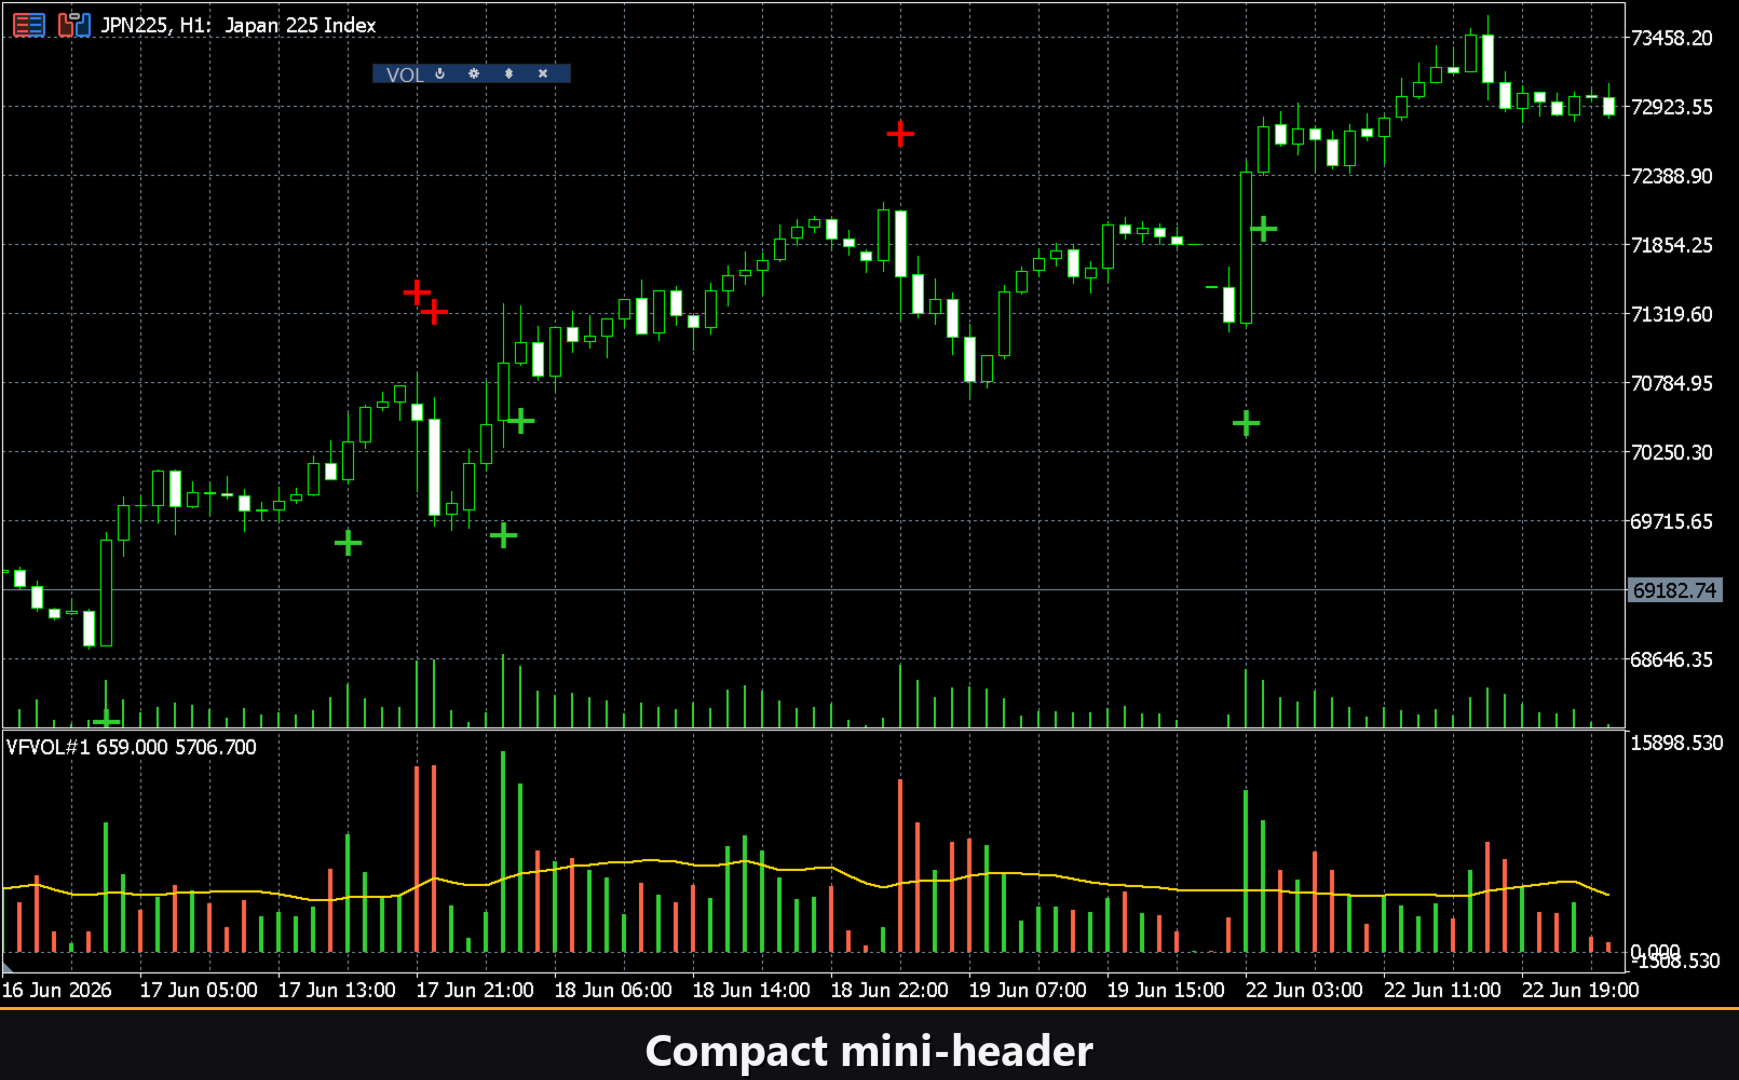
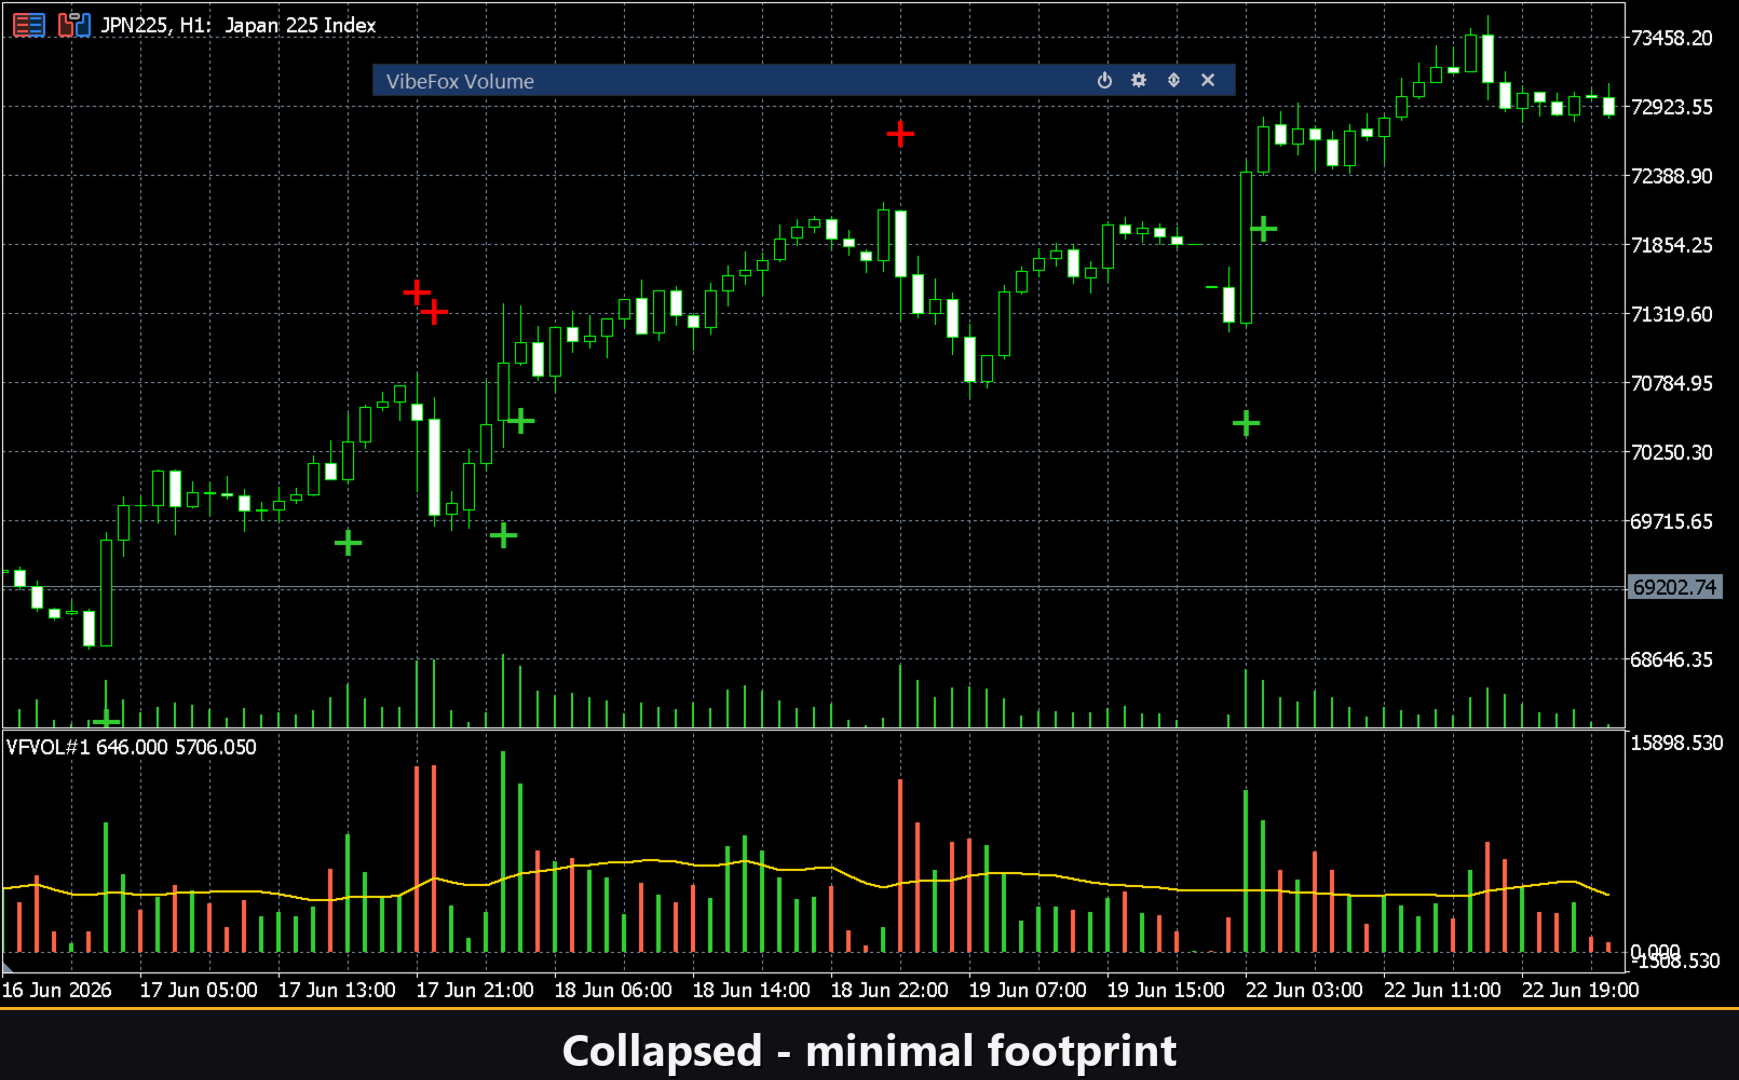
Collapsible — double-click the header to collapse the panel to a compact title strip, freeing up chart space.
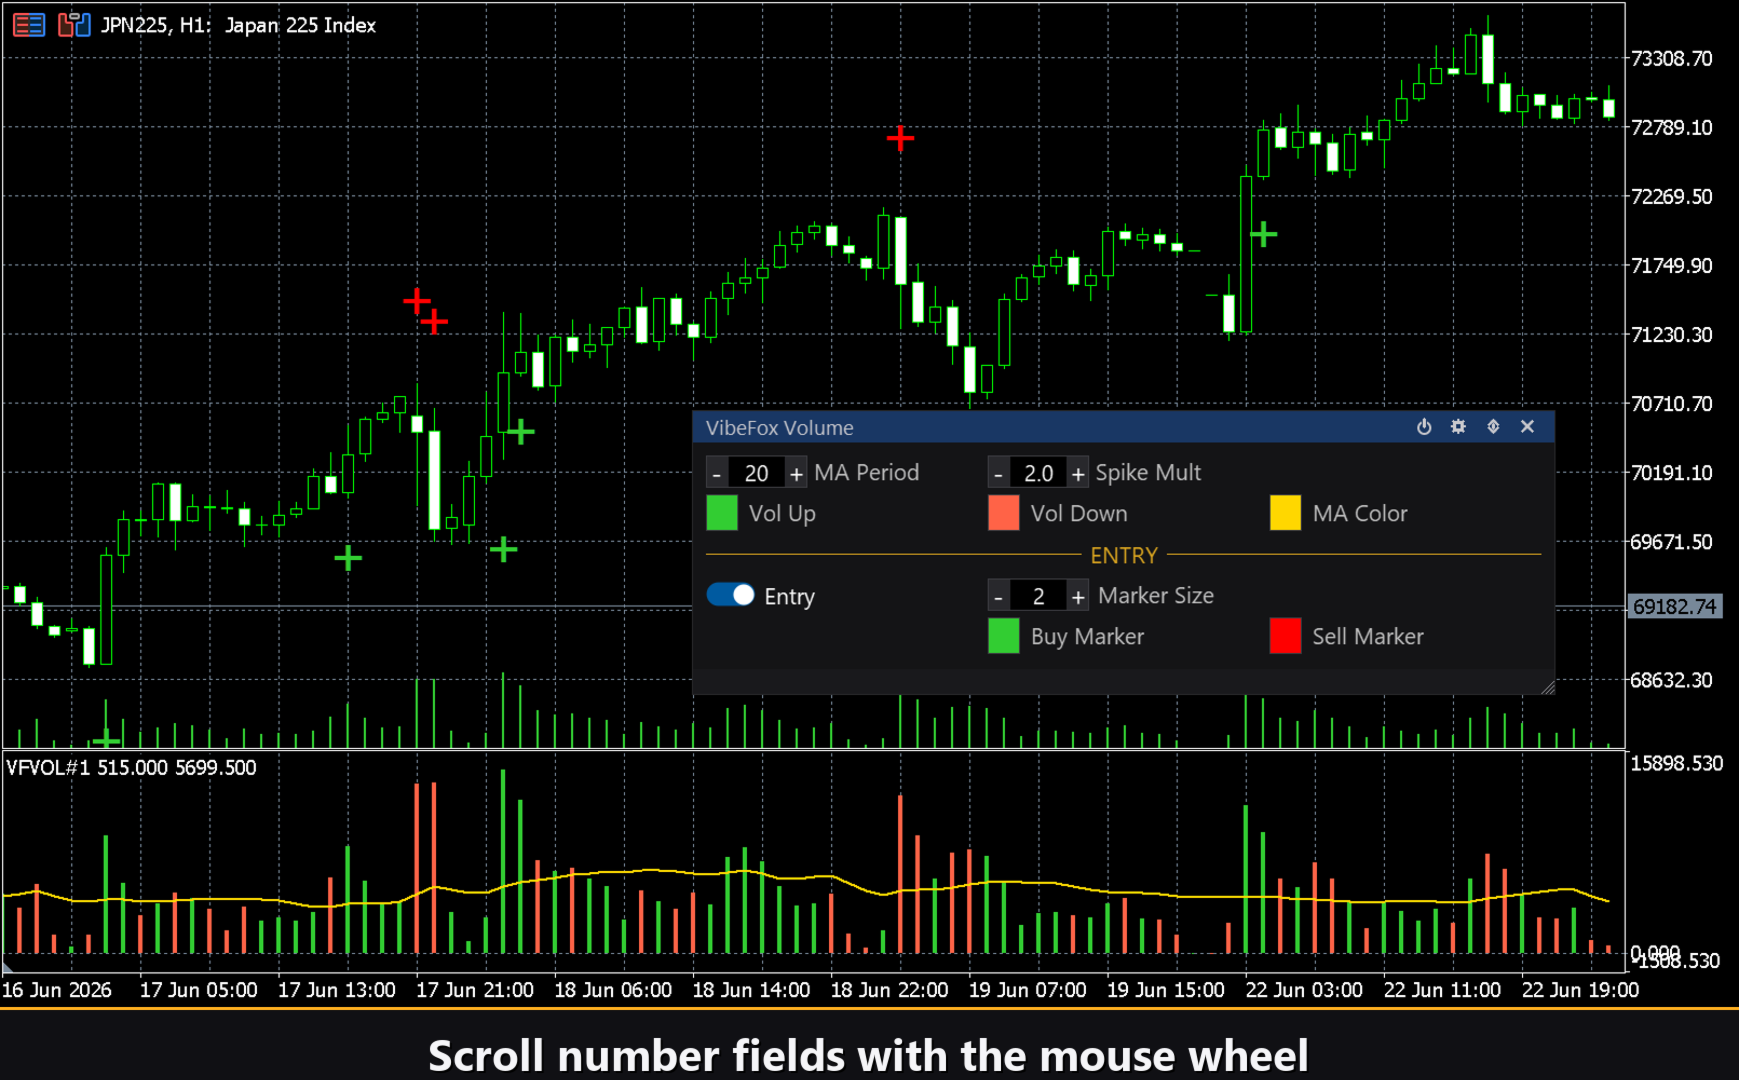
Mouse wheel — hover over any numeric field such as MA Period or Spike Mult and scroll to change the value without opening the keyboard.
Settings and personalisation
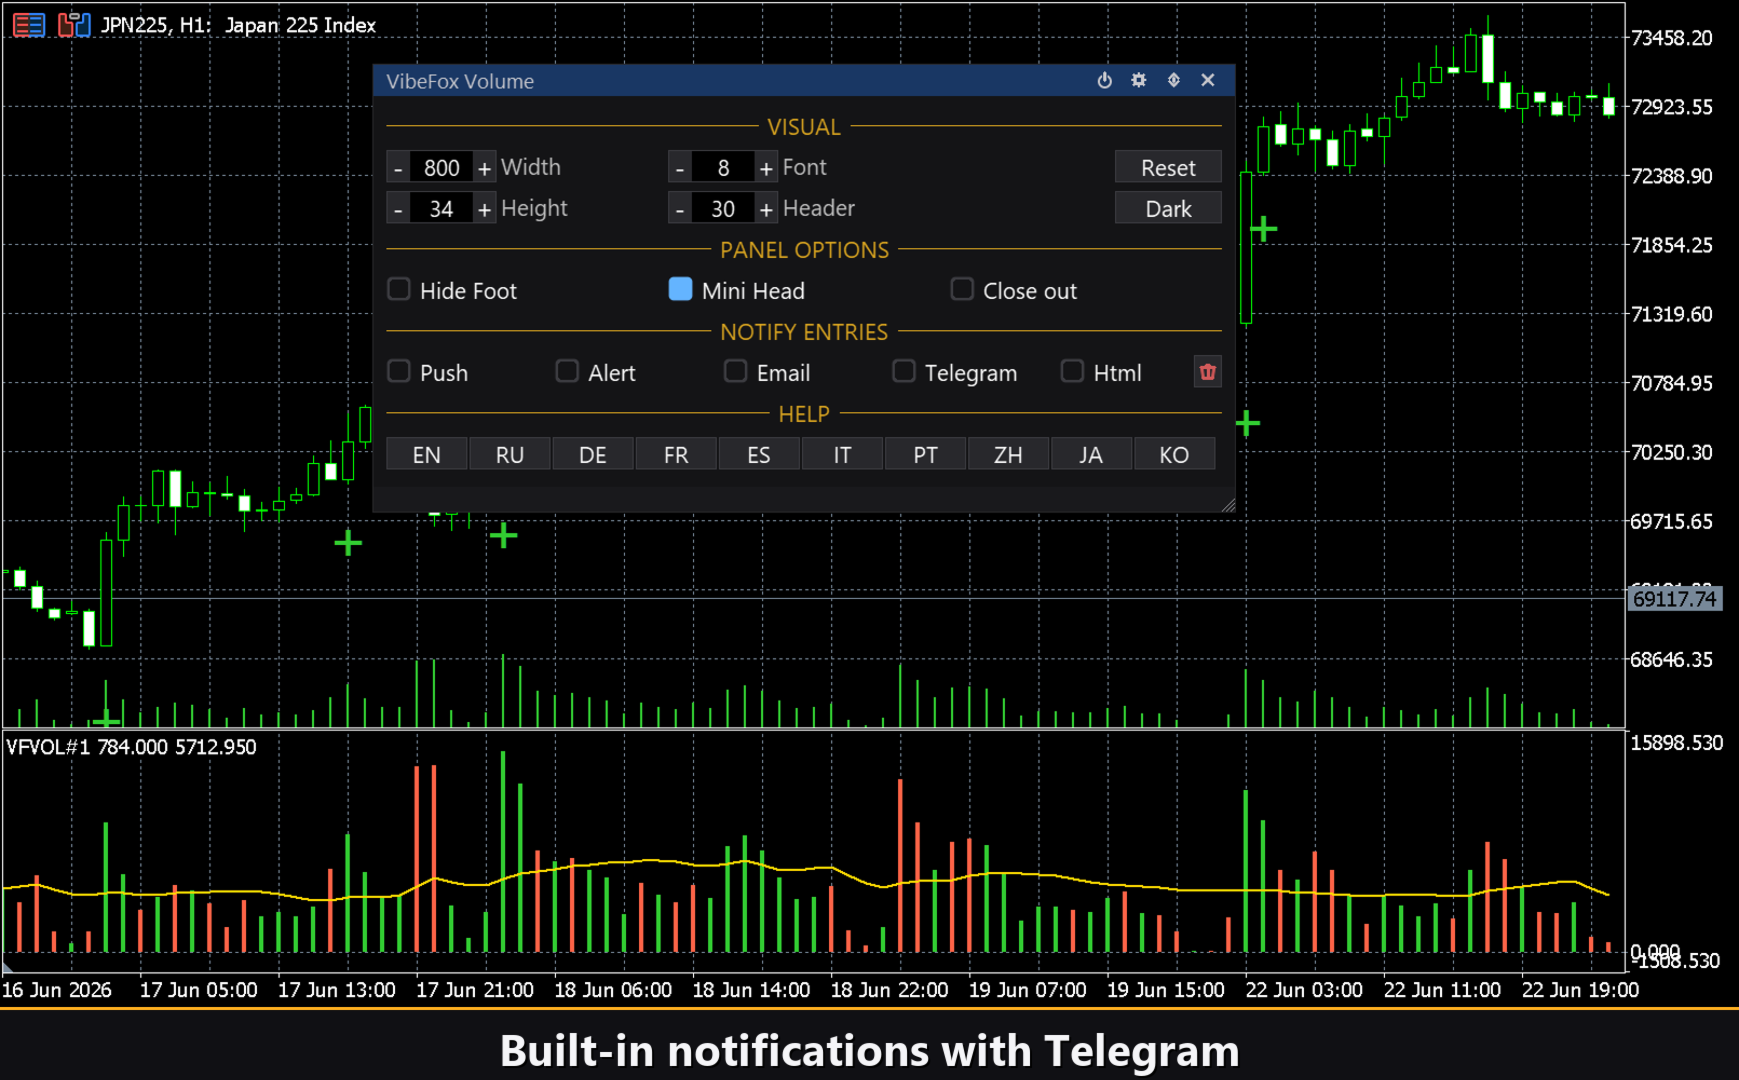
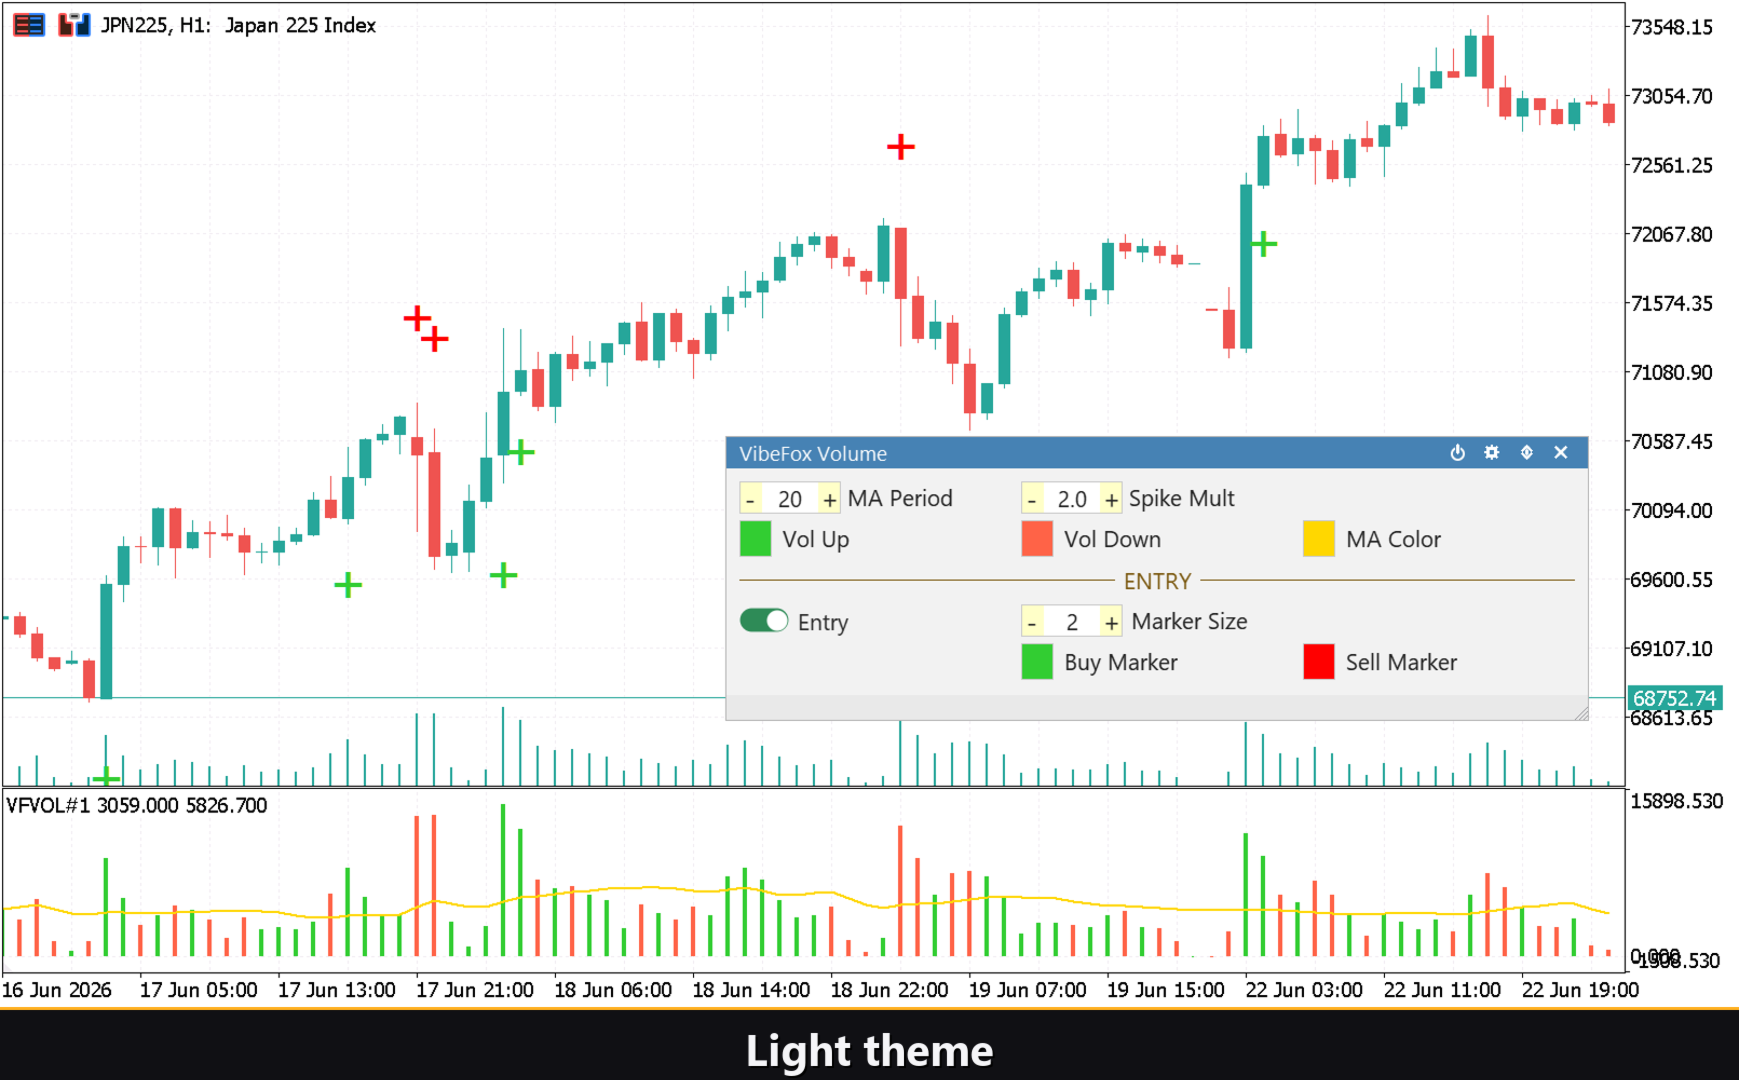
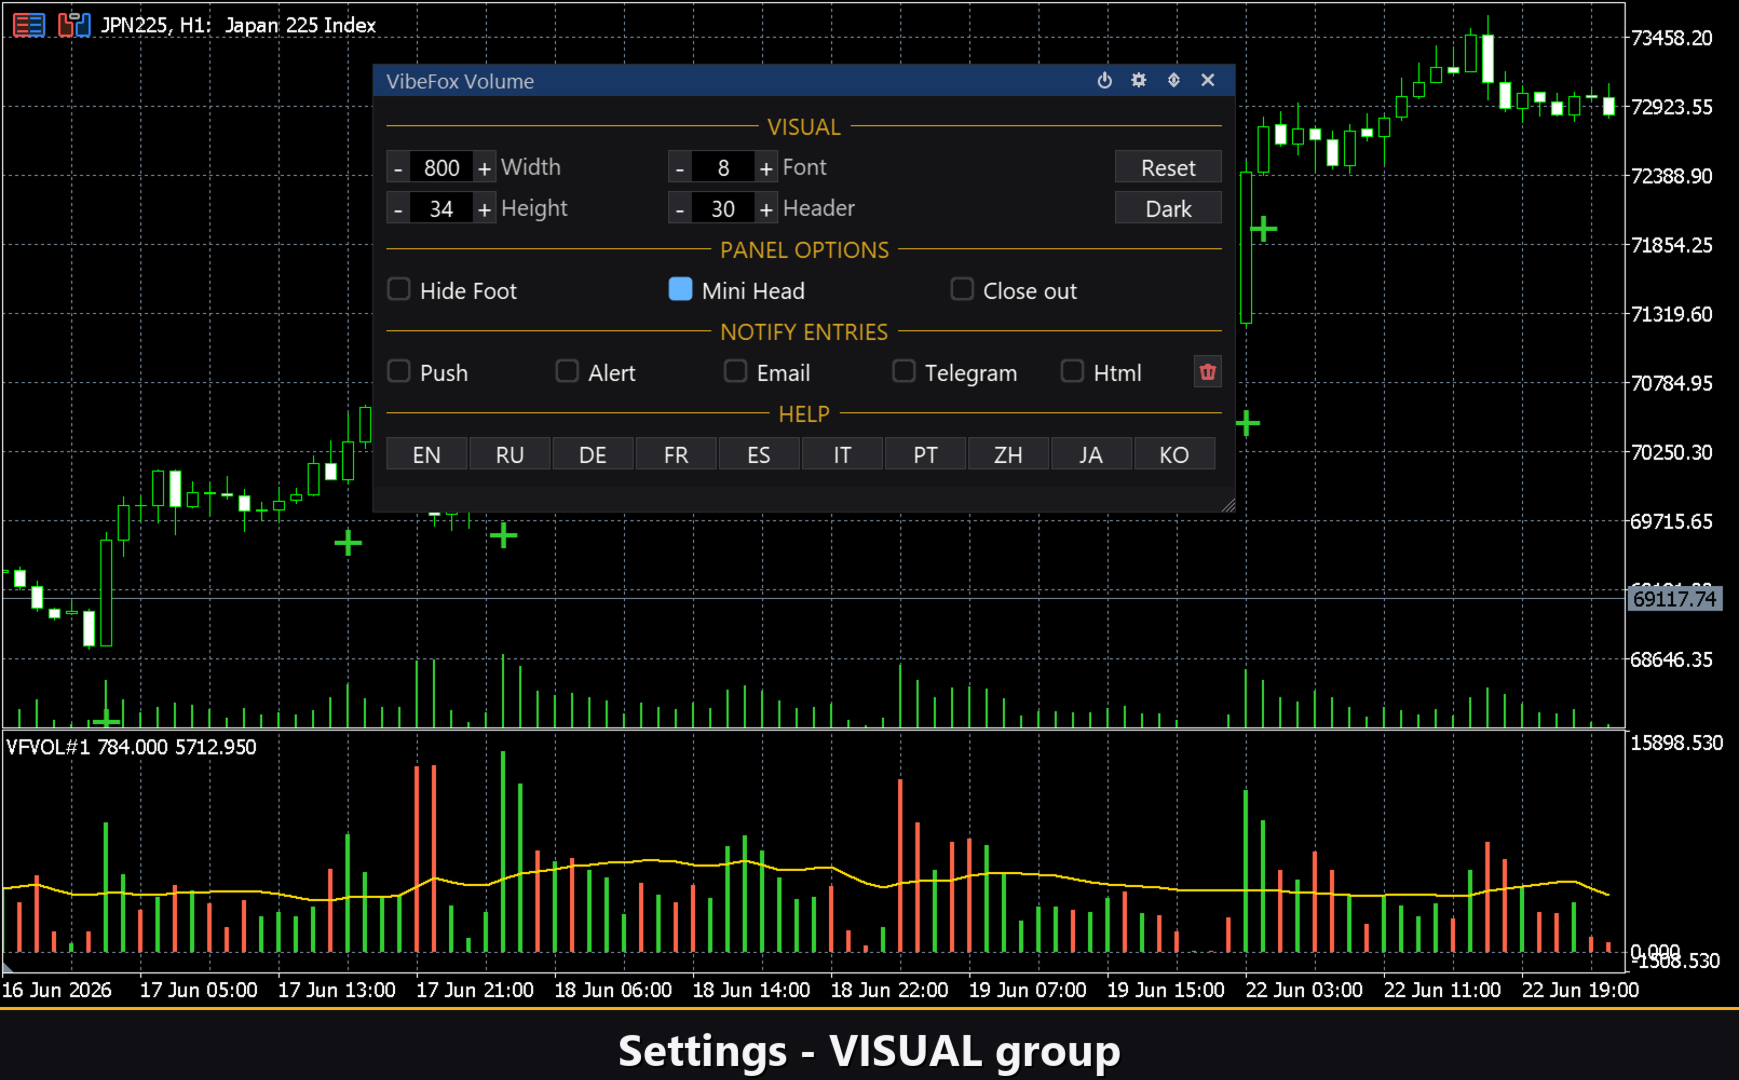
The Settings button opens a dedicated section where the panel itself is tuned to your workspace. Choose Theme — Auto (follows the chart's own colour scheme), Dark, or Light. Set the panel width in pixels, the Header size, the Row height, and the Font size. Additional options let you hide the bottom strip with Hide Footer, show only a thin title bar when collapsed via Mini Header, and auto-collapse the panel when you click anywhere outside it with Close on click outside. Assign a unique Instance number to run several independent copies of VibeFox Volume on the same chart — each tracks its own settings and signals. The Panel Start Window setting controls whether the panel opens in the subwindow or on the main chart at launch.
Entry notifications
You do not have to watch the chart continuously. Each Volume Spike entry can trigger one or more notification channels independently.
Alert — a pop-up message inside the MetaTrader terminal.
Push — a mobile notification to the MetaTrader app on your phone.
Email — a message sent via the terminal's mail configuration.
Telegram — the alert text together with a chart screenshot, sent straight to your Telegram chat.
Enable whichever channels you need and you will be notified the moment a new Volume Spike signal forms on the symbol and timeframe you are watching.
Visual history — Html report
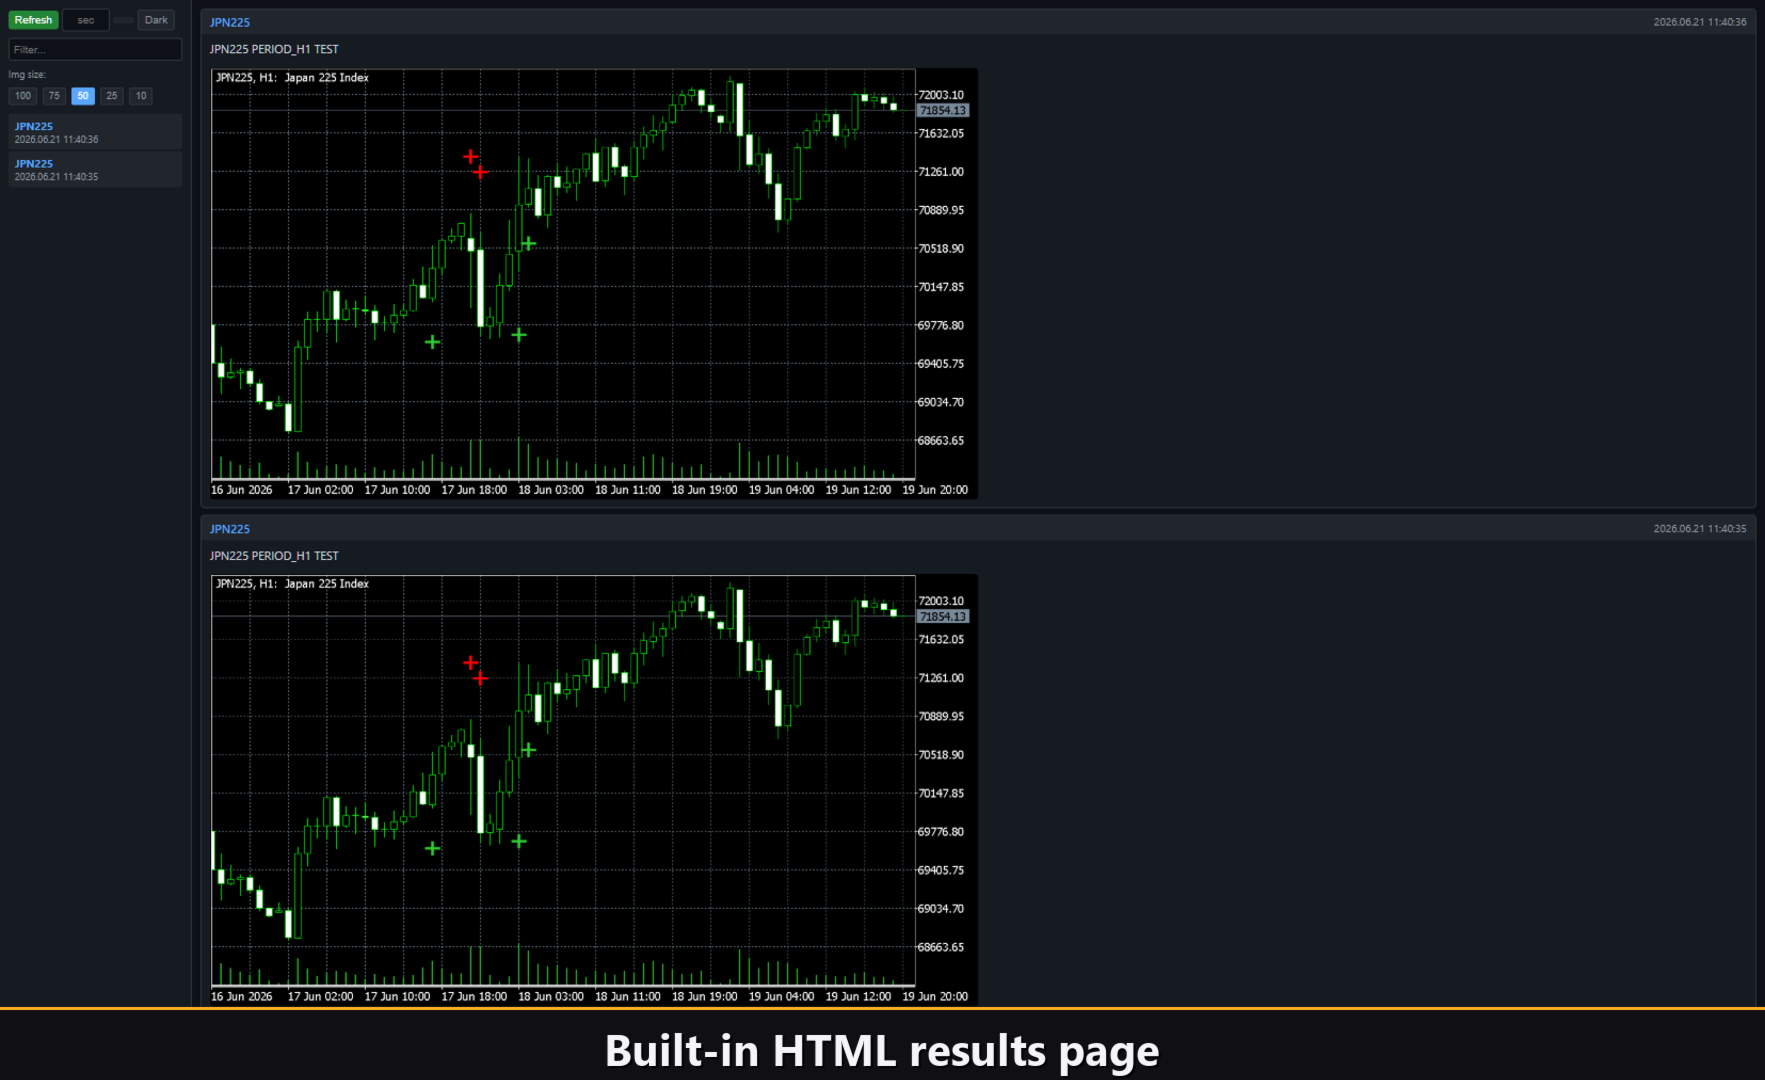
Enable the Html channel and every Volume Spike entry is logged with a full chart screenshot taken at the moment it fires. The report is saved to the Files folder of your MetaTrader terminal under VibeFox_Volume\result.html and opens in any browser, giving you a visual journal of every spike the indicator has found. A small trash-bin button inside the Settings section clears the report and all saved screenshots in one click when you want to start a fresh log.
Telegram Alerts
Signals can also be delivered straight to your Telegram chat — the alert text together with a screenshot of the chart at the moment of detection. Turn on the Telegram channel and enter your bot token and chat id in the inputs.
Delivery rides on the HTML report: each new signal is written into the report, and the report — opened in a browser — forwards it to your Telegram chat on its own. For this reason, enabling Telegram automatically keeps the Html report on, and the two channels work together.
Built-in multilingual help
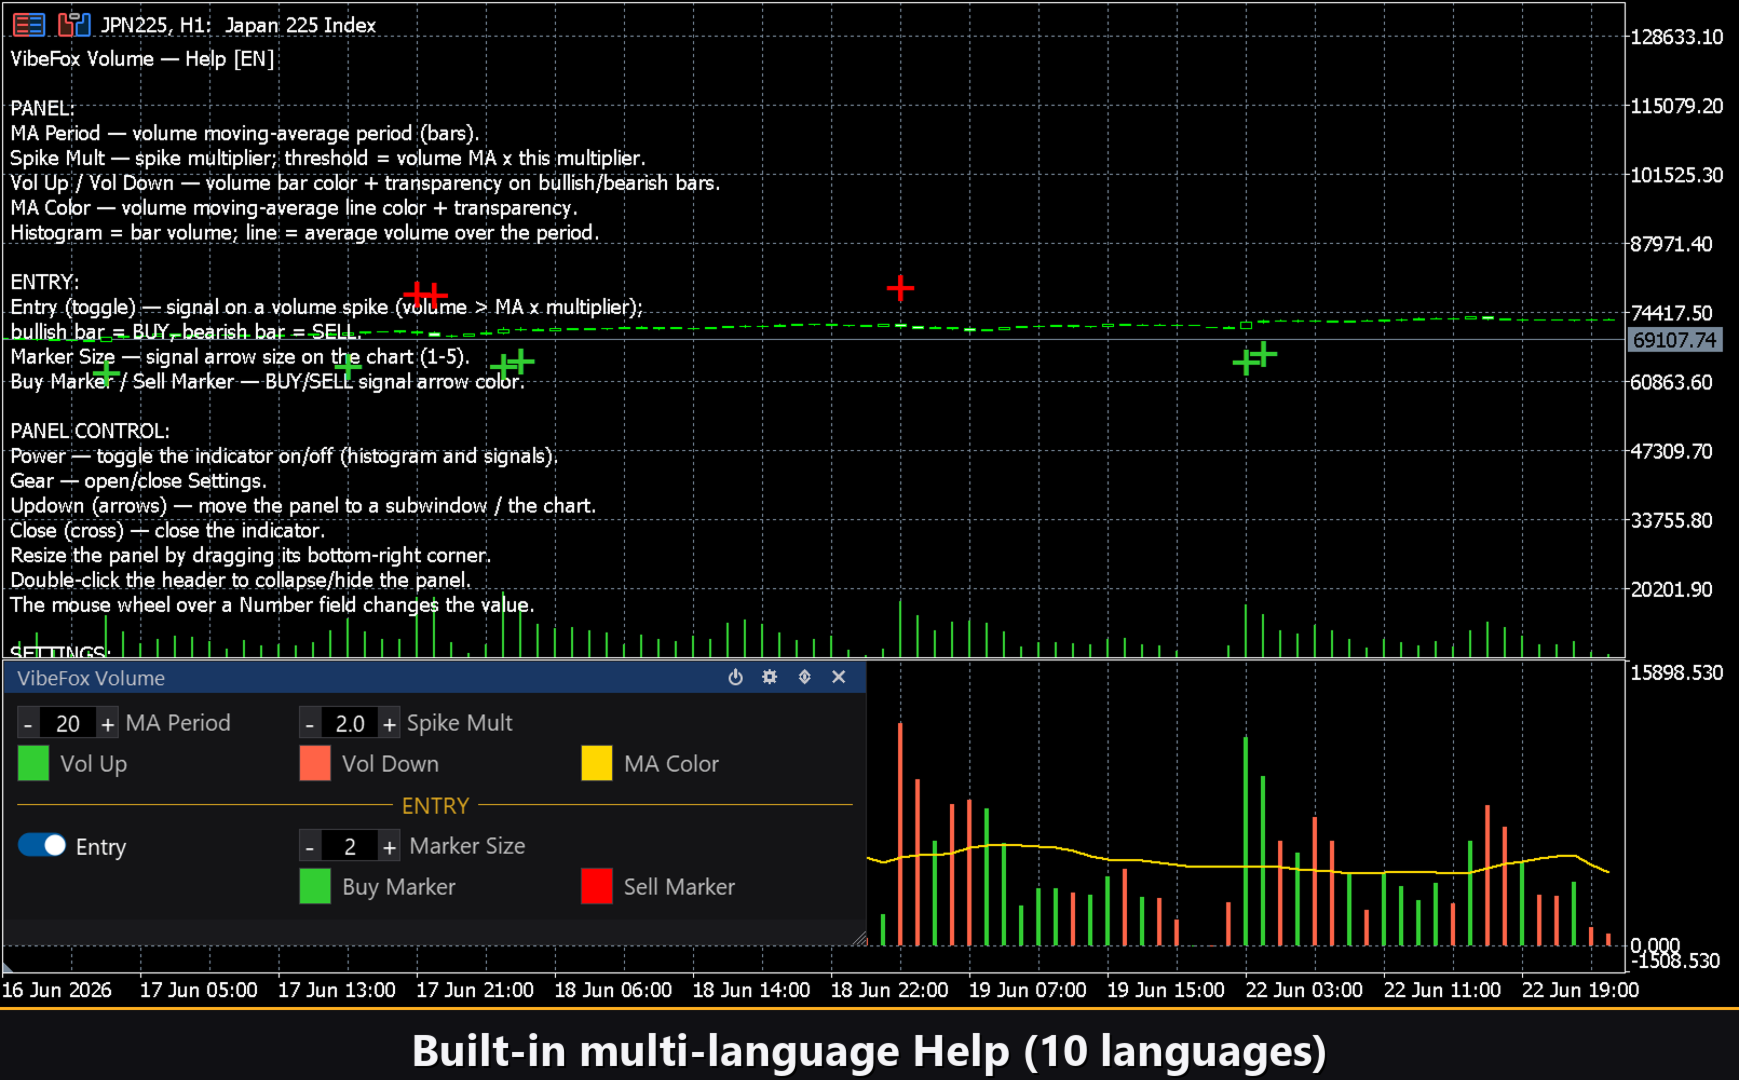
A complete help page is built into the panel and available in 10 languages, so every control is explained right where you use it — no manual needed.
Parameters (Inputs tab)
Most settings can also be changed live on the panel (Settings button) — the input parameters set only the initial values at launch.
Volume
MA Period (2..200) — SMA period for the volume moving average in bars. Default: 20.
Spike Mult (1.0..10.0) — multiplier applied to the Vol MA to set the spike threshold; volume must exceed Vol MA × Spike Mult for a signal. Default: 2.0.
Vol Up Color — colour of volume histogram bars on bullish bars (close ≥ open). Default: LimeGreen.
Vol Up Transparency (0-100) — transparency of bullish volume bars; 0 = opaque, 100 = invisible. Default: 0.
Vol Down Color — colour of volume histogram bars on bearish bars (close below open). Default: Tomato.
Vol Down Transparency (0-100) — transparency of bearish volume bars; 0 = opaque. Default: 0.
Vol MA Color — colour of the volume moving-average line. Default: Gold.
Vol MA Transparency (0-100) — transparency of the MA line; 0 = opaque. Default: 0.
Entry Points
Entry = Volume Spike (volume > MA * mult) — toggle the Volume Spike entry signal on or off; bullish bar on spike = BUY, bearish bar = SELL. Default: on.
Marker Size (1-5) — size of the signal arrow placed on the price chart. Default: 2.
Buy Marker Color — colour of the BUY signal arrow. Default: LimeGreen.
Buy Marker Transparency (0-100) — transparency of the BUY arrow; 0 = opaque. Default: 0.
Sell Marker Color — colour of the SELL signal arrow. Default: Red.
Sell Marker Transparency (0-100) — transparency of the SELL arrow; 0 = opaque. Default: 0.
Notifications
Push Notification — mobile push notification to the MetaTrader app. Default: off.
Alert Popup — pop-up alert inside the terminal. Default: off.
Email — email sent via terminal mail settings. Default: off.
Html Report — save each signal with a chart screenshot to VibeFox_Volume\result.html in the terminal's Files folder. Default: off.
Telegram — send each signal to your Telegram chat (alert text plus a chart screenshot) through the HTML report. Default: off.
Telegram bot token — the token of your Telegram bot, used to send the messages.
Telegram chat id — the id of the Telegram chat that receives the signals.
Panel / Settings
Panel width, px (300..800) — panel width in pixels. Default: 800.
Header size (1..6) — height of the panel header strip. Default: 1.
Theme — colour theme: Auto (follows chart), Dark, or Light. Default: Auto.
Row height (px) — height of each panel row in pixels. Default: 34.
Font size — panel font size. Default: 8.
Hide Footer — hide the footer strip at the bottom of the panel. Default: off.
Mini Header on collapse — show a minimal header bar when the panel is collapsed. Default: off.
Close on click outside — auto-collapse the panel when clicking outside it. Default: off.
Instance (unique per copy: 1,2,3...) — unique instance number; lets you run multiple independent copies on the same chart. Default: 1.
Panel Start Window — where the panel opens at launch: Subwindow or Chart. Default: Subwindow.