GB Footprint

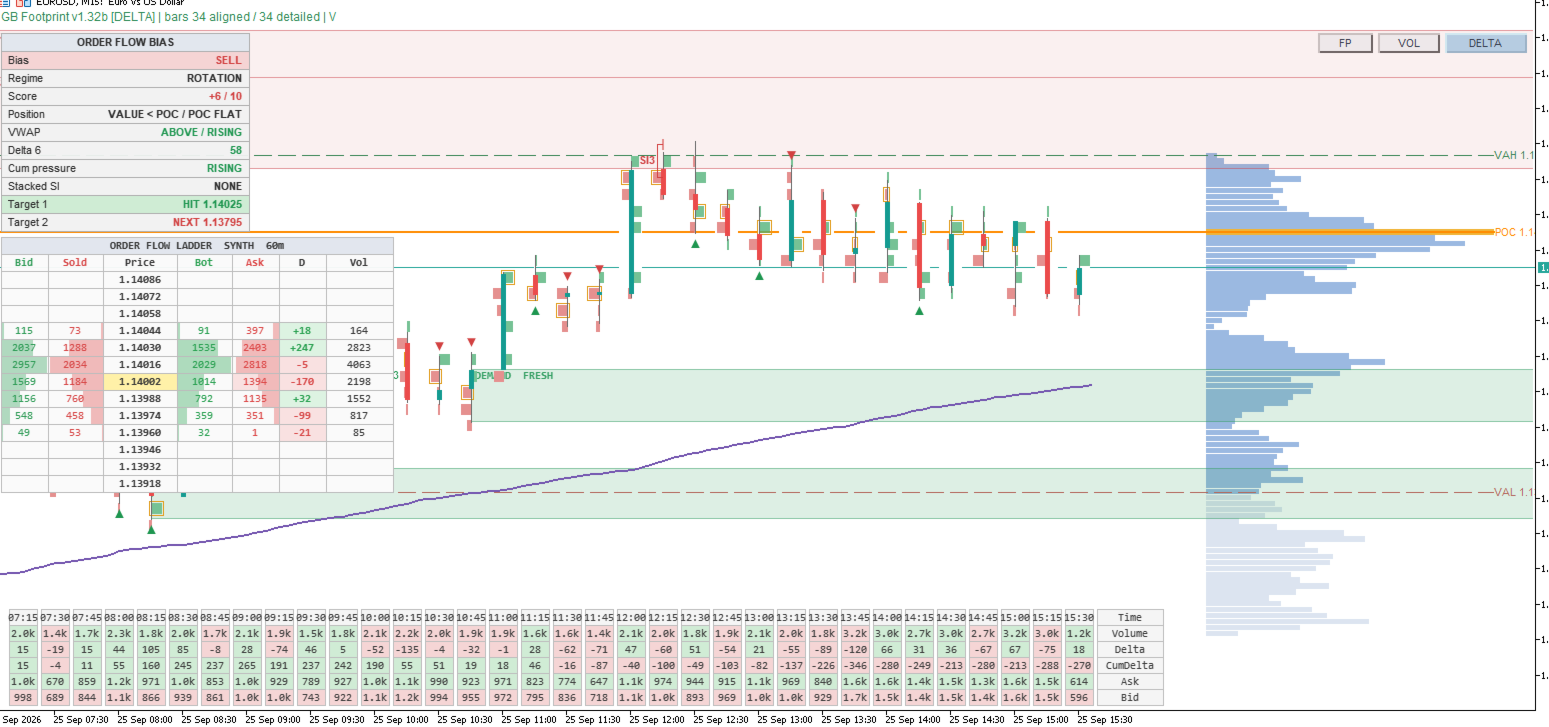
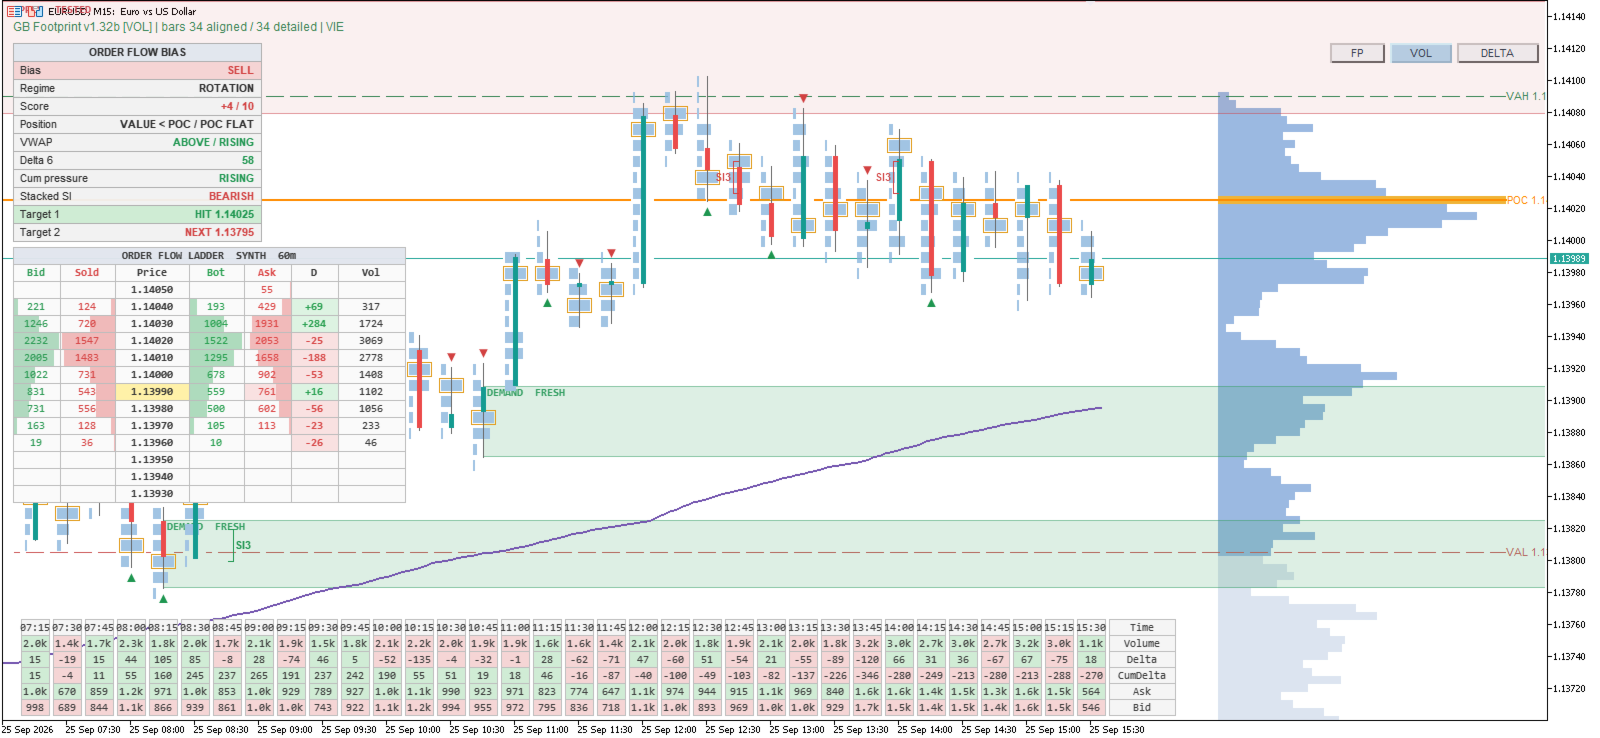
GB Footprint + Daily Volume Profile With ENTRY BUY OR SELL BIAS , TAKE PROFIT 1 TARGET  AND TAKE PROFIT 2 TARGET- GB FOOTPRINT is an MT5 order-flow and auction-market analysis indicator designed to combine footprint information, session volume structure, VWAP and a multi-factor directional bias into one clean chart.The indicator displays Bid × Ask activity at each price level inside recent candles, allowing the trader to see where buying and selling pressure occurred rather than relying only on the candle's OHLC structure.

This Indicator gives you all the tools to become successfull: Trend , Momentum, Volume, Structure, Orderflow Bias, Demand and Supply Zones and Cummulative Pressure. This is not just an indicator its a complete Trading System.

It combines this footprint data with a Daily Session Volume Profile, includThis iing POC, VAH and VAL, a session-reset VWAP, stacked imbalances, Delta, cumulative Delta pressure, synthetic absorption, Delta divergence and an integrated Order Flow Bias Engine.

The purpose is not simply to produce a BUY or SELL signal. The indicator attempts to answer three separate questions:

Where is price trading?
Relative to POC, VAH, VAL and VWAP.

What is order flow doing?
Through Delta, cumulative pressure, imbalance, absorption and divergence.

What market condition is developing?
Rotation, reversal, re-entry into value, or trend continuation.

Important note for Forex and CFDs

On centralized futures markets, true executed Bid/Ask order flow can be obtained from exchange trade data.

On OTC Forex, Gold CFDs and index CFDs, brokers often do not provide true centralized executed Bid/Ask volume.

For this reason, the indicator first uses MT5 BUY/SELL trade flags when the broker supplies them. If those are unavailable, it uses a tick-rule approximation:

  • uptick → classified as Ask/buy-side activity
  • downtick → classified as Bid/sell-side activity
  • unchanged tick → retains the previous direction

Therefore, on Forex and CFDs the footprint should be considered synthetic/estimated order flow, while still being useful for analysing relative pressure within that broker's data feed.

Main chart components

Footprint Candles

Each footprint candle displays:

BID volume on the left and ASK volume on the right.

The centre contains a thin traditional candle so price direction remains easy to see.

The indicator automatically adjusts price-row size to maintain readability when volatility or chart zoom changes.

Diagonal Imbalances

The indicator uses standard diagonal comparison logic.

Ask volume at one price is compared with Bid volume one row below.

Bid volume at one price is compared with Ask volume one row above.

The default imbalance requirement is 300%.

Highlighted green areas represent Ask-side imbalance and highlighted red areas represent Bid-side imbalance.

Candle POC

Each footprint candle has its own POC — the price row containing the highest total volume.

It is displayed with a subtle amber outline around the Bid/Ask values.

Stacked Imbalance

When several consecutive price levels contain imbalance in the same direction, the indicator identifies a stacked imbalance.

For example:

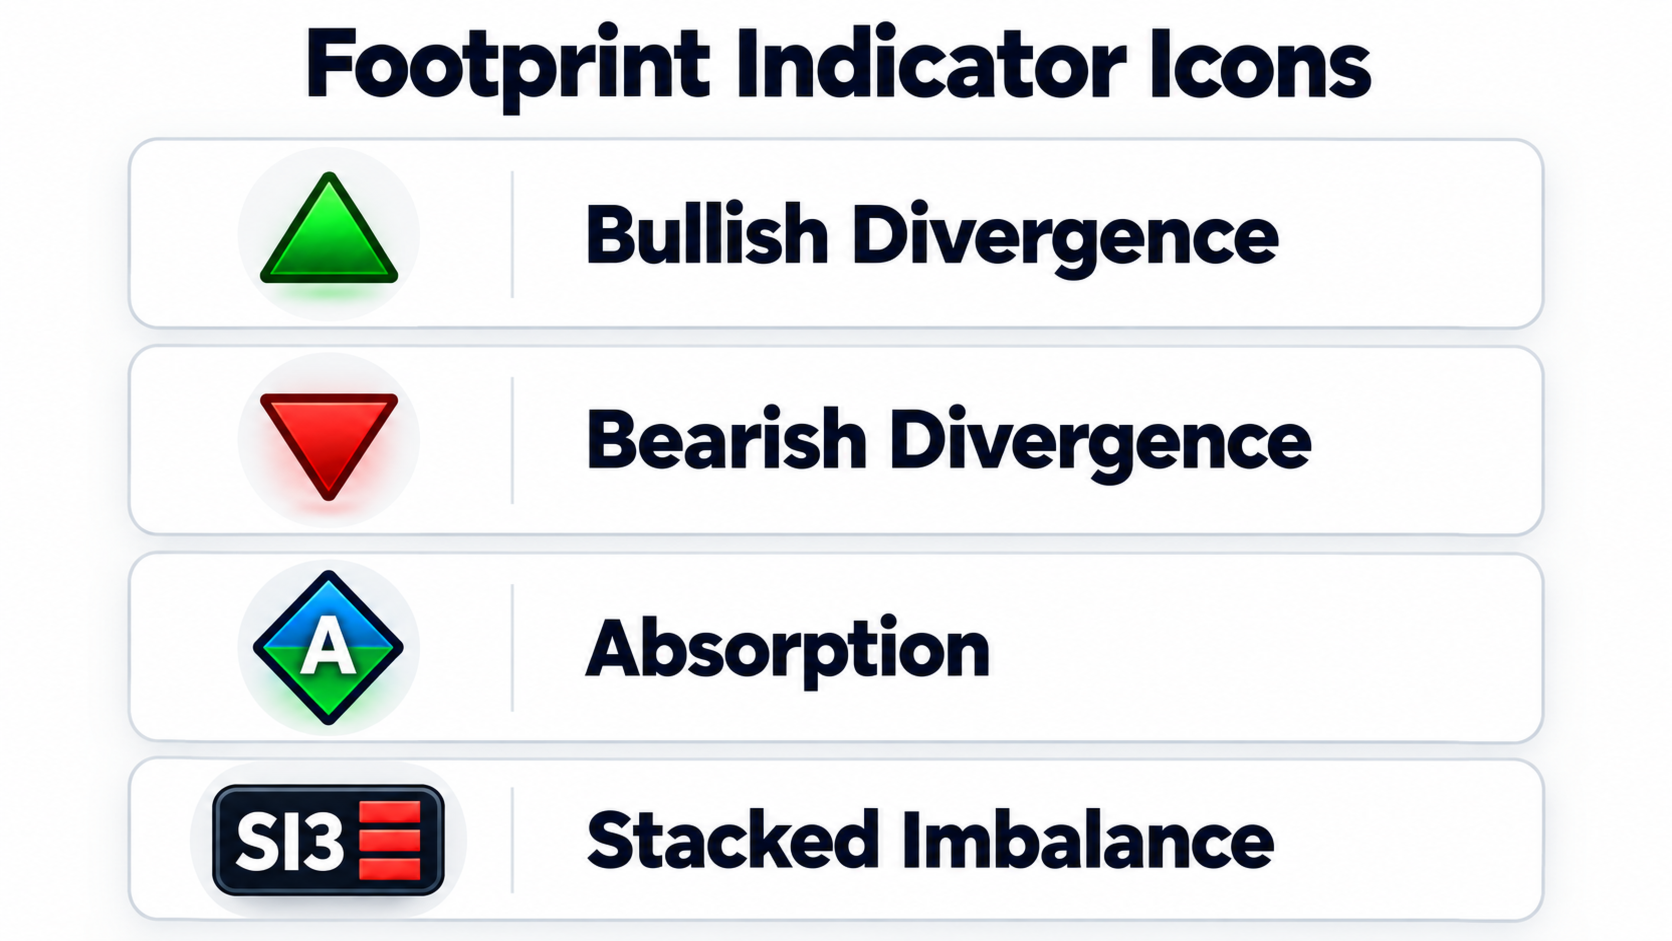
SI3 = three consecutive imbalance levels
SI4 = four consecutive imbalance levels

These areas can indicate concentrated aggressive participation.

Delta

Delta is calculated as:

Ask − Bid

Positive Delta indicates more buy-side activity.

Negative Delta indicates more sell-side activity.

Delta Divergence

The current divergence system identifies disagreement between candle direction and Delta.

A bearish candle with positive Delta produces a green ▲ below the candle.

A bullish candle with negative Delta produces a red ▼ above the candle.

This is intentionally a compact warning marker rather than an automatic reversal signal.

Absorption

The indicator contains a synthetic absorption detector.

Bullish absorption looks for unusually strong Bid/sell-side activity near the candle low followed by price rejection upward.

Bearish absorption looks for unusually strong Ask/buy-side activity near the candle high followed by price rejection downward.

Absorption is displayed using an outlined A diamond at the actual price level where it was detected.

Daily Session Volume Profile

The right side of the chart displays a volume-at-price profile calculated from the configured session start.

It identifies:

POC — Point of Control
The price containing the greatest session volume.

VAH — Value Area High
Upper boundary of the session Value Area.

VAL — Value Area Low
Lower boundary of the session Value Area.

The default Value Area contains approximately 70% of session volume.

These levels are also used directly by the Bias Engine.

Session VWAP

The indicator calculates VWAP from the same session start used by the Daily Volume Profile.

VWAP is calculated using:

Typical Price = (High + Low + Close) / 3

weighted by volume.

For Forex/CFDs it uses broker tick volume by default.

The Bias Panel interprets VWAP in a compact form such as:

ABOVE / RISING

BELOW / FALLING

ABOVE / FALLING

BELOW / RISING

The first word describes where price is relative to VWAP.

The second describes the direction of the session VWAP itself.

For example:

ABOVE / RISING is supportive of bullish conditions.

BELOW / FALLING is supportive of bearish conditions.

Mixed combinations indicate conflicting conditions.

Statistics Panel

The lower footprint table displays:

Row Meaning
Time Candle opening time
Volume Total footprint activity
Delta Ask minus Bid
CumDelta Running cumulative Delta across displayed footprint candles
Ask Total Ask/buy-side activity
Bid Total Bid/sell-side activity

Volume and Delta cells automatically change colour according to positive or negative Delta.

Order Flow Bias Engine

The Bias Engine combines several independent pieces of information instead of reacting to a single candle.

The panel displays:

Panel item Meaning
Bias STRONG BUY, BUY, NEUTRAL, SELL or STRONG SELL
Regime ROTATION, REVERSAL, REVERSAL INTO VALUE, TREND CONTINUATION or WATCH
Score Composite directional score
Position Price relative to POC/VAH/VAL
VWAP Price location and VWAP direction
Delta N Combined Delta over the selected lookback
Cum pressure Whether recent Delta pressure is strengthening or weakening
Stacked SI Bullish, bearish, mixed or none
Target 1 First contextual target
Target 2 Secondary target

The score considers session POC location, recent Delta, Delta momentum, stacked imbalance, absorption, divergence and VWAP.

VWAP intentionally has only a modest weighting so it confirms the footprint rather than controlling the signal.

With the current engine, recent Delta carries approximately ±2 points, Delta momentum ±2, stacked imbalance ±2, absorption ±2, divergence ±1, POC location ±1, VWAP location ±1 and VWAP direction ±1. The displayed final score is capped at -10 to +10.

Market regimes

ROTATION normally occurs while price remains inside the Value Area. POC becomes an important rotational target.

TREND CONTINUATION can occur when price is outside VAH/VAL and order flow continues to support movement away from value.

For continuation, targets use Value Area width projections:

T1 = 0.5 × Value Area width

T2 = 1.0 × Value Area width

projected beyond VAH or VAL.

REVERSAL occurs when price is outside value but order flow begins contradicting the breakout. The profile boundary and POC then become possible targets.

REVERSAL INTO VALUE identifies price returning through VAH or VAL after trading outside value with supporting reversal evidence.

Target rows automatically display HIT and NEXT as objectives are reached.

Smart Money Concepts:

BOS, CHOCH, FVG and Order Blocks

Contact the developer for a complete User Manual: grnrbennie@gmail.com


Recommended products
**   All Symbols   x   All Timeframes   scan just by pressing scanner button ** Discount: The price is 100$, But now it is just 39$, Limited time offer is active. *** Contact me  to send you instruction and add you in "Trend Reversal group" for sharing or seeing experiences with other users. + FREE   Trading Utility MT5 - Big Update: 2026/10/22 Introduction: Trendlines are the most famous technical analysis in trading . Trendlines continually form on the charts of markets across all the differe
TRI Visualizer
Yoshimi Mon 三 Ura
TRI Visualizer MT5 – Thermodynamic Market Analysis Overview The TRI (Thermal Range Indicator) Visualizer Enhanced is a rare market analysis indicator that goes beyond conventional technical analysis, applying principles of thermodynamics from physics. It interprets market price fluctuations as “thermodynamic energy,” enabling the highly accurate detection of subtle market changes that are often overlooked. Innovative Mechanisms 1. Dual Calculation Engines Classic TRI Mode Formula: |Close
MR Volume Profile 5
Sergey Khramchenkov
The "MR Volume Profile 5" indicator is a charting tool that displays trading volume at different price levels rather than time intervals. A key concept in volume profile is the point of control (POC)—the price level with the highest volume traded during the session or time range. While tools like VWAP or OBV provide volume trends, the "MR Volume Profile 5" indicator offers granular detail about where the most market activity occurs at specific price levels. This makes it a more precise tool for
Was: $249  Now: $99   Market Profile defines a number of day types that can help the trader to determine market behaviour. A key feature is the Value Area, representing the range of price action where 70% of trading took place. Understanding the Value Area can give traders valuable insight into market direction and establish the higher odds trade. It is an excellent addition to any system you may be using. Inspired by Jim Dalton’s book “Mind Over Markets”, this indicator is designed to suit the
This Volume Delta Profile is an advanced MetaTrader 5 indicator that visualizes   volume delta (order flow imbalance)   using a volume profile-style histogram. It shows the difference between buying and selling pressure at specific price levels, helping traders identify supply and demand zones. This indicator provides a unique perspective on market dynamics by visualizing the imbalance between buying and selling pressure, offering insights beyond traditional volume analysis. Core Concept Positiv
Desi Bulls PA King Pro
Muhammad Bilal Hussain Khan Muhammad
Desi Bulls PA King Pro — Pure Naked Price Action Sniper Indicator Desi Bulls PA King Pro is an institutional-grade, 100% NON-REPAINTING Naked Price Action indicator designed for precision scalping on Gold (XAUUSD) and Bitcoin (BTCUSD) on the M5 and M15 timeframes. Unlike conventional indicators that clutter your chart with lagging moving averages, RSI, or stochastics, PA King Pro uses pure candlestick geometry, fractal liquidity sweeps, and macro trend flow to identify high-probability instit
No Demand No Supply MT5
Trade The Volume Waves Single Member P.C.
No Demand No Supply   This indicator identifies   No Demand –No Supply candles to your chart and plots volume bars colored according to the signal. It can be applied to all timeframes or to a specific one only. It can also be used as regular volume indicator  with exceptional future of WEIGHTED VOLUME. Furthermore is has an alert notification, sound and email when a signals occurs. The indicator does not repaint but the alert will come on two candles back due to the definition of No Demand No Su
Cumulative Volume Delta MA-X MTF with Gradient Momentum This indicator performs multi-timeframe volume delta analysis for MetaTrader5. It calculates the net difference between buying and selling pressure by analyzing tick or real volume data, providing a visual representation of order flow sentiment. Indicator Logic and Features The indicator uses a mathematical approach to volume analysis: Data Sourcing: Supports both Real Volume (for Exchange assets) and OHLC Wick Proxy calculations (for Forex
Trend Master V2
Oratile Pitsoane
What Is Trend Master Pro? Trend Master Pro   is a professional-grade trend trading indicator built for MetaTrader 5. It was designed with one goal in mind — to keep you on the right side of the market at all times by combining three powerful technical tools into a single, clean, easy-to-read display directly on your price chart. Instead of cluttering your screen with multiple separate indicators, Trend Master Pro fuses an   EMA Ribbon trend filter , a   ZigZag swing point engine , and a   breako
This indicator presents an alternative approach to identify Market Structure. The logic used is derived from learning material created by   DaveTeaches (on X) Upgrade v1.10: + add option to put protected high/low value to buffer (figure 11, 12) + add  Retracements  value to buffer when Show Retracements When quantifying Market Structure, it is common to use fractal highs and lows to identify "significant" swing pivots. When price closes through these pivots, we may identify a Market Structure S
VWAP Analytics Advanced Suite for MetaTrader 5 Gain institutional-grade market insight with the VWAP Analytics Advanced Suite , a professional Volume Weighted Average Price indicator built exclusively for MetaTrader 5. This tool goes beyond a simple VWAP line; it is a complete analytical ecosystem designed to identify trend bias, measure market deviation, and provide high-probability entry and exit signals with precision timing. Whether you are a day trader, scalper, or swing trader, this su
The Gann Box (or Gann Square) is a market analysis method based on the "Mathematical formula for market predictions" article by W.D. Gann. This indicator can plot three models of Squares: 90, 52(104), 144. There are six variants of grids and two variants of arcs. You can plot multiple squares on one chart simultaneously. Parameters Square — selection of a Gann square model: 90 — square of 90 (or square of nine); 52 (104) — square of 52 (or 104); 144 — universal square of 144; 144 (full) — "ful
Trading Utility for Forex Currency Pairs Only not for Gold  Functions Auto Lot Calculation based on Risk Auto stoploss  Auto TakeProfit Breakeven Auto Close Half % Close in percentage with respect to the PIPs Pending Orders BuyLimit Sell Limit with distances BuyStop Sell Stop    with distances Trading Informations Risk in percentage For Multiple trades Combine Takeprofit and Combine Stoplosses
Time and Sales Tick
Pablo Filipe Soares De Almeida
Time & Sales Tick Indicator for MetaTrader 5 This indicator displays real-time trading tick information on MetaTrader 5 charts. It presents price, tick volume, and time. Functionality Displays tick data, including price, volume, and time, in a panel on the chart. Groups ticks into user-defined intervals, with color-coded price movements (green for upward, red for downward). Allows panel positioning in any chart corner.
LotSizeCalculator
Jaturakoop Saoloek
LotSizeCalculator — Risk-Based Trade Panel Place market & pending orders with the exact risk you intend — automatic lot sizing, draggable SL/TP, and live recalculation on every tick. Overview LotSizeCalculator is a lightweight on-chart panel for fast, disciplined order entry. Set your risk once — as a percentage of balance or a fixed money amount — and the panel calculates the correct lot size so that the real loss when your stop-loss is hit equals exactly what you configured, spread and commiss
Introducing the Power Trade Plus indicator designed by a small group of traders with a few years of experience trading the market profitably.  The Power Trade Plus is derived from the Power Trade indicator,  the indicator strive in powerful sniper entries and take profit levels,  with an algorithm that's can determine the markets volatility and Provides entries based on the current market volatility. This indicator is much more effective in stock ,currencies and indices.
POC level MT5
Mikhail Nazarenko
The indicator automatically calculates       and displays the level of the maximum       real   volume Point Of Control (POC) of the Market Profile for the   array of candles   highlighted by a rectangular area. This will significantly increase the accuracy of your position entries when trading POC bounces and reversals. Attention when testing the demo version!   In the MT5 strategy tester , there is no possibility of dragging a rectangle and this is a problem of limitations of the MT5 strategy
Official BlueDigitsFx Ecosystem Access Get infrastructure updates, workflow resources, product releases, and ecosystem access through the official BlueDigitsFx ecosystem. Telegram Ecosystem Website MT4 Version BlueDigitsFx Spike And Strike Reversal MT5 — Mixed Oscillator for Market Reversal & Momentum Analysis BlueDigitsFx Spike And Strike Reversal is a composite oscillator that combines multiple indicator signals to help traders identify possible market reversals, momentum shifts, and exhau
Price Magnet — Price Density and Attraction Levels Indicator Price Magnet is a professional analytical tool designed to identify key support and resistance levels based on statistical Price Density. The indicator analyzes a specified historical period and detects price levels where the market spent the most time. These zones act as “magnets,” attracting price action or forming a structural base for potential reversals. Unlike traditional Volume Profile tools, Price Magnet focuses on price-time d
Wapv Price and volume
Eduardo Da Costa Custodio Santos
The WAPV Price and Volume Indicator for MT5 is part of the ( Wyckoff Academy Wave Market ) and (Wyckoff Academy Price and Volume) toolset. The WAPV Price and Volume Indicator for MT5 was created to make it easy to visualize the volume movement on the chart in an intuitive way. With it you can observe the moments of peak volume and moments when the market has no professional interest Identify moments when the market is moving by inertia and not by movement of "smart money". It consists of 4 color
Fabii Half Trend Baseline
Fabien Georges Andre Guillemaud
Stop trading against the higher timeframe trend. Two baselines, one chart. No repaint. Any pair, any timeframe. On your chart in 2 minutes. Free demo in the Strategy Tester. Get more indicators here Baselines, volatility filters and oscillators. No repaint. Why you need it You enter a trade because a line turned green on your chart. Then you open a higher timeframe and see that the bigger trend points the other way. The signal was real. The trend behind it was not on your side. Every trade ta
Like the logic of this tool? Explore the full ecosystem of professional indicators and utilities, built by a trader for traders: All author's products in MQL5 Market: https://www.mql5.com/en/users/musa1994/seller Trading philosophy and details: https://developer-mql4-mql5.netlify.app/ Volume Profile + CVD is a professional volume analysis indicator for MetaTrader 5 that displays volume distribution by price levels and cumulative volume delta. The indicator answers two key trader questio
MarketPredict Pro – Advanced Multi‑Layer Market Analysis   How It Works MarketPredict Pro combines six independent analytical layers to generate highly accurate predictions for the next candle.   6‑Layer Analysis Buyers/Sellers Pressure   – measures the strength of buyers vs. sellers Trend Strength   – 20‑period SMA trend calculation Volatility   – ATR‑like volatility model (14 periods) Market Pressure   – cumulative pressure from the last 5 bars Prediction Engine   – multi‑factor nex
Harmonic Pattern Structure Harmonic Pattern Structure is a professional MetaTrader 5 indicator that automatically detects classic harmonic patterns using strict Fibonacci ratio validation and XABCD price structure. Designed for traders who value precision, clean visuals, and structured analysis, the indicator highlights potential reversal zones based on price geometry, supporting consistent and objective decision-making. SUPPORTED HARMONIC PATTERNS Gartley (222) Butterfly Bat Crab Shark Cy
CRYPTO ZEUS DUAL-CORE PROTOCOL  Advanced Crypto Matrix: Supertrend AI + External Sync Module - [NEW] 24/7 Crypto Unlock: The EA now fully supports weekend trading by auto-detecting Crypto assets. - [NEW] Continuous Trend Rider: Re-enters trades continuously on pullbacks if the macro-trend remains strong, maximizing profit on long runs. - [NEW] Ghost Trailing Stop: Added a virtual trailing stop to fully ride breakouts instead of exiting at fixed Fibo targets. - [NEW] Preset System: Added a buil
"Impulses and Corrections 5" is created to help traders navigate the market situation. The indicator shows multi-time frame upward and downward "Impulses" of price movements. These impulses are the basis for determining the "Base" , which is composed of zones of corrections of price movements, as well as "Potential" zones for possible scenarios of price movement. Up and down impulses are determined based on a modified formula of Bill Williams' "Fractals" indicator. The last impulse is always "U
Weis Wave Scouter
Jean Carlos Martins Roso
Discover the power of advanced volume analysis with Weis Wave Scouter, a revolutionary indicator for MetaTrader 5 that combines the proven principles of the Wyckoff method and Volume Spread Analysis (VSA). Designed for traders seeking precision and depth in their operations, this indicator offers a tactical reading of the market through cumulative volume wave analysis, helping to identify key points of trend reversals and continuations. Weis Wave Scouter features a clear visual interface with co
VolumeDeltaBars
Stanislav Korotky
This indicator is a conventional analytical tool for tick volumes changes. It calculates tick volumes for buys and sells separately, and their delta on every bar, and displays volumes by price clusters (cells) within a specified bar (usually the latest one). The algorithm used internally is the same as in the indicator VolumeDeltaMT5 , but results are shown as cumulative volume delta bars (candlesticks). Analogous indicator for MetaTrader 4 exists - CumulativeDeltaBars . This is a limited substi
PZ Support Resistance MT5
PZ TRADING SLU
3.71 (7)
Unlock key market insights with automated support and resistance lines Tired of plotting support and resistance lines? This is a multi-timeframe indicator that detects and plots supports and resistance lines in the chart with the same precision as a human eye would. As price levels are tested over time and its importance increases, the lines become thicker and darker, making price leves easy to glance and evaluate. [ Installation Guide | Update Guide | Troubleshooting | FAQ | All Products  ] Boo
Visual CrossPulse Dynamics Indicator
AL MOOSAWI ABDULLAH JAFFER BAQER
Visual CrossPulse Dynamics: Trade with the Market's True Rhythm Unlock a new level of market insight with Visual CrossPulse Dynamics, a sophisticated trading indicator designed to adapt to ever-changing volatility and reveal the true direction of the trend. Are you tired of indicators that lag in fast-moving markets or give false signals during consolidation? The Visual CrossPulse Dynamics indicator solves this problem by using an advanced, adaptive algorithm that intelligently adjusts to the m
Buyers of this product also purchase
Trend Sniper X
Sarvarbek Abduvoxobov
4.86 (43)
Trend Sniper X is a multi-timeframe trend-following indicator for MetaTrader 5 that helps traders identify trend direction and potential reversal points with clarity and precision. for MT4: https://www.mql5.com/en/market/product/193245 Price Information: The current price is promotional and is subject to change as upcoming updates and new features are released. Bonus Offer: To get the FREE Auto-Trade Assistant EA for this indicator, please message the author after purchasing. Code2Profit Channe
Smart Trend Trading System — MetaTrader 5 Message me on MQL5 after purchase to receive Smart Universal Expert Advisor for FREE, plus the online course, PDF manual, and private group access. STTS brings trend direction, entry and exit signals, reversal zones, and important price levels together on your chart. Follow the system manually, or connect a separate compatible EA for automated execution using your chosen settings. ONE SYSTEM. FOUR TRADING APPROACHES. STTS organizes its trading approaches
A new King in town - Indicator + Order management indications(tp1+tp2+tp3) + Optional Telegram Signal sender   INCLUDED (FREE) + Bonus EA Robot ( FULL TRADING  and SIGNAL SYSTEM ) Our best EA for Gold: Gold Slayer TRY > Reversion Queen  Expert advisor >JOIN Community Channel < NEW Free Automation EA link < click here ( disclaimer: this is new and still on testing and phase , use at your risk on demo) Free Telegram Bridge < click here  This indicator includes an advanced Strategy, a trading sys
Zoryk Gold
Reda El Koutbane
4.78 (18)
discount ends SOON next price 69 $ ZORYK — Advanced XAUUSD Signal System for MetaTrader 5 You know the feeling. You spend time analyzing gold. You wait for the entry. You finally open the trade, and price immediately moves against you. You close too early, move the Stop Loss or hesitate for a few seconds. Then the market reaches the exact destination you originally expected without you. The direction was not always the problem. The real problem was uncertainty. You did not know exactly where th
Ultra Indicator
Ihor Otkydach
5 (1)
ULTRA is a technical indicator that operates on an “all-in-one” basis—it independently analyzes the market, generates trading signals, displays levels for setting stop-loss orders, and suggests when to close trades to lock in profits or minimize losses. In other words, it doesn't matter if you don't know how to analyze the market, determine levels—where to set your stop-loss—or struggle with money management. ULTRA will do all of that for you! BUYER BONUS: After purchasing the ULTRA indicator, s
M5 Sniper
MeanFX
5 (3)
Get your trading edge in the line of sight M5 Sniper   is a new indicator by MeanFX. It combines   precise trading signals   with   adaptive TP/SL levels   - creating best possible statistical trades as a result! The price increases every 5 purchases, the next price is 79$ Message me after purchase to receive tips/guide and bonus EA Auto Optimisation only works on LIVE chart , needs data feed >JOIN Community Channel < What makes it stand out?   Proven statistical performance   on Gold XAUUSD
In 2019 I showed the whole world what this indicator can do. I traded its signals by hand, on a real account, in the open — the account was monitored live on Myfxbook, and I covered my experiment in detail on Facebook. The result: $10,000 became $941,411 in four months. The risk was deliberately extreme — the drawdown reached 54%, because in our profession profit and risk always go hand in hand. The Myfxbook screenshot is the first picture in the gallery. Looks like congratulations are in order:
SuperScalp Pro
Van Minh Nguyen
4.54 (37)
SuperScalp Pro - Professional Multi-Layer Confluence Scalping System SuperScalp Pro is an advanced scalping indicator that upgrades the classic Supertrend with multiple intelligent confirmation filters. It helps you identify higher-probability Buy/Sell opportunities while significantly reducing false signals. Clear Buy and Sell arrows appear directly on the chart, along with automatic ATR-based Stop Loss and Take Profit levels calculated in real time. After purchase, please message me on MQL5 to
Gann Made Easy   is a professional and easy to use Forex trading system which is based on the best principles of trading using the theory of W.D. Gann. The indicator provides accurate BUY and SELL signals including Stop Loss and Take Profit levels. You can trade even on the go using PUSH notifications. PLEASE CONTACT ME AFTER PURCHASE TO GET TRADING  INSTRUCTIONS   AND GREAT EXTRA INDICATORS  FOR FREE! Probably you already heard about the Gann trading methods before. Usually the Gann theory is a
SMC Intraday Formula
VividMind Digital Solutions
5 (26)
Secure the Lowest Price Today. After purchase, contact via   MQL5 inbox   to receive your buyer kit and bonus. Let's be honest first. No indicator will make you profitable on its own. If someone tells you otherwise, they're selling you a dream. Every indicator that shows perfect buy/sell arrows can be made to look flawless — just zoom into the right window of history and screenshot the winners. We won't do that. SMC Intraday Formula is a tool. It reads the market structure for you, maps the hig
M1 Sniper MT5
Oleg Rodin
5 (7)
M1 SNIPER  is an easy to use trading indicator system. It is an arrow indicator which is designed for M1 time frame. The indicator can be used as a standalone system for scalping on M1 time frame and it can be used as a part of your existing trading system. Though this trading system was designed specifically for short-term trading, it still can be helpful for all traders. This trading system can be used with any forex pair and time frame, though lower time frames are recommended from M1 up to M
GoldenX Entry MT5
VividMind Digital Solutions
5 (17)
Price will increase by $20 every 10 buyers to maintain premium value. After purchase, contact via   MQL5 inbox   to receive your buyer kit and bonus. You have probably tested dozens of indicators before. But we are not here to be “just another signals indicator.” Behind GoldenX Entry is intensive research & development focused on building sophisticated algorithms designed to adapt to the real behavior of every instrument — not generic signals recycled everywhere else. From advanced Auto Optim
Gold Trend Coach MT5
Cristhian Alexander Gaibor Cuasquer
5 (4)
Gold Trend Coach is a gold (XAUUSD) trend indicator for MetaTrader 5 with buy and sell signals, stop loss and three take profit targets confirmed on candle close (no repaint), a coach that guides you from the entry to TP3, a multi-timeframe dashboard and alerts to your phone and Telegram. Built for M1 and M5 scalping and M15 intraday during the London and New York sessions. BONUS: FREE Auto-Trade EA for Gold Trend Coach. Message me after purchase and I send you the EA that trades the indicator s
Next Update — Version 2.52 Coming Soon! [NEW] Get Ready for 4 Major New Features Designed to Enhance Your Market Analysis and Trading Workflow We’re taking market analysis to the next level with 4   new features designed to meet your trading needs. Introducing: TRADE OVERVIEW DASHBOARD CONFLUENCE AT ZONE STRONG & WEAK HIGH/LOW OPTIMAL TRADE ENTRY  —   OTE 1. TADE OVERVIEW DASHBOARD  A dashboard that helps you understand the overall market picture more easily, providing guidance to support yo
Atomic Analyst MT5
Issam Kassas
4.5 (64)
Atomic Analyst — MetaTrader 5 Message me on MQL5 after purchase to receive Smart Universal Expert Advisor for FREE, plus the online course, PDF manual, and private group access. Atomic Analyst brings price action, trend direction, entry and exit signals, Stop Loss and multiple Take Profit levels together on your chart. SEE THE SIGNAL. UNDERSTAND THE SETUP. Atomic Analyst organizes its analysis into clear visual information: • Buy and sell arrows to identify potential entries. • Stop Loss and mul
Adaptive Price Action Engine Buy Indicator- Get EA Based on it for FREE. Self-Optimizing Multi-Timeframe Trend & Candlestick Intelligence Markets do not behave the same way all the time—and not every price-action pattern has the same value in every market regime. Adaptive Price Action Engine is designed to adapt to changing market conditions by combining trend structure, multi-timeframe analysis, candlestick patterns, and statistical optimization into one analytical framework. Two Adaptive Mode
ARICoins
Temirlan Kdyrkhan
ARICoin is a powerful trading companion designed to generate high-probability entry signals with dynamic TP/SL/DP levels based on volatility. Built-in performance tracking shows win/loss stats, PP1/PP2 hits, and success rates all updated live. Key Features: Buy/Sell signals with adaptive volatility bands Real-time TP/SL/DP levels based on ATR Built-in MA Filter with optional ATR/StdDev volatility Performance stats panel (Success, Profit/Loss, PP1/PP2) Alerts via popup, sound, push, or email Cust
Boba Analysis Suite
Trade Ready Solutions LLC
5 (2)
Boba Analysis Suite Boba Analysis Suite is an analytical indicator for MetaTrader 5. It brings market structure, relevant price zones and broader market context together in a single chart view. Developed through practical experience as a trader and trading coach, it supports a structured analysis process: assessing market direction, identifying important levels and considering multiple timeframes together. Analysis in Context Individual signals gain meaning through context. Boba Analysis Suite h
ScalpPoint
Temirlan Kdyrkhan
ScalpPoint is a powerful trading companion designed to generate high-probability entry signals with dynamic TP/SL/DP levels based on volatility. Built-in performance tracking shows win/loss stats, PP1/PP2 hits, and success rates — all updated live. Key Features: Buy/Sell signals with adaptive volatility bands Real-time TP/SL/DP levels based on ATR Built-in MA Filter with optional ATR/StdDev volatility Performance stats panel (Success, Profit/Loss, PP1/PP2) Alerts via popup, sound, push, or emai
Auto Optimized SpeedAngle is an institutional-grade momentum vectoring system that eliminates curve-fitting through continuous Walk-Forward Optimization (WFO). Rather than relying on static inputs that degrade when market regimes shift, the indicator dynamically recalibrates its parameters using Out-of-Sample (OOS) validation, ensuring the displayed signals represent genuine statistical edges rather than historical anomalies. By shifting the focus from subjective visual angles to normalized, qua
Zain Gold Scalping
Ahmed Gamal Abdel Nasser Mohamed
A complete price-action analysis tool built around dual independent entry logic, each confirmed against a volatility band, combined with a configurable set of nine optional confirmation filters that let you shape exactly how conservative or aggressive the tool's signals behave. Core Strategy Two independent entry setups, each triggering only when price moves outside a dynamic volatility band — giving two distinct ways to spot potential reversal points, which can be used together or separately.
Tokyo mt5 Indicator
Vasiliy Strukov
5 (14)
Tokyo Indicator provides a clear visual overview of trend direction, potential trading signals, and market conditions. Its colour-coded, stepped trend line distinguishes bullish phases in blue from bearish phases in magenta. Matching directional arrows highlight potential buying and selling opportunities when the displayed trend changes. An integrated dashboard brings together the current signal, market bias, momentum, volatility, and signal quality in one convenient view. This allows traders t
Azimuth Pro
Ottaviano De Cicco
5 (7)
Azimuth Pro V2: Synthetic Fractal Structure and Confirmed Entries for MT5 Overview Azimuth Pro is a multi-level swing structure indicator by Merkava Labs . Four nested swing layers, swing-anchored VWAP, ABC pattern detection, three-timeframe structural filtering, and closed-bar confirmed entries — one chart, one workflow from micro-swings to macro-cycles. This is not a blind signal product. It is a structure-first workflow for traders who care about location, context, and timing. Halloween P
Superhero
Ihor Otkydach
5 (3)
The SUPERHERO indicator is a multi-currency trading system designed on an "all-inclusive" basis. The indicator independently analyzes the market and provides signals on when to open and close trades. It uses Stop Loss and Take Profit orders. The R:R ratio is 1:1. This system can send push notifications to your smartphone, so you can place trades "on the go" without needing to be tied to a PC. It's perfect for proprietary trading firms. A BONUS FOR EVERY CUSTOMER: Every buyer of this indicator wi
Multi Currency Strength and Momentum Indicator MT5 Dynamic Forex28 Navigator is the evolution of our long-time, popular indicators, combining the power of three into one: Advanced Currency Strength28 Indicator (700 reviews) Advanced Currency IMPULSE with ALERT (530 reviews) CS28 Combo Signals (recent Bonus) The two predecessor indicators together have received more than 1,200 reviews on the MQL5 Market and have been a staple in the MT4 community since 2016. Dynamic Forex28 Navigator MT5 carries
Volatility Master for MetaTrader is a real-time dashboard tool that scans up to  50 symbols  to identify high-volatility , trending markets instantly. With bullish/bearish signals, customizable alerts, and a user-friendly interface, it helps you avoid range-bound conditions and focus on high-probability trades. Clarity leads to confidence. Trade confidently and protect your capital effectively with this powerful dashboard. We don't offer free or bonus indicators in exchange of reviews from you.
Apex Patterns PRO Buy Indicator - Get Expert Advisor Based on it for FREE. Self-Optimizing Chart Pattern & Breakout Intelligence Traditional pattern scanners rely on fixed inputs, often underperforming when market volatility and structures shift. Apex Patterns PRO is designed to adapt to changing market conditions by combining structural chart pattern recognition, momentum filtering, and statistical self-optimization into one analytical framework. Adaptive Scanning Engine Self-Optimizing Patter
Neuro Poseidon MT5
Daria Rezueva
4.68 (53)
Neuro Poseidon is a new indicator by Daria Rezueva. It combines precise trading signals with adaptive TP/SL levels - creating best possible trades as a result! Message me and get  Neuro Poseidon Assistant  as a gift to automize your trading process! What makes it stand out? 1. Proven profitability on all assets and timeframes 2. Only confirmed BUY and SELL signals present on the chart 3. Adaptive TP & SL levels generated by the software for each trade 4. Easy to understand - suitable for al
Break and Retest Hunter is a powerful MetaTrader 5 indicator designed to automatically identify support and resistance levels, breakout structures, and potential retest opportunities in real time. Bonus Indicator: After purchasing Break and Retest Hunter , contact me to receive Trade Indicator Assistant EA completely free as a bonus utility. $65 for the next 10 copies . Next price is $120.  Combining adaptive market analysis, clear BUY/SELL signals, Fibonacci-based profit targets, and a premiu
FiboSniper Pro
Van Minh Nguyen
5 (4)
FiboSniper Pro - Multi-Filter Fibonacci System with Auto SL/TP and Control Panel FiboSniper Pro is a technical indicator that combines dynamic Fibonacci Envelopes with multiple confirmation filters to generate selective Buy and Sell signals. Fibonacci levels are calculated from Moving Average and ATR, then filtered by ADX, EMA, RSI, ATR, Volume, Time and Candle structure. The indicator displays automatic ATR-based Stop Loss and Take Profit levels directly on the chart, along with an interactive
More from author
Garner Risk Calculator
Garner Edward Bennie
Garner Risk Calculator for MetaTrader 5 ## Visual trade planning, position sizing and manual order placement Garner Risk Calculator is an MT5 Expert Advisor that brings trade planning and position sizing directly onto your chart. Position your Stop Loss and Take Profit, choose the amount you want to risk, and view the calculated lot size before placing an order. The dark navy panel with blue accents provides a clear view of your proposed trade. It is a manually operated calculator and order-e
FREE
Torso Pro EA
Garner Edward Bennie
Torso EA is a fully automated trend-following system designed to trade clean market momentum using Heiken Ashi structure, MA direction and slope confirmation. It adapts dynamically to volatility using ATR-based stop loss, trailing stop and risk scaling, making it suitable for scalping, intraday and swing trading on Forex, Metals, Indices and Crypto pairs. Torso focuses on quality entries, when price transitions from pullback to trend continuation. No grid, no martingale, no averaging. Just preci
Gonzonator EA
Garner Edward Bennie
Gonzonator Pro — Smart Fibonacci Trend EA – Its not just an EA- It’s a complete Trading System Gonzonator Pro  is a fully-automated trading system designed around Fibonacci level reactions , trend filters , volatility filters . It is engineered for stable execution., ATR volatility analysis, and multi-MA filtering. includes a powerful built-in dashboard scanner that displays trend and volatility conditions across MarketWatch symbols . The EA identifies high probability reversal and continuation
Milos EA
Garner Edward Bennie
Milos v3.2 is an advanced trend-following robot engineered around Break of Structure (BOS) logic and multi-layered entry confirmation. Designed for precision and robustness, Milos detects structural highs/lows, identifies valid trend direction, and executes trades only when the market confirms strength via a clean BOS event. Once in a valid trend, Milos opens a primary position on the first BOS breakout. If price retraces without violating the overall structure, the EA executes a smart second-en
Garner Trade Pad EA
Garner Edward Bennie
Garner Trade Pad EA is an MT5 Expert Advisor that brings trade planning and position sizing directly onto your chart. Position your Stop Loss and Take Profit, choose the amount you want to risk, and view the calculated lot size before placing an order.TP1 buy The dark navy panel with blue accents provides a clear view of your proposed trade. It is a manually operated calculator and order-entry tool: you choose the direction, levels and timing of every trade. ## Movable chart panel - Drag t
Filter:
pbsousa
125
pbsousa 2026.10.14 14:43 

User didn't leave any comment to the rating

Garner Edward Bennie
462
Reply from developer Garner Edward Bennie 2026.10.14 15:03
Thank you, Sir always available to assist.
Reply to review