Directional Force Histogram
- Indicatori
-
Edoardo Centorame
 Sono un trader professionista e sviluppatore MT5 con esperienza pluriennale nel trading e nello sviluppo di strumenti avanzati per il supporto alle decisioni operative. Creo sistemi e strumenti visivi per aiutare i trader a interpretare i trend di mercato e migliorare le proprie strategie operative.
 - Versione: 1.0
- Attivazioni: 10
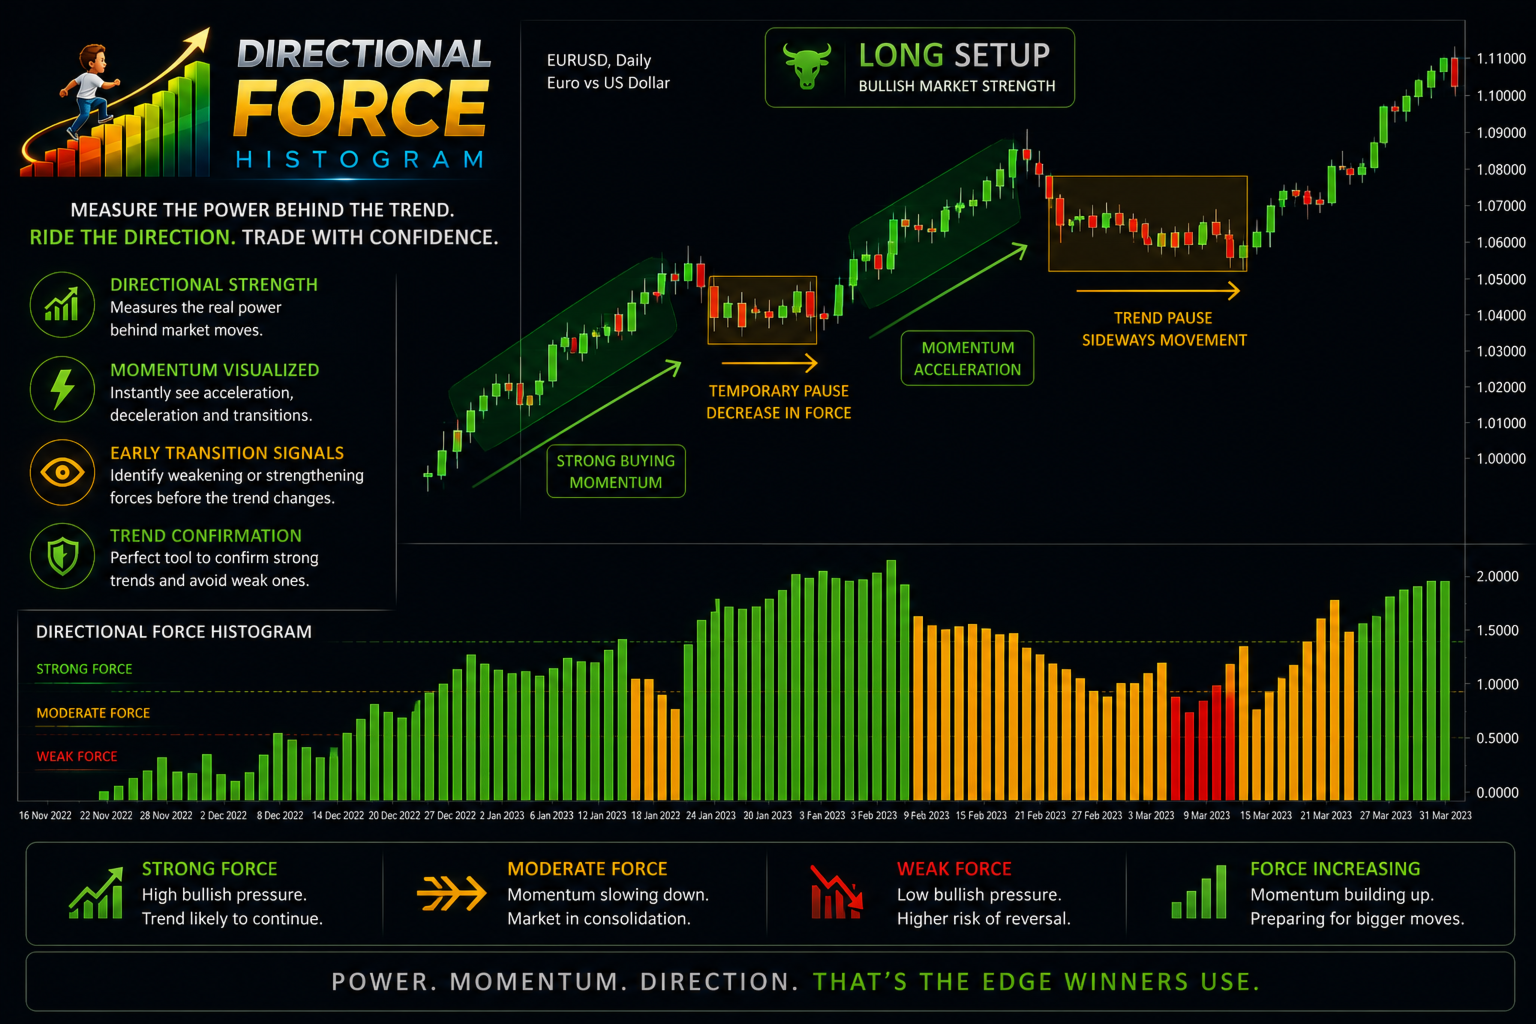
Directional Force Histogram DFH è un indicatore a istogramma progettato per specchiare lo stato del mercato e aiutare il trader a interpretare in modo immediato pressione direzionale, forza del movimento e fasi di rallentamento o transizione.
DFH non fornisce segnali automatici di acquisto o vendita.
Il suo obiettivo è offrire contesto operativo, migliorando la qualità delle decisioni e la gestione della posizione.
Cosa misura DFH
Pressione rialzista e ribassista
Intensità del movimento
Rallentamenti e perdita di spinta
Fasi di transizione e neutralità
Qualità e maturità del trend
L informazione è rappresentata tramite un istogramma colorato, facile da leggere e adatto al trading discrezionale.
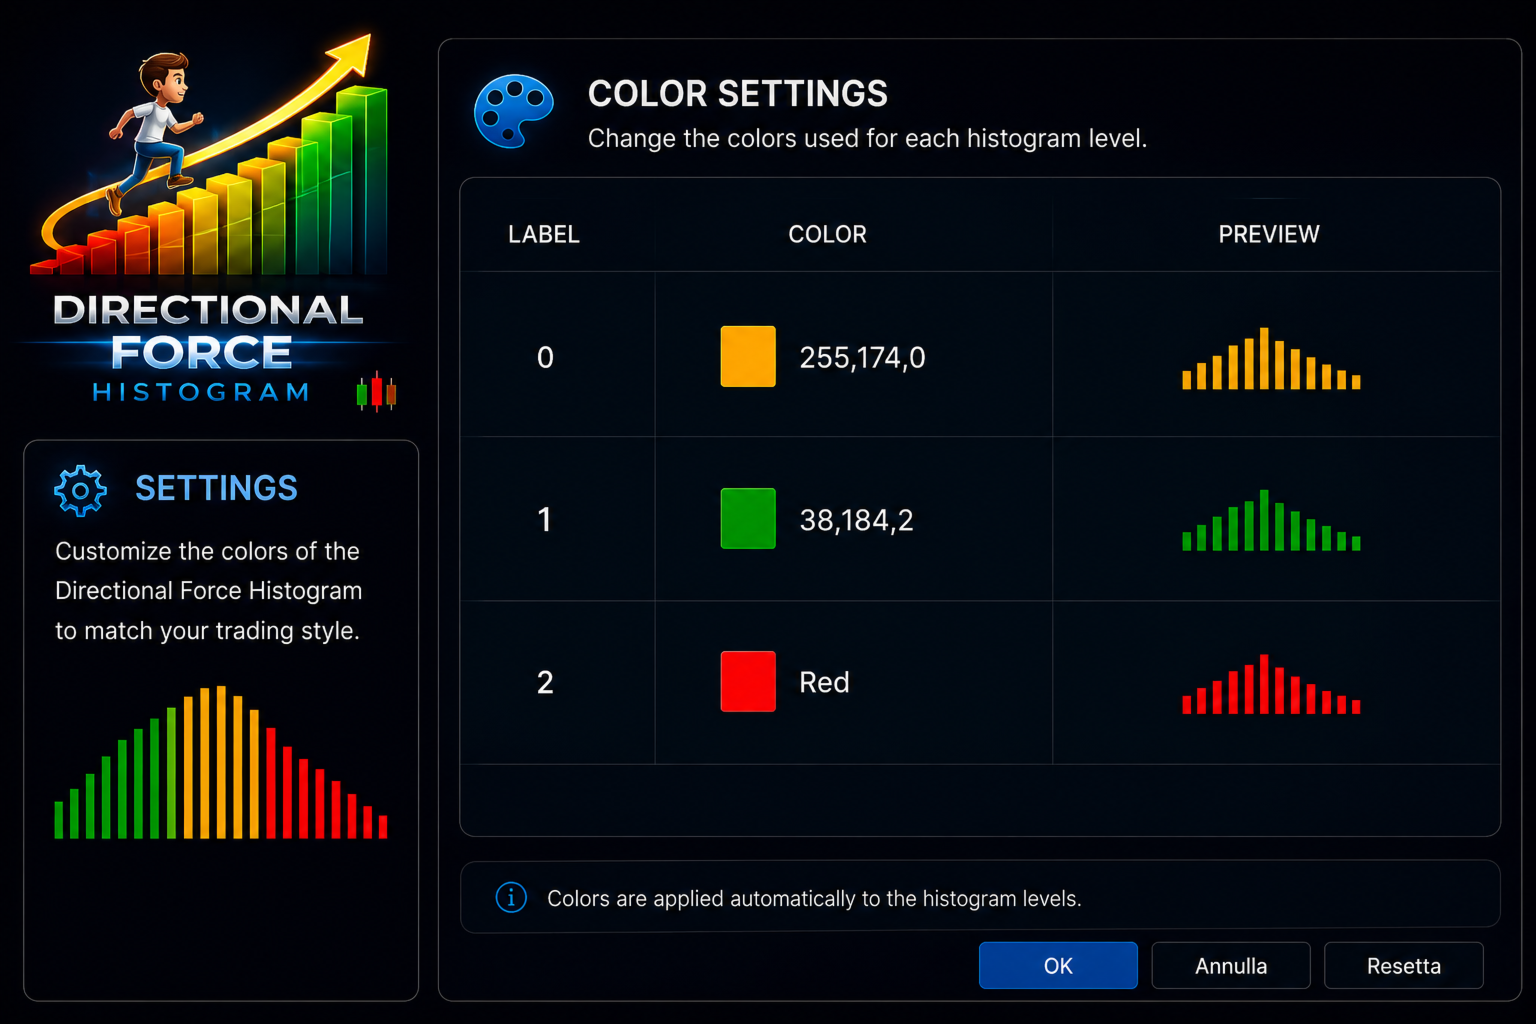
Lettura dei colori e della dinamica delle barre
Directional Force Histogram utilizza colore e andamento delle barre per descrivere lo stato del mercato.
Barre verdi crescenti Pressione rialzista in aumento
Barre verdi che aumentano progressivamente indicano pressione rialzista in espansione.
Il mercato sta accelerando al rialzo con buona partecipazione.
Uso tipico:
contesto favorevole al mantenimento di posizioni long
evitare operazioni short contro forza crescente
conferma di trend rialzista sano
Barre verdi decrescenti Rallentamento rialzista
Barre ancora verdi ma in riduzione indicano perdita di spinta rialzista.
Il trend non è negato, ma mostra segni di affaticamento.
Uso tipico:
gestione della posizione
prese di profitto parziali
stop più protettivi
evitare nuove entrate tardive
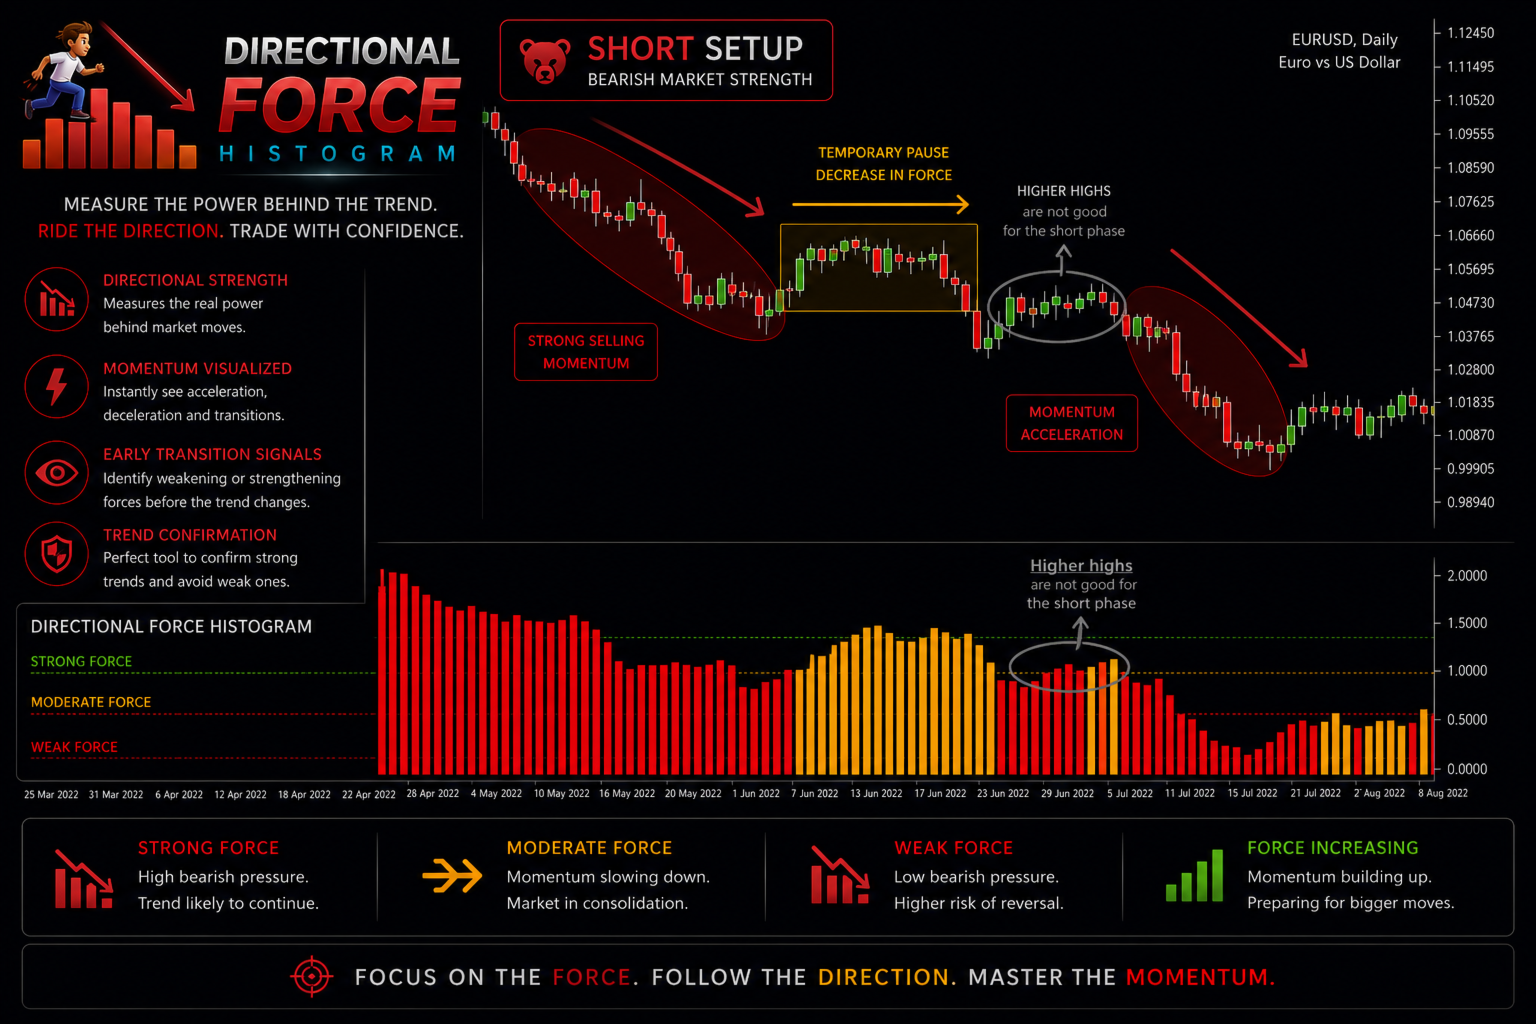
Barre rosse decrescenti Pressione ribassista strutturata
Barre rosse che si riducono progressivamente rappresentano una pressione ribassista ordinata e controllata.
Tipica dei trend ribassisti puliti e ben strutturati.
Uso tipico:
mantenimento di posizioni short
conferma di continuità ribassista
evitare operazioni long contro contesto ribassista
Barre rosse crescenti Impulso ribassista possibile climax
Barre rosse in aumento indicano accelerazione ribassista impulsiva.
Spesso associate a fasi di panico o movimenti finali.
Uso tipico:
gestione prudente delle posizioni short
attenzione a possibili rimbalzi tecnici
evitare nuove entrate tardive
Barre arancioni Transizione e neutralità
Le barre arancioni indicano perdita di direzionalità e fase di equilibrio.
Spesso precedono un cambio di regime o una fase laterale.
Uso tipico:
zona NO TRADE
attesa di una nuova struttura chiara
filtro per ridurre overtrading
Lettura avanzata: rallentamento ed esaurimento del long
Arancione dopo una fase verde Long in rallentamento
Quando, dopo una sequenza significativa di barre verdi, l istogramma passa in arancione, il movimento rialzista entra in una fase di rallentamento.
In questa condizione:
il trend rialzista è ancora valido
la pressione dei compratori diminuisce
aumenta la probabilità di consolidamento
Uso tipico:
gestione attiva del long
prese di profitto parziali
stop più stretti
evitare nuove entrate aggressive
Prime barre rosse dopo l arancione Long vicino all esaurimento
Se dopo la fase arancione iniziano a comparire barre rosse, la pressione rialzista è quasi esaurita e la forza ribassista inizia a manifestarsi.
In questa fase:
il movimento long è in fase finale
aumenta il rischio di inversione o correzione
la probabilità di continuazione rialzista diminuisce sensibilmente
Uso tipico:
chiusura delle posizioni long residue
nessuna nuova operatività long
attesa di un nuovo contesto direzionale
Sintesi operativa
Verde crescente pressione rialzista in aumento
Verde decrescente rallentamento rialzista
Rosso decrescente pressione ribassista strutturata
Rosso crescente impulso ribassista possibile climax
Arancione transizione neutralità
Avvertenza
Directional Force Histogram è uno strumento di analisi e supporto decisionale.
Non fornisce segnali automatici e non garantisce risultati.
È pensato per essere utilizzato in combinazione con gestione del rischio, struttura dei prezzi e piano operativo personale.