Weekday Stats
- Indicators
- Version: 2.0
- Updated: 9 August 2026
- Activations: 20

Overview
Weekday Stats is a quantitative analysis indicator designed to perform statistical studies of price behavior by classifying candle data according to the day of the week on which each candle occurred.
The indicator processes the historical candles of the selected asset and provides statistical information for each day of the week, allowing the user to analyze price direction and price variation separately for each weekday.
The sampling period, statistical parameters, and data filters can be configured through the indicator's input parameters. This makes Weekday Stats a quantitative tool for identifying potential recurring patterns and market behaviors.
Statistical Data
For each day of the week, the indicator calculates and displays three main statistical properties:
- Candle Directional Variation
Represents the balance between the number of positive (bullish) candles and negative (bearish) candles. - Percentage of Positive Candles
Represents the proportion of positive candles relative to the total number of candles included in the sample. - Total Points
Represents the net price variation in points, calculated as the sum of the variations of positive candles minus the sum of the variations of negative candles.
Sampling Period Configuration
The period used to calculate the statistics can be defined through the indicator's input parameters.
The available options are:
- Full History (Never)
Uses all available historical data for the selected asset to perform the statistical calculations. - Yearly (Every Year)
Uses only candles belonging to the currently selected calendar year. - Monthly (Every Month)
Uses only candles belonging to the currently selected calendar month.
Minimum Variation Filter
The indicator allows you to define a minimum variation in points to determine which candles will be included in the statistical calculations.
Candles whose variation is below the configured minimum value can be excluded from the sample. This feature reduces the influence of low-activity candles and allows the analysis to focus on more significant price movements.
Statistical Timeframe
The statistics are calculated based on the timeframe of the chart on which the indicator is running.
For example:
- M1 chart: statistics calculated using M1 candles.
- M5 chart: statistics calculated using M5 candles.
- M15 chart: statistics calculated using M15 candles.
- H1 chart: statistics calculated using H1 candles.
- D1 chart: statistics calculated using D1 candles.
The indicator supports timeframes up to D1. Higher timeframes, such as W1 (weekly) and MN (monthly), are not compatible with the methodology used by the indicator.
This limitation exists because the analysis depends on identifying the specific day of the week corresponding to each candle. On weekly or monthly timeframes, this classification no longer represents daily price behavior accurately.
Data Visualization
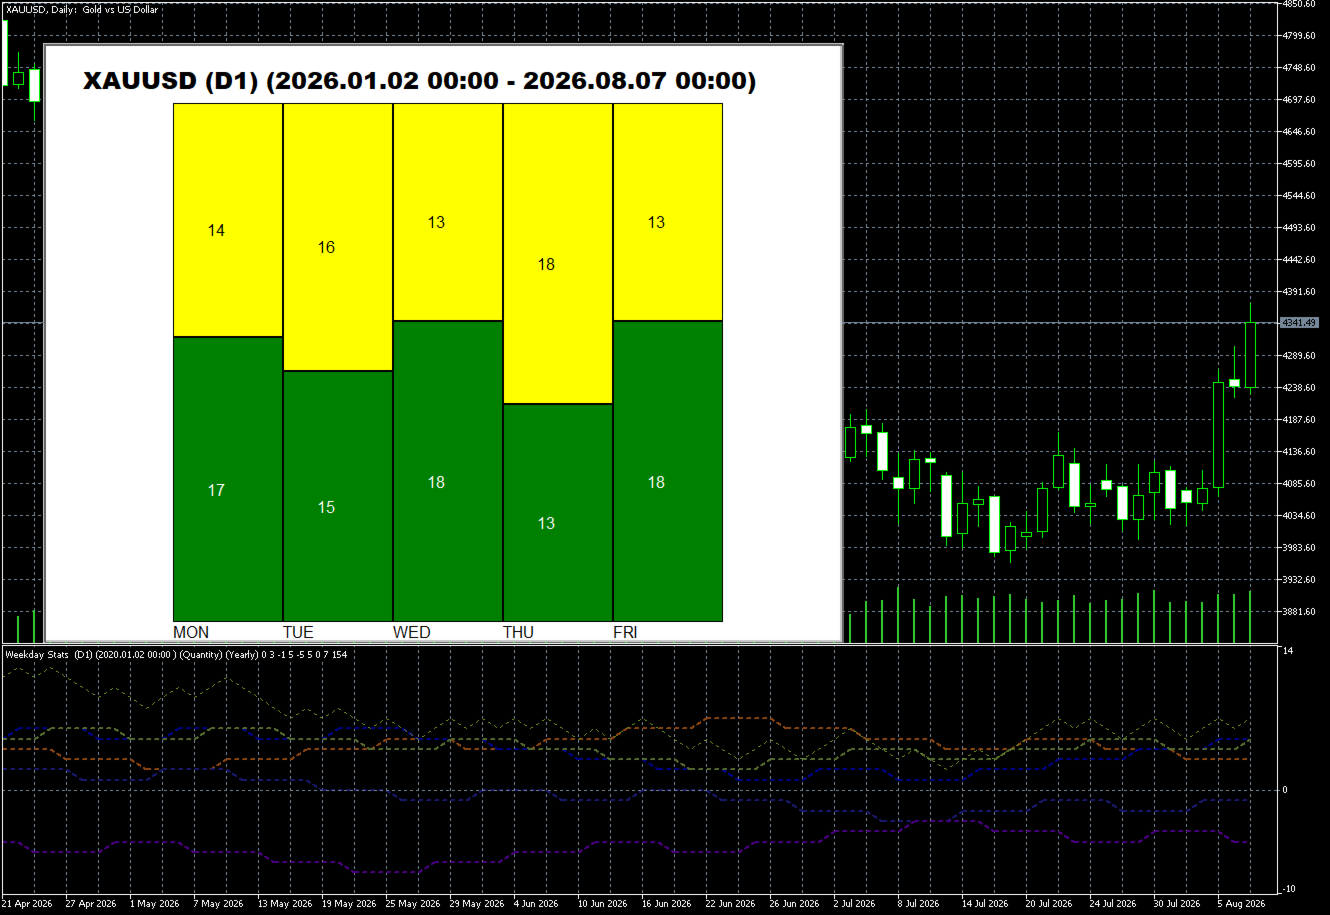
Weekday Stats presents the results in two main ways:
- Subwindow: displays detailed statistical information about the analyzed sample.
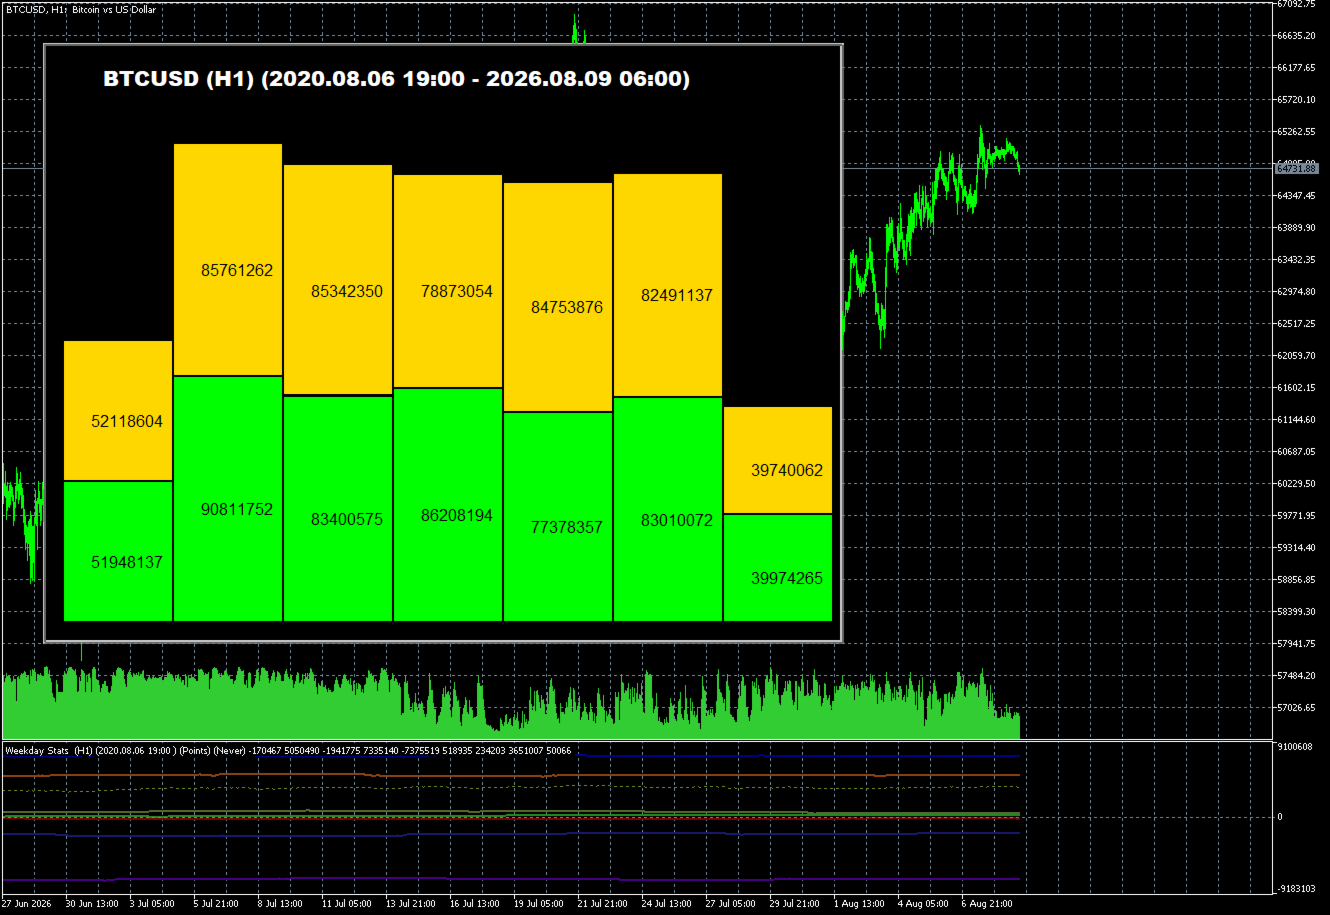
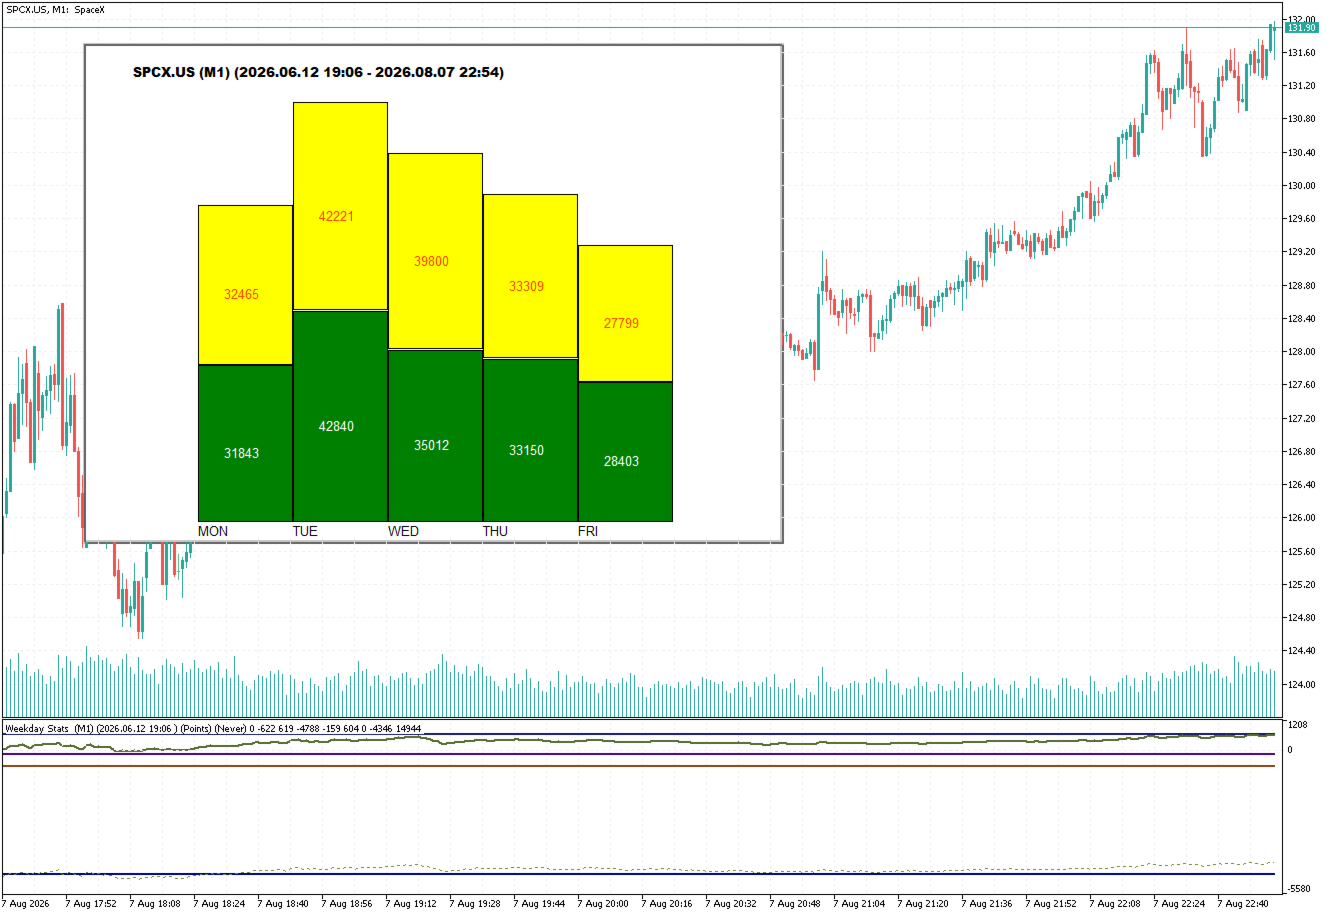
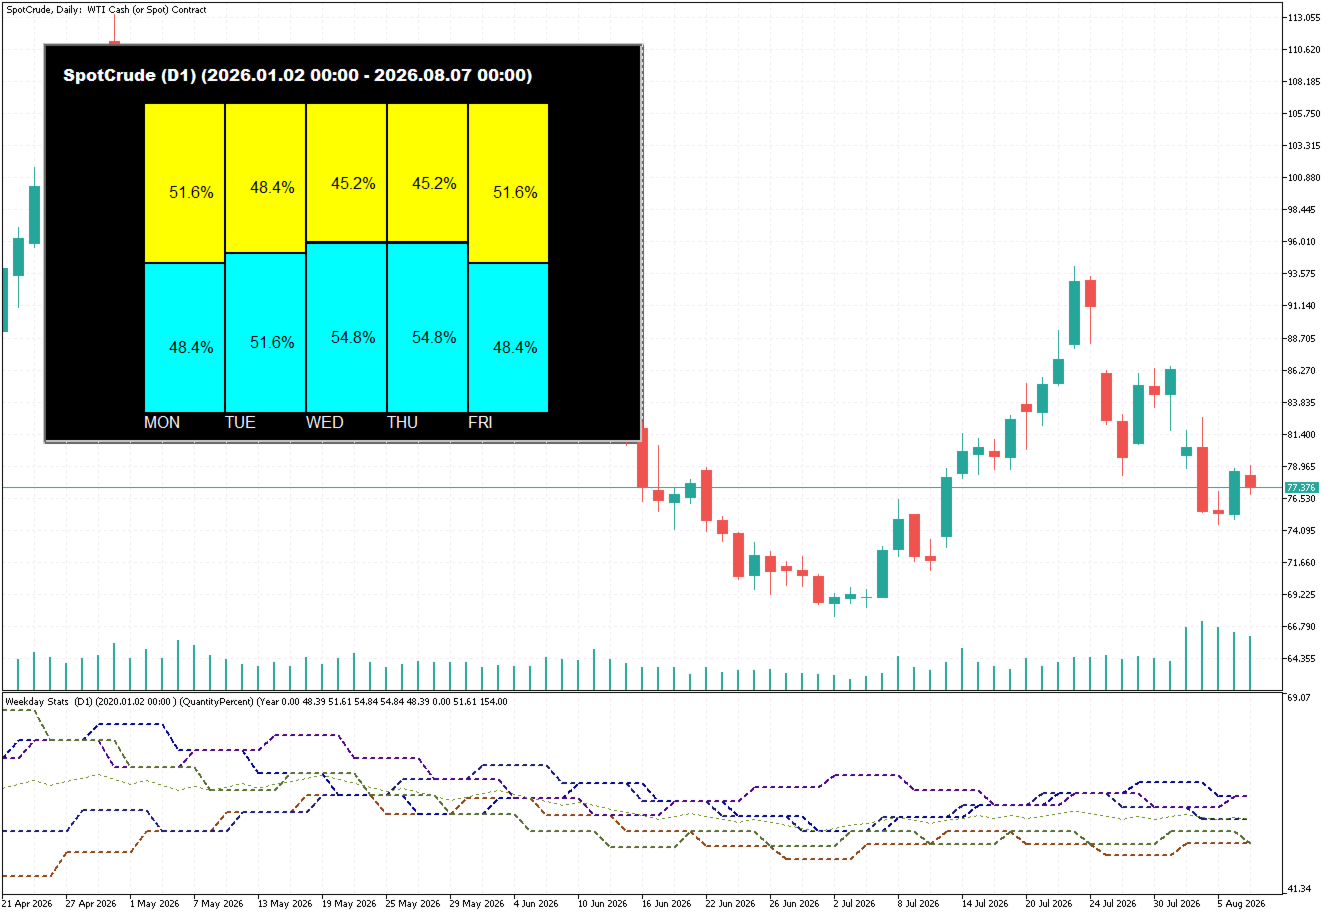
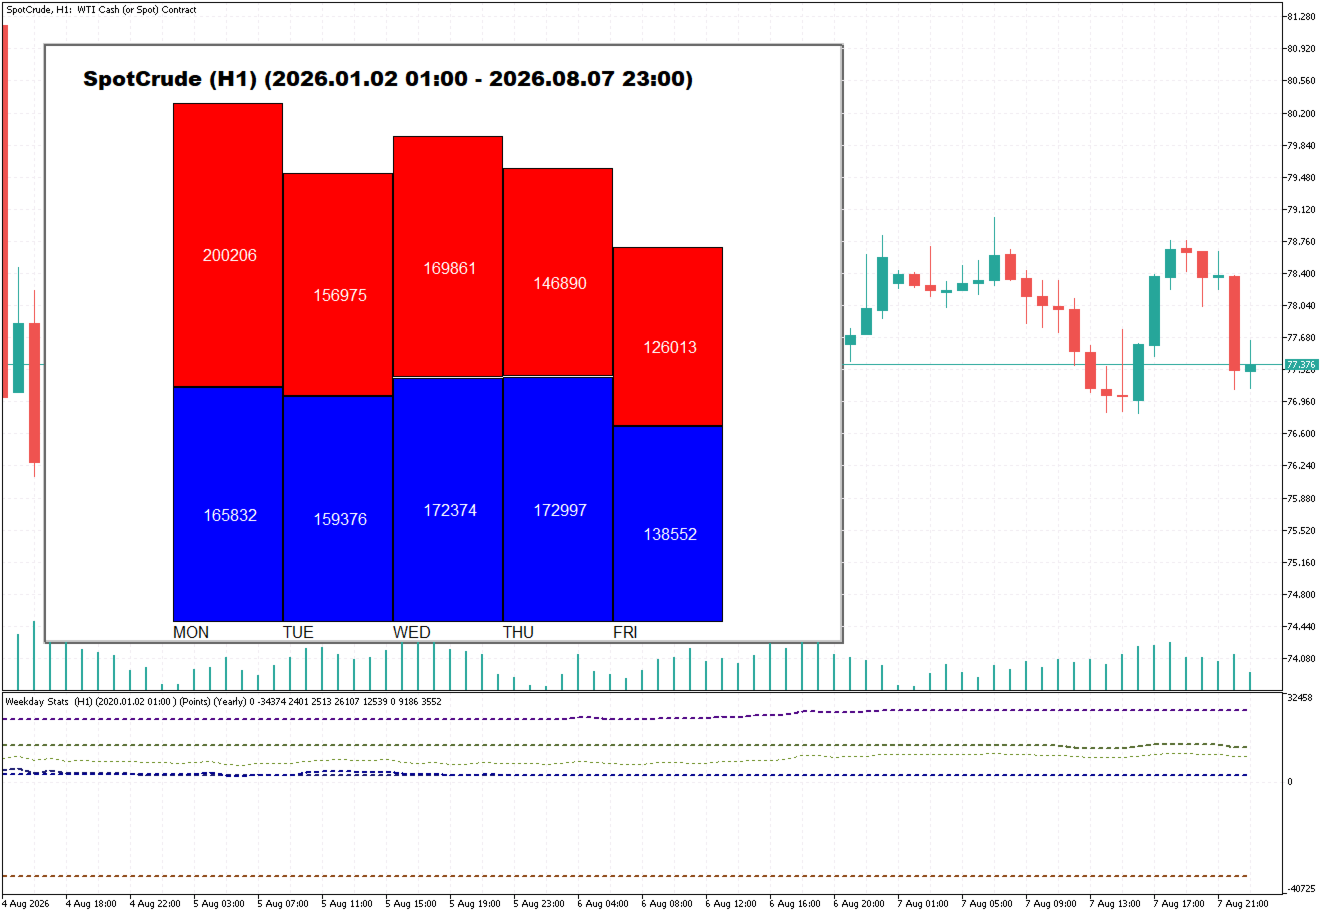
- Main Chart: displays a histogram related to the calculated statistical results.
Subwindow — Data Window
The data window displays information related to the selected statistical parameters and the results calculated from the historical candles included in the sample.
Sampling Start Date
The indicator displays the actual starting date used for the sample at the top of the subwindow.
In some situations, this date may differ from the date expected based on the sampling period configured in the input parameters. Therefore, it is recommended to check the starting date displayed by the indicator whenever you need to verify the analyzed period.
If the displayed starting date is later than expected, check whether the asset has sufficient historical data for the requested period and whether the MetaTrader platform is configured to provide the required amount of historical candles.
Important — Historical Data
The period actually used by the indicator may be shorter than the period requested through the input parameters. This is primarily caused by limitations related to the availability of historical price data.
The main causes are:
- Platform History Limitations
The MetaTrader platform may be configured to store or provide only a limited number of historical candles. Check the platform settings related to the maximum number of bars available in the history. - Insufficient Asset History
The symbol displayed on the chart may simply not have enough historical data available for the requested period.
To obtain the longest possible historical sample, it is recommended to use a platform configuration that allows the complete amount of available historical data to be loaded.
Timeframe Limitation
Important: Weekday Stats should not be used on timeframes higher than D1, such as W1 or MN.
The indicator's methodology depends on identifying the day of the week associated with each candle. On weekly or monthly timeframes, this classification no longer accurately represents daily price behavior and, consequently, the resulting statistics may not be applicable.
Data Export
Weekday Stats allows you to save the calculated statistical data to a file.
The exported data is automatically saved in the Files folder of the MetaTrader platform.
Save Screenshot
You can also save a screenshot of the chart containing the information displayed by the indicator.
The captured image is automatically saved in the Files folder of the MetaTrader platform.
Summary
Weekday Stats is a statistical analysis tool that allows you to study historical price behavior according to the day of the week. By combining the sampling period, minimum variation filter, and chart timeframe, users can analyze different datasets and identify potential recurring statistical patterns in the market.
The results should be interpreted as statistical information based on the analyzed historical data and should not, by themselves, be considered a guarantee of future price behavior.