SuperTrend Simple
- Indicators
- Version: 1.1
- Updated: 7 July 2025

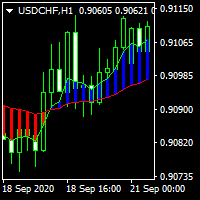
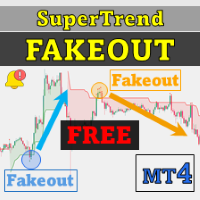
The SuperTrend indicator is a trend-following technical tool that visually highlights trend reversals in the market. The color and position of its lines change automatically based on price movements, supporting both entry and exit decisions. With a simple design, it can be used in a wide range of trading styles, including discretionary and automated trading.
Main Features
- Clear display of trend reversals
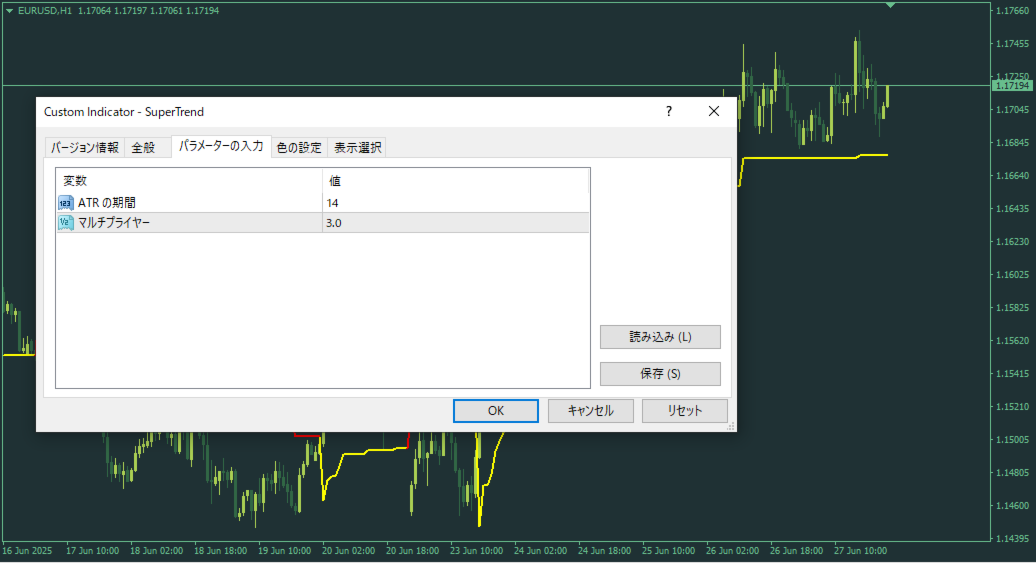
During uptrends, the line is drawn below the candlesticks; during downtrends, it is drawn above. This makes it intuitive to identify trend direction and reversal points. - Easy identification of transitions from range to trend
Helps capture the beginning of new trends and range breakouts. - Flexible parameter adjustment
By adjusting the ATR period and Multiplier, the indicator can be optimized for different currency pairs, CFDs, and timeframes. - Versatile use
Suitable for both manual and automated trading, providing clear signals to support trade decisions.
Calculation Logic
- Calculates the Average True Range (ATR) for a specified period.
- Draws a lower line in uptrends and an upper line in downtrends.
- Uptrend line: (Highest High + Lowest Low) / 2 minus ATR × Multiplier.
- Downtrend line: (Highest High + Lowest Low) / 2 plus ATR × Multiplier.
- When the closing price crosses these lines, the trend direction switches, and the line color is inverted.
Main Use Cases
- Supporting entries during trend emergence
- Identifying range breakouts
- Providing guidelines for stop loss and trailing stop placement
- Combining with other indicators or oscillators for additional filtering
Parameters
| Parameter | Description | Default |
|---|---|---|
| Nbr_Periods | ATR calculation period | 14 |
| Multiplier | Multiplier applied to ATR | 3.0 |
*Parameters can be adjusted freely. For highly volatile instruments, increasing the Multiplier creates a smoother line with less noise.
Recommended Settings & Notes
- This indicator can be used on any timeframe or currency pair, but it is recommended to adjust the parameters based on the instrument's characteristics and market volatility.
- Signal reversals can indicate trend changes, but using this indicator in combination with other technical tools or price action strategies may improve reliability.
Summary
The SuperTrend indicator is a simple yet effective tool for trend detection, suitable for both discretionary and automated trading. It helps clarify market trends visually and can serve as a foundation for various trading strategies.
This indicator is developed and introduced by TOKYO-EA. If you are interested in other tools or information, please search for "TOKYO-EA".