HumaI Power Zones
- Indicators
- Version: 2.0
- Updated: 2 November 2025
- Activations: 5

HumaI Power Zones™ – Precise OHLC Mapping for Serious Traders
Product Description
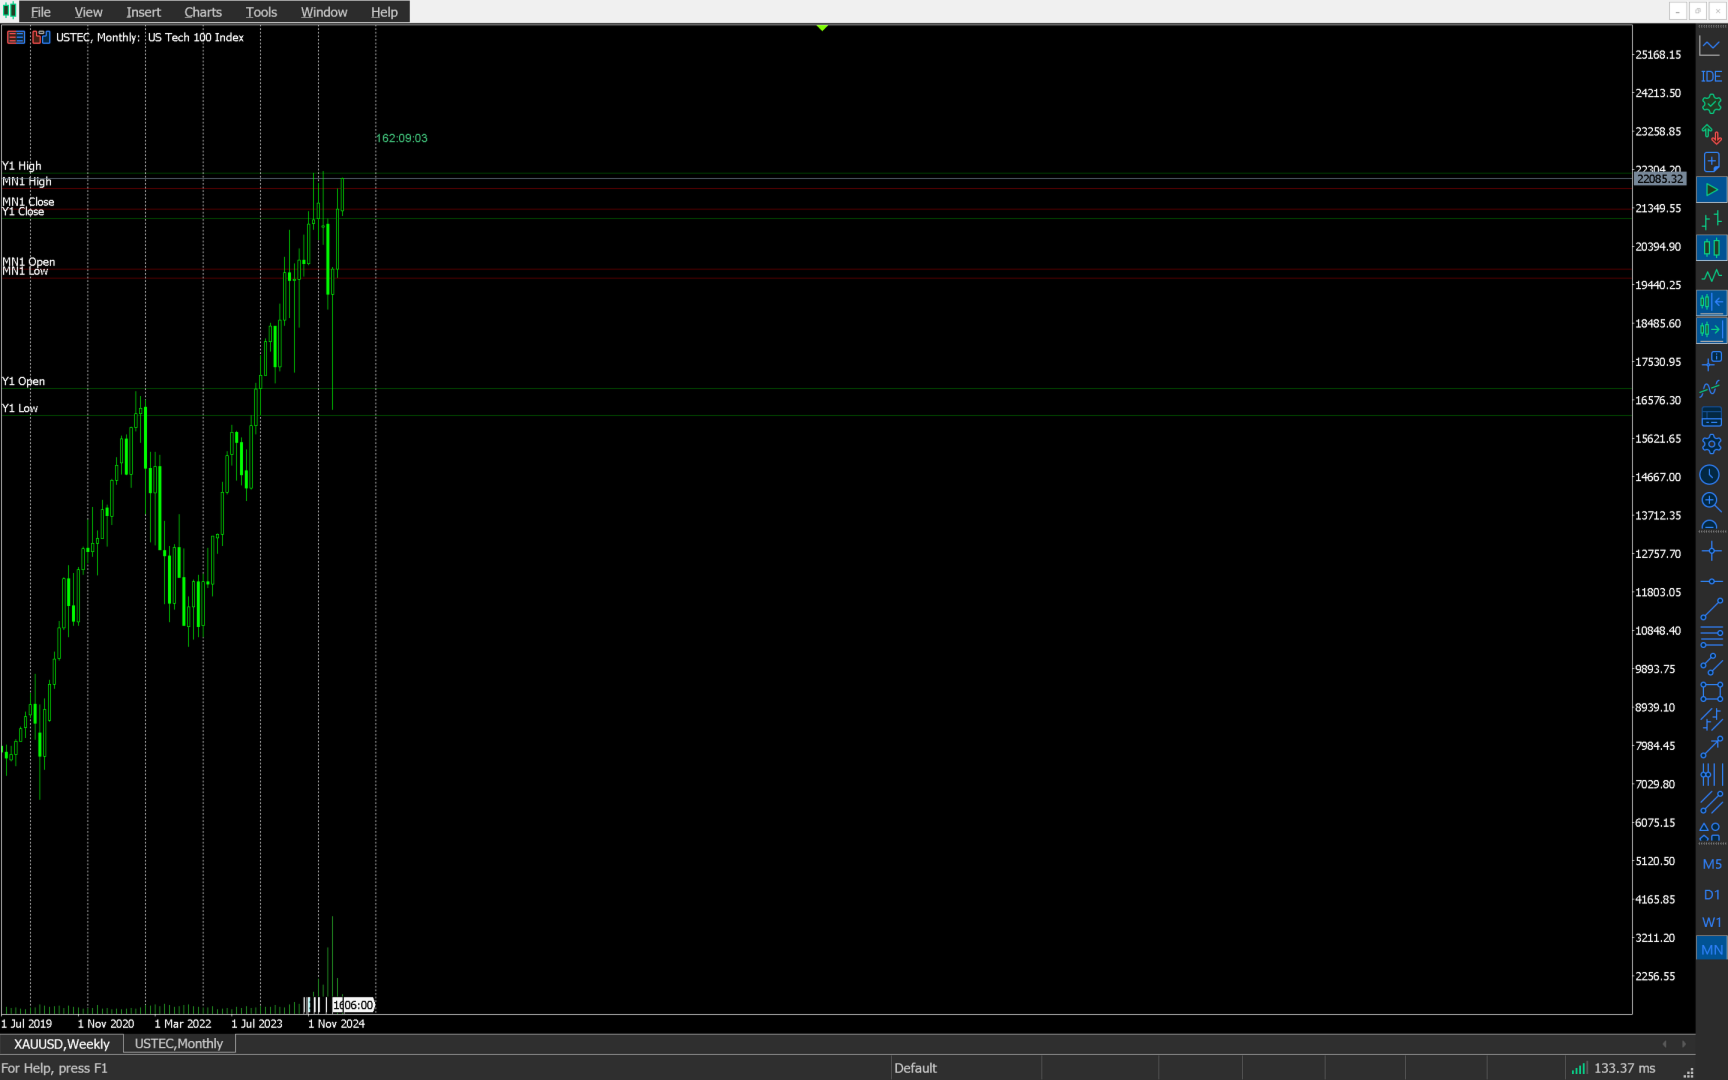
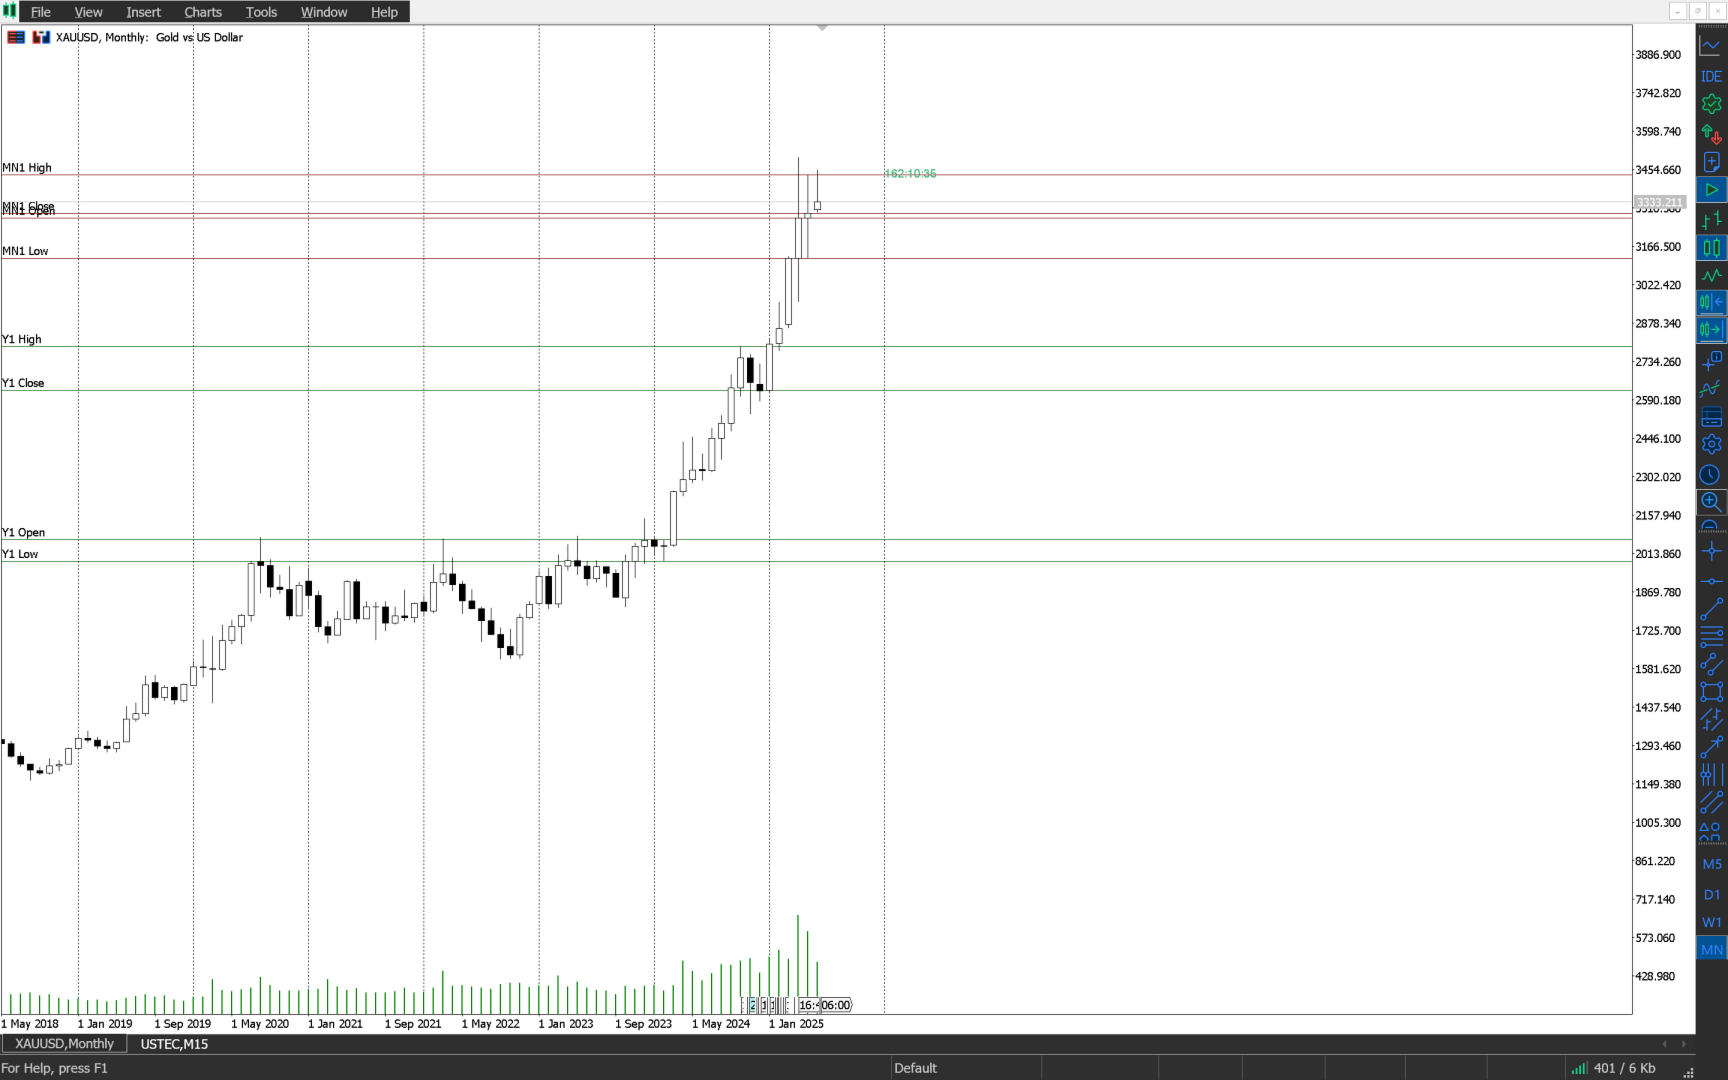
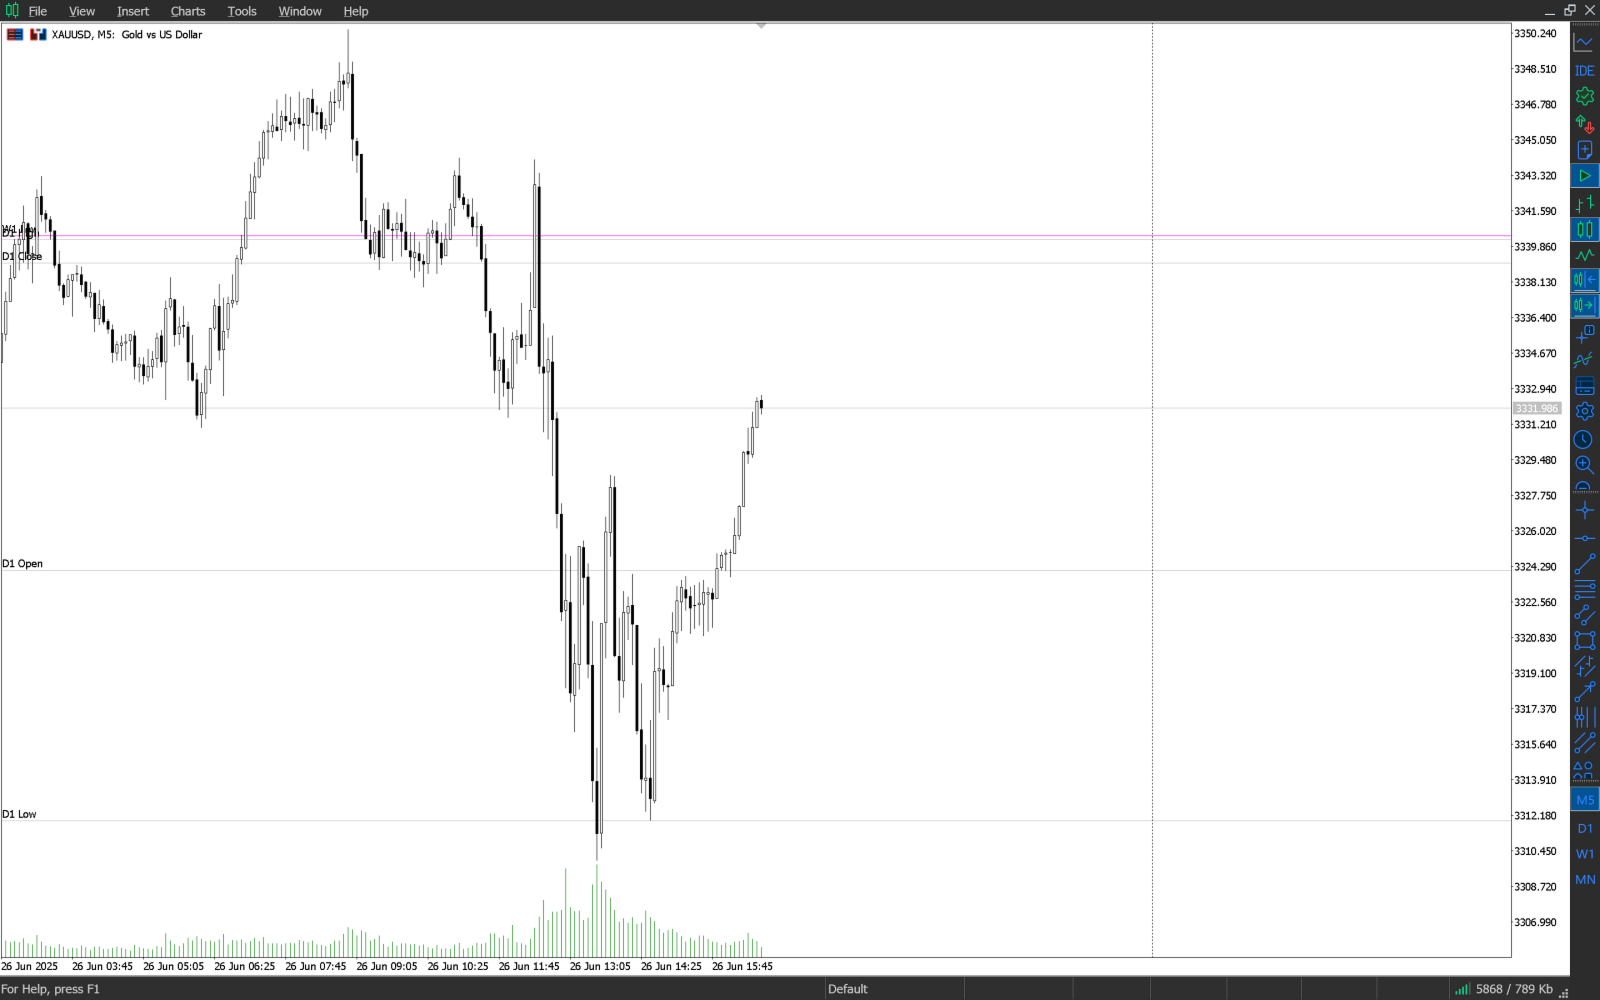
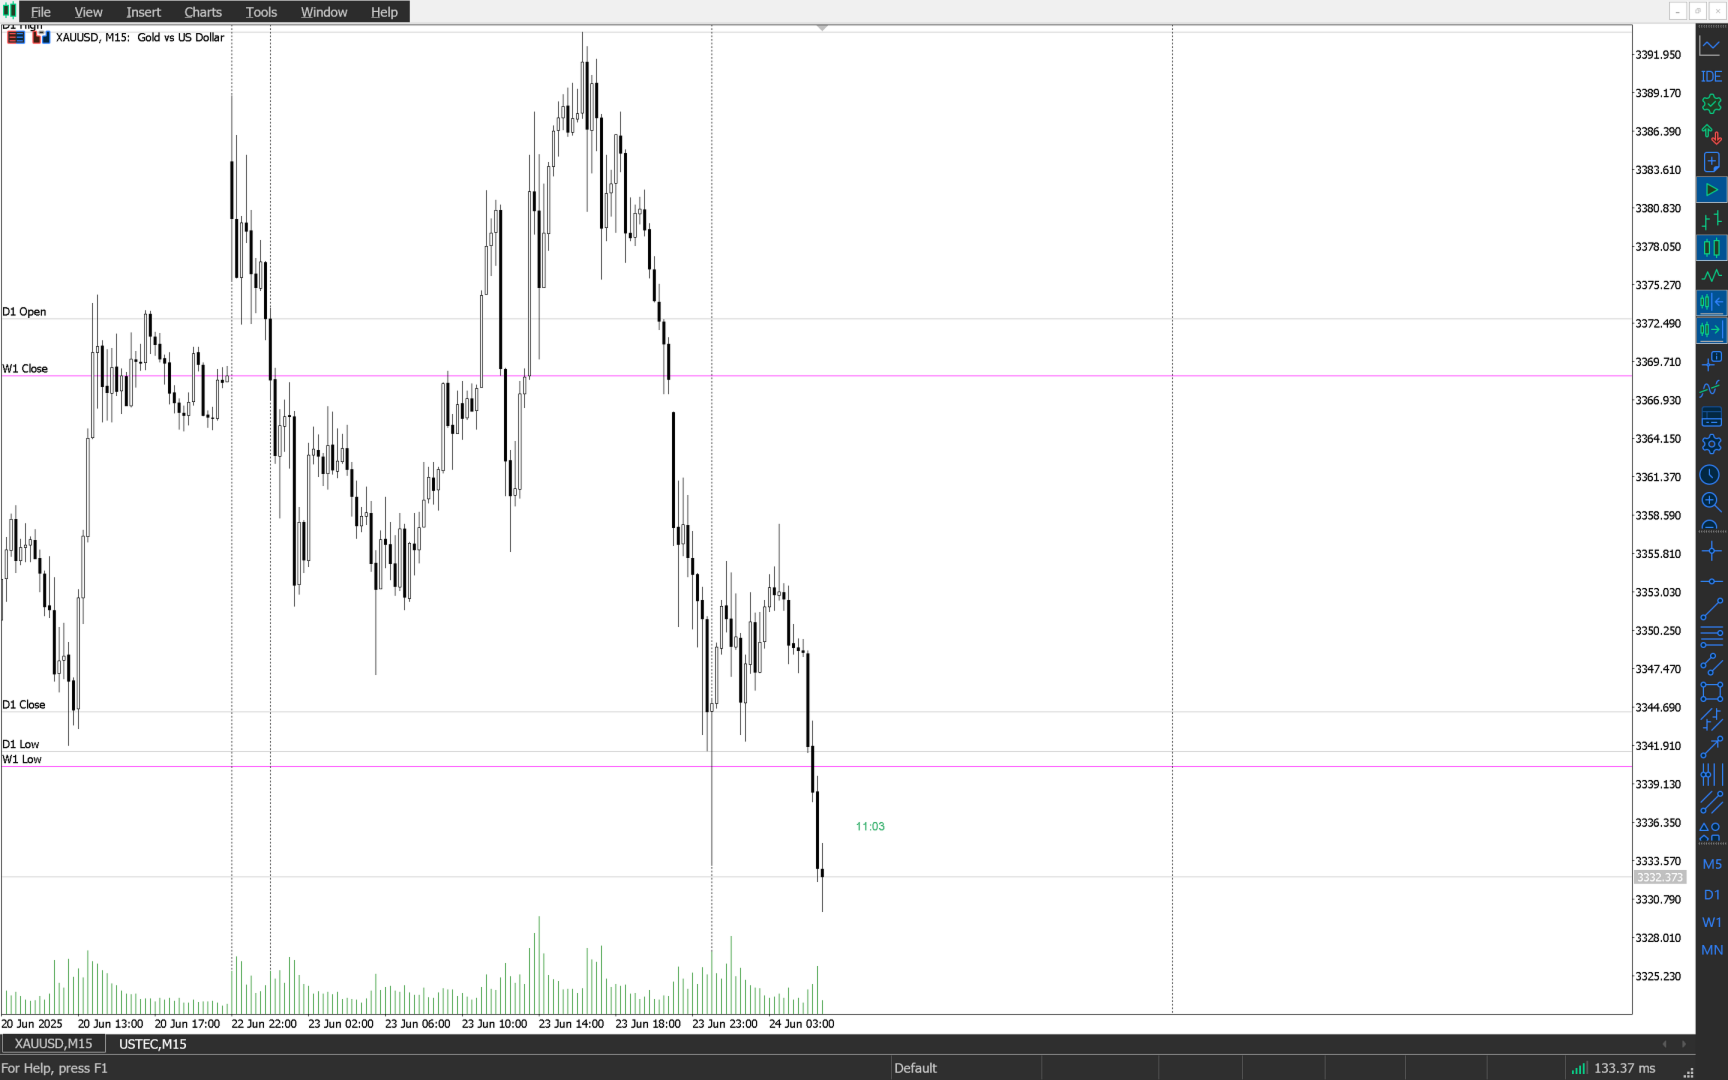
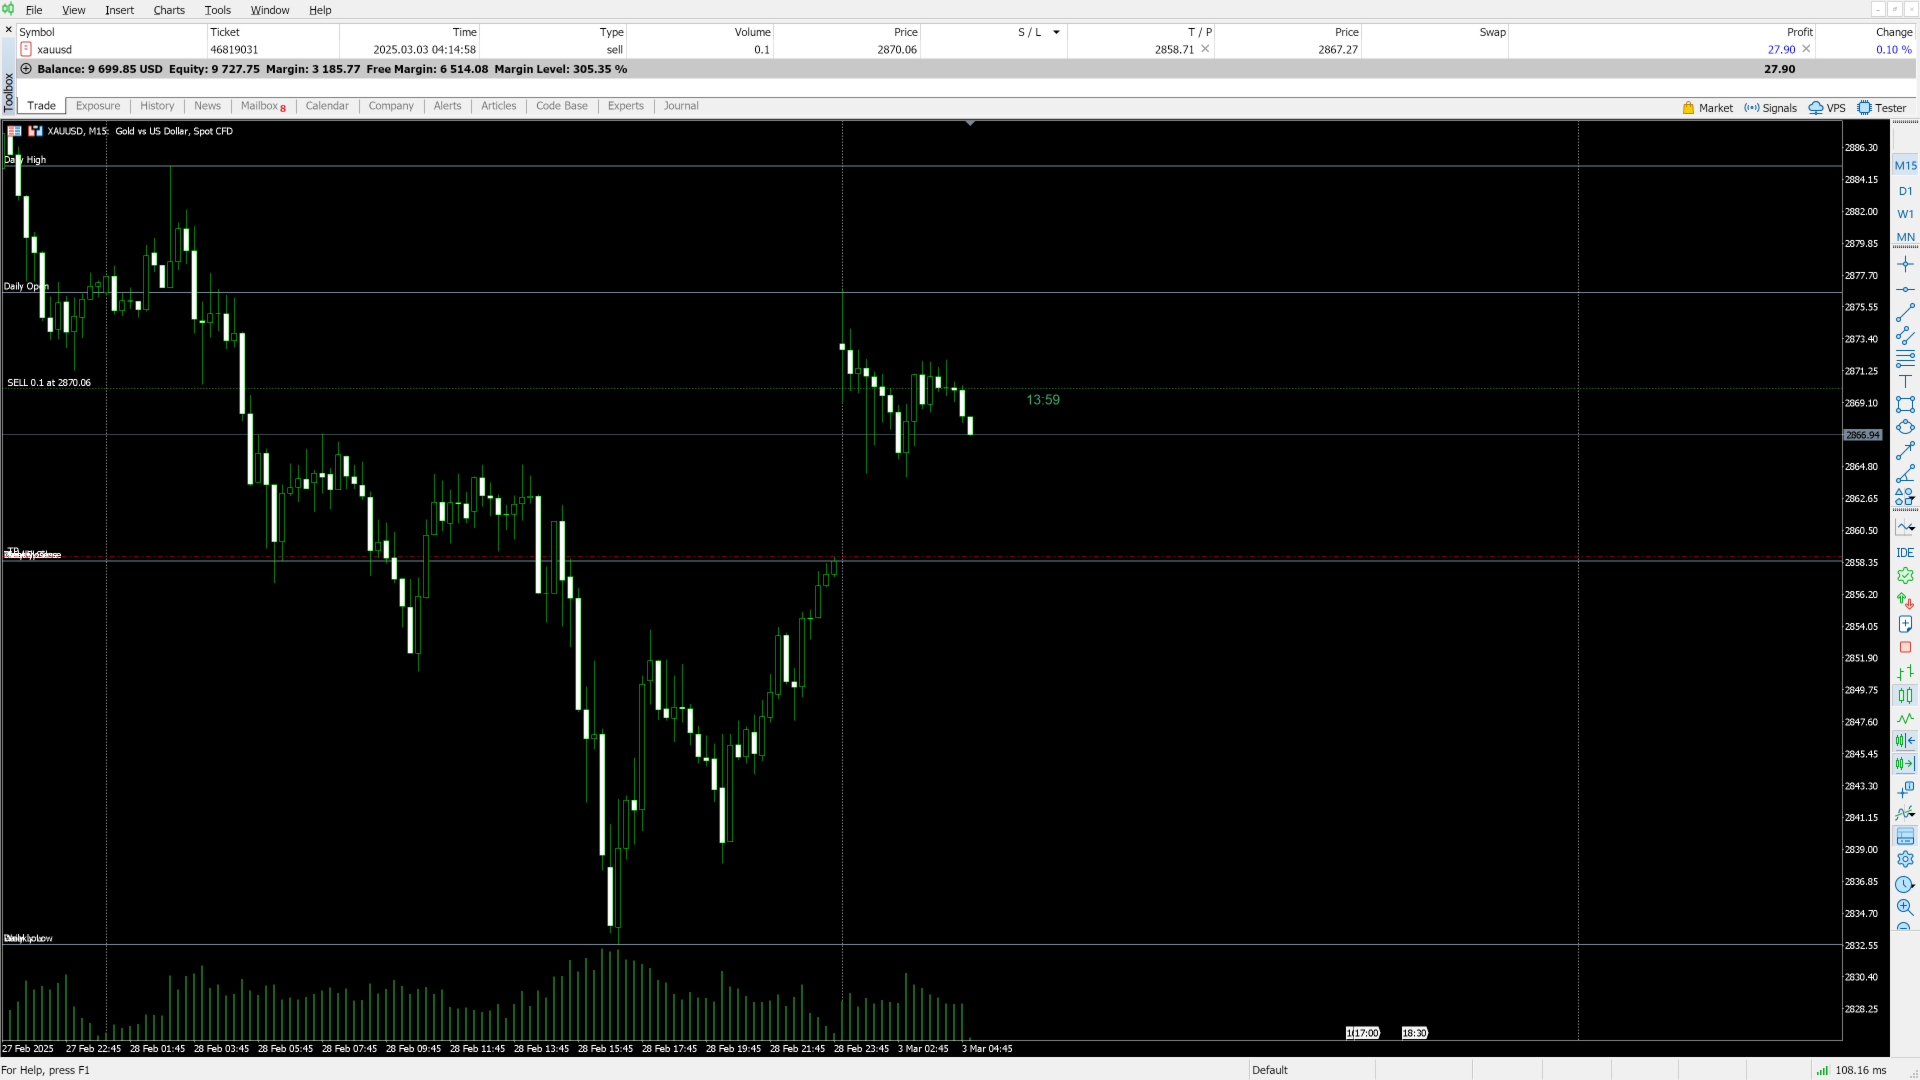
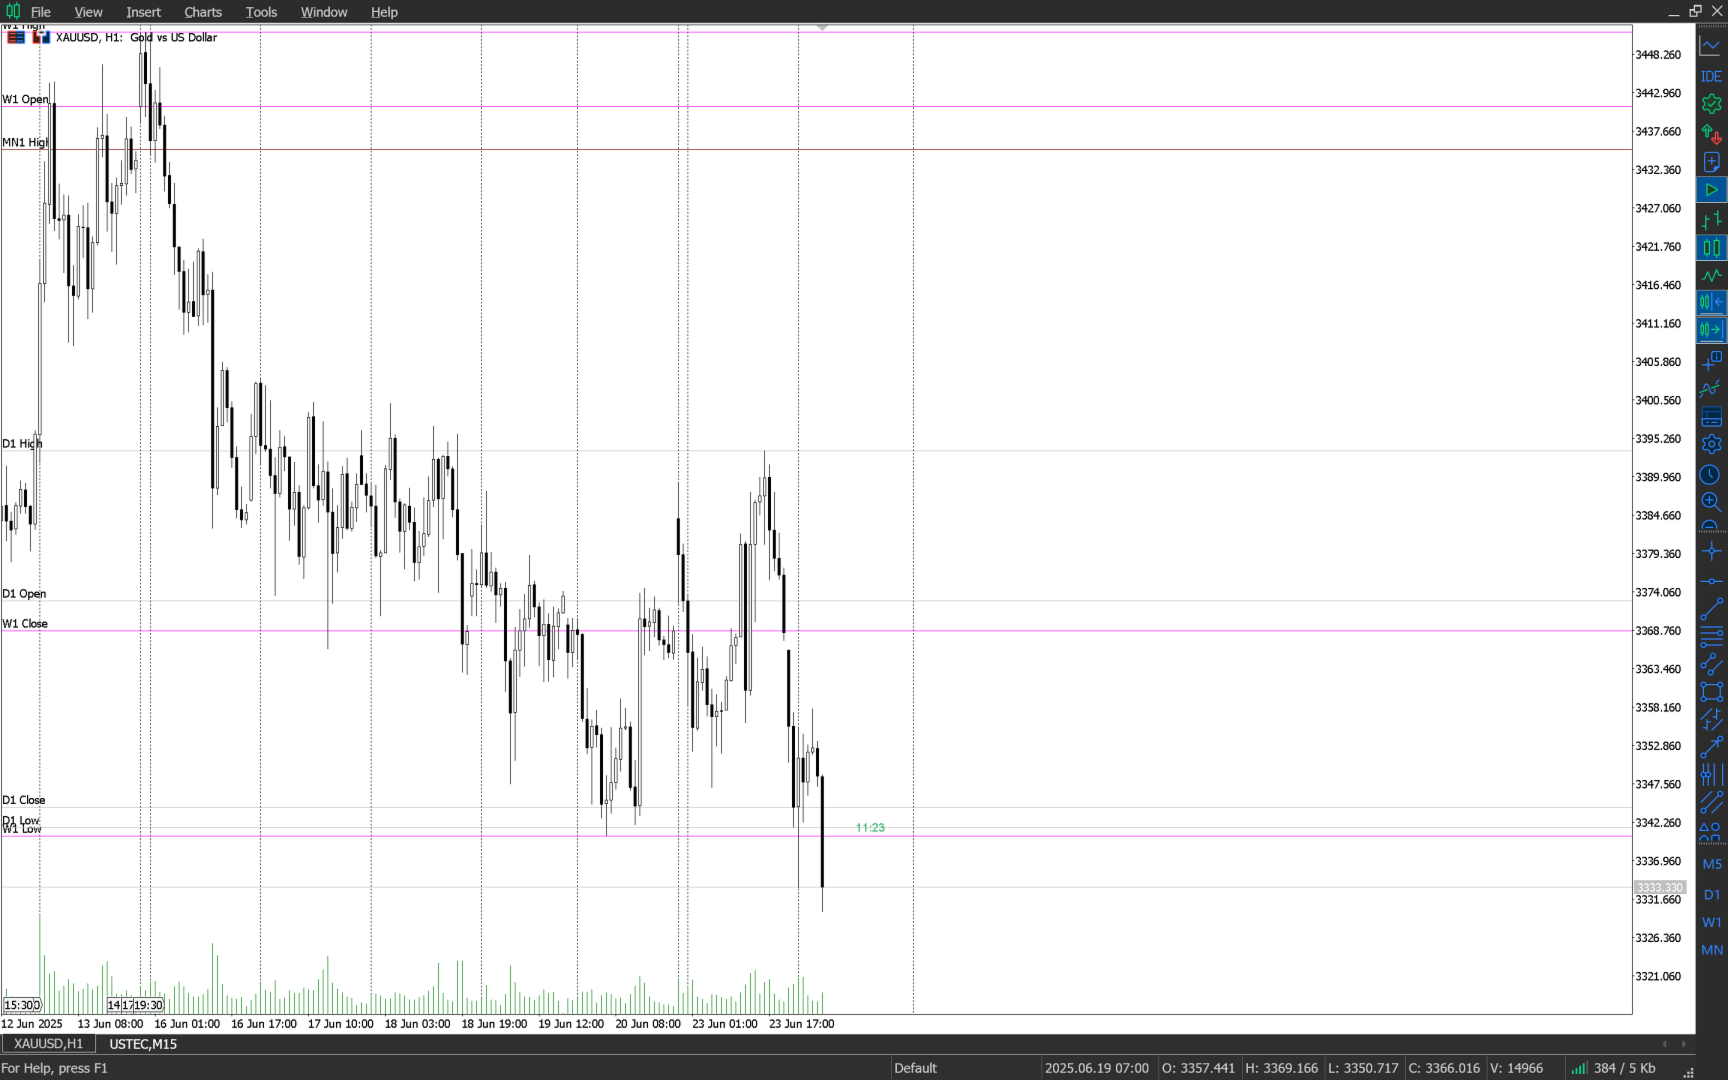
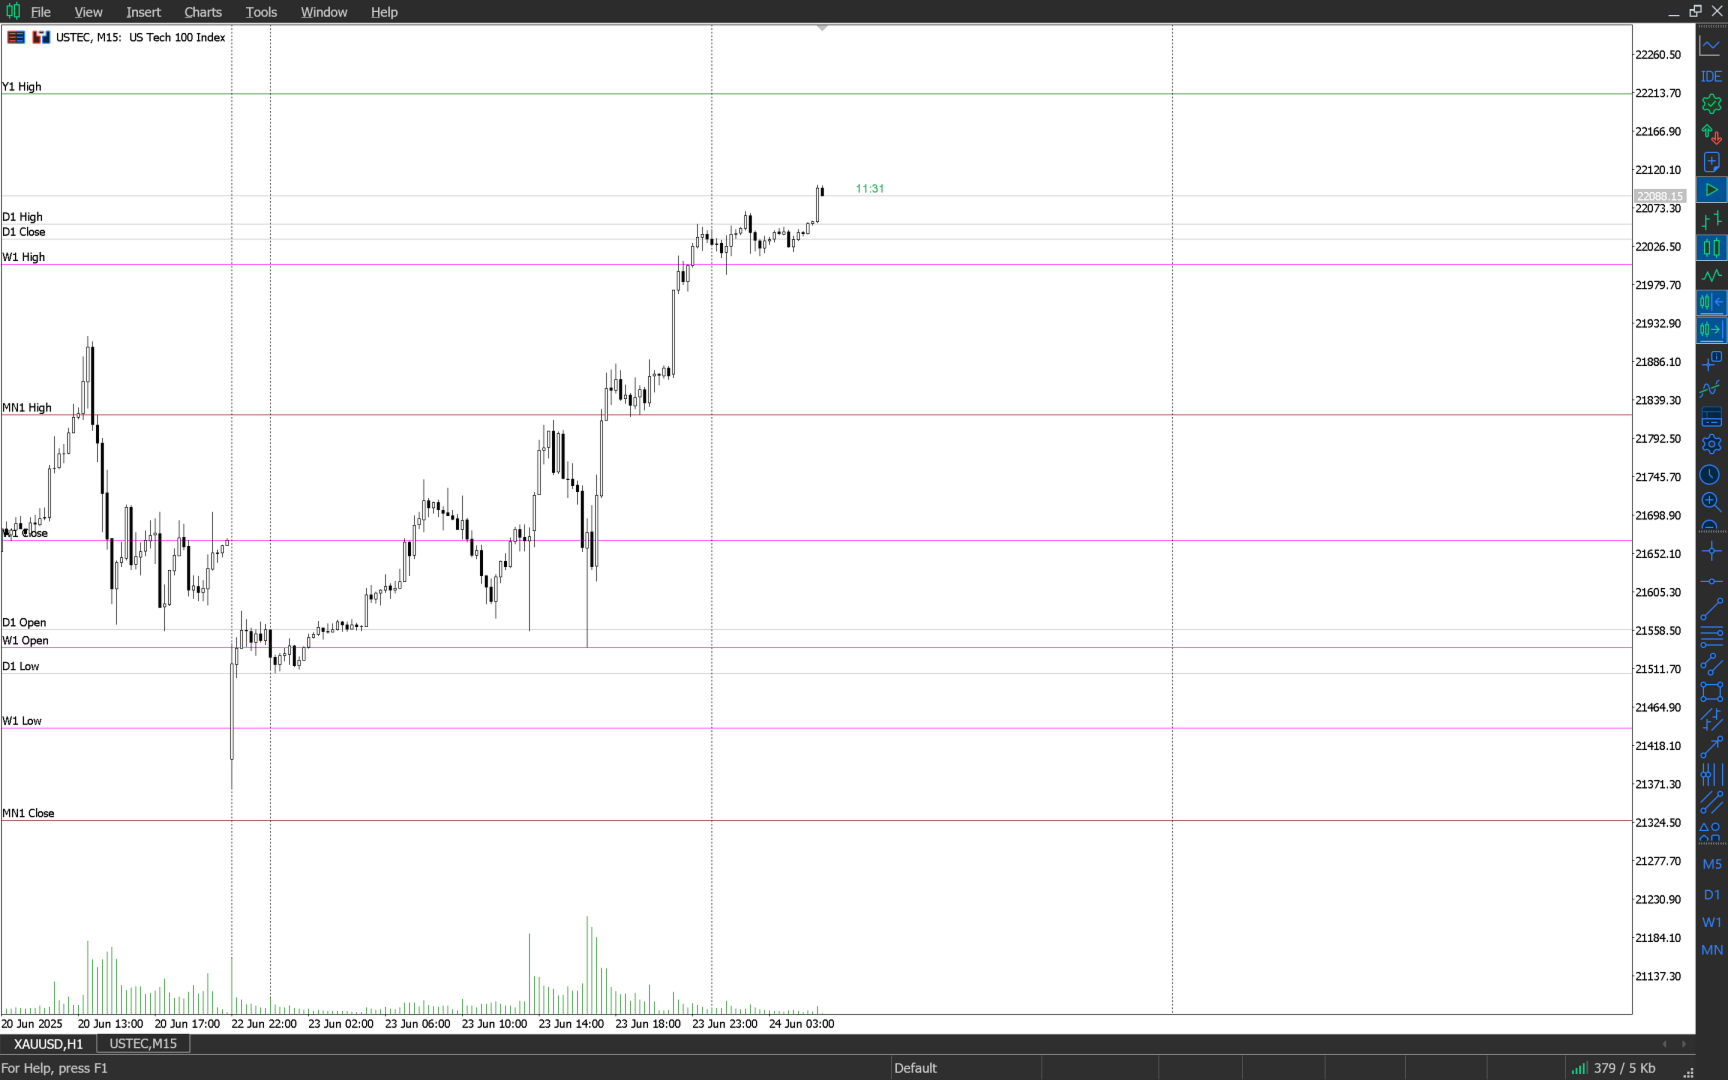
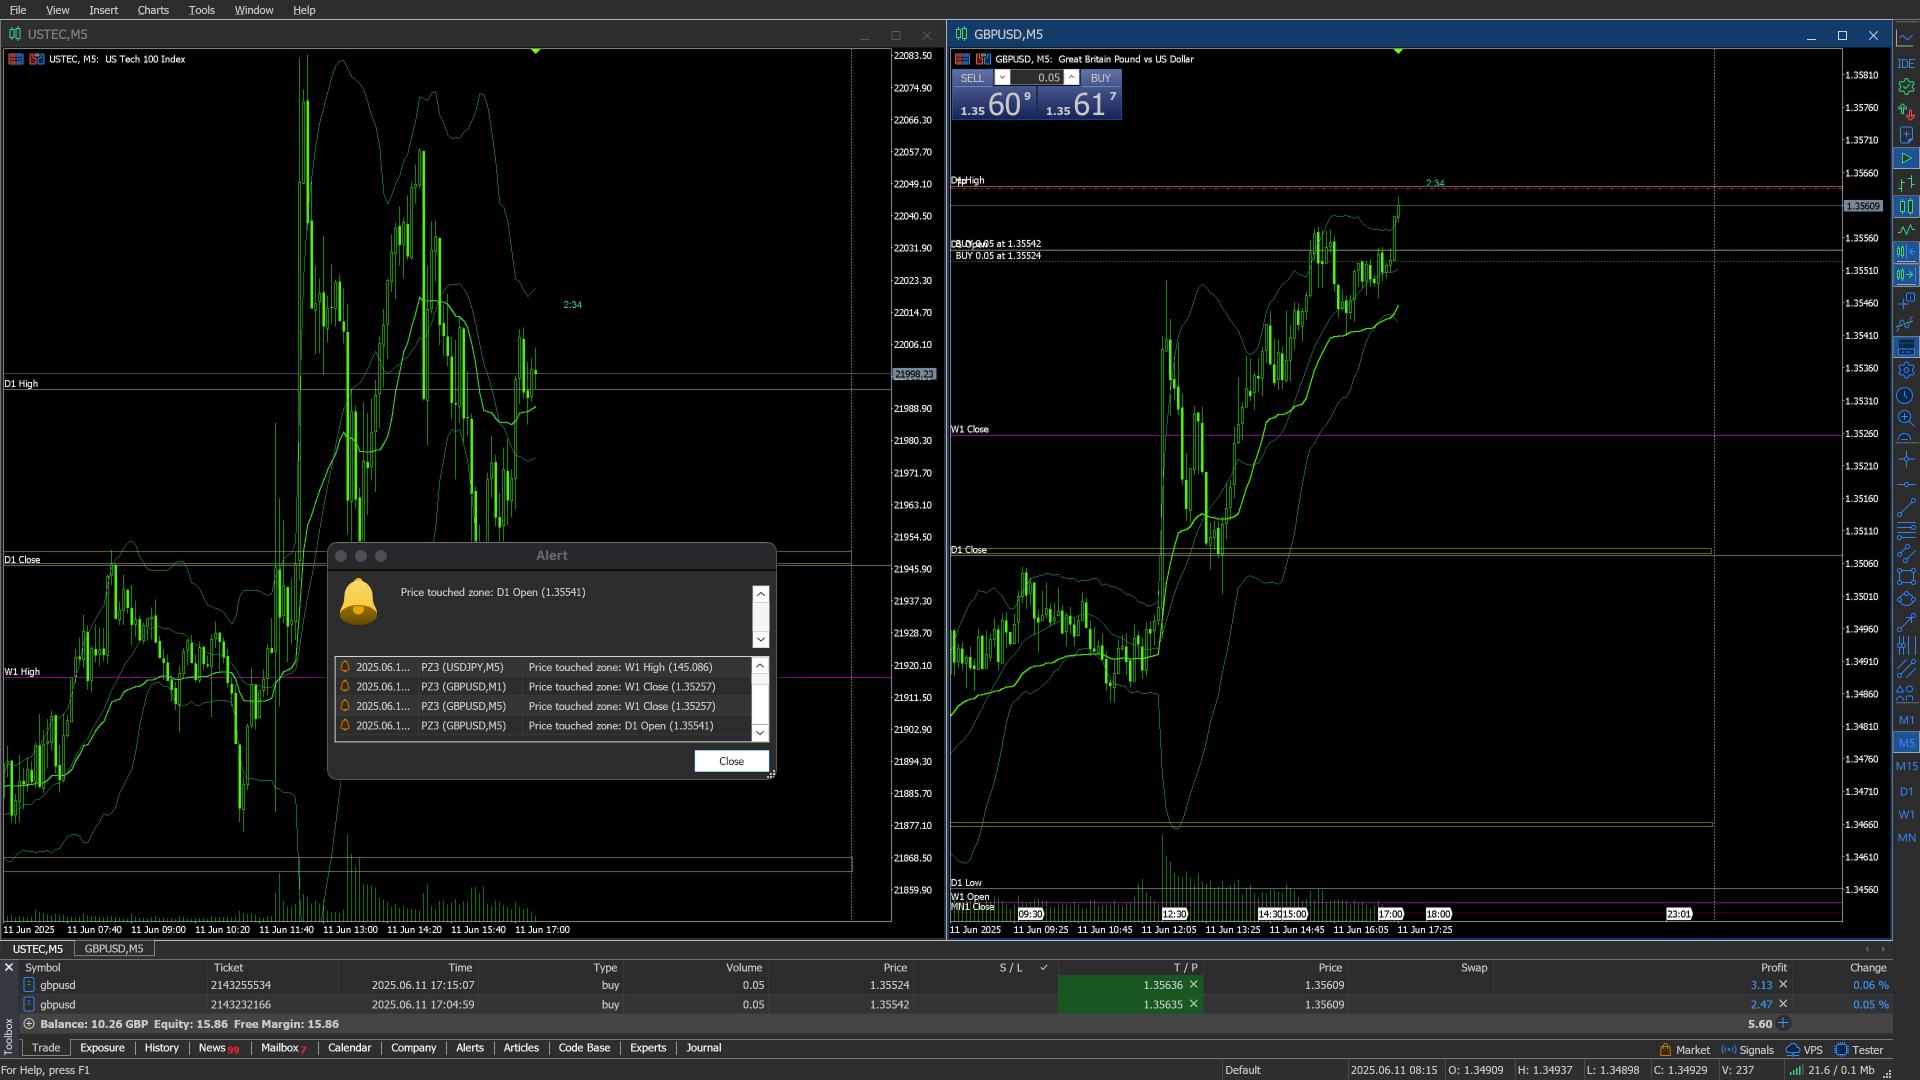
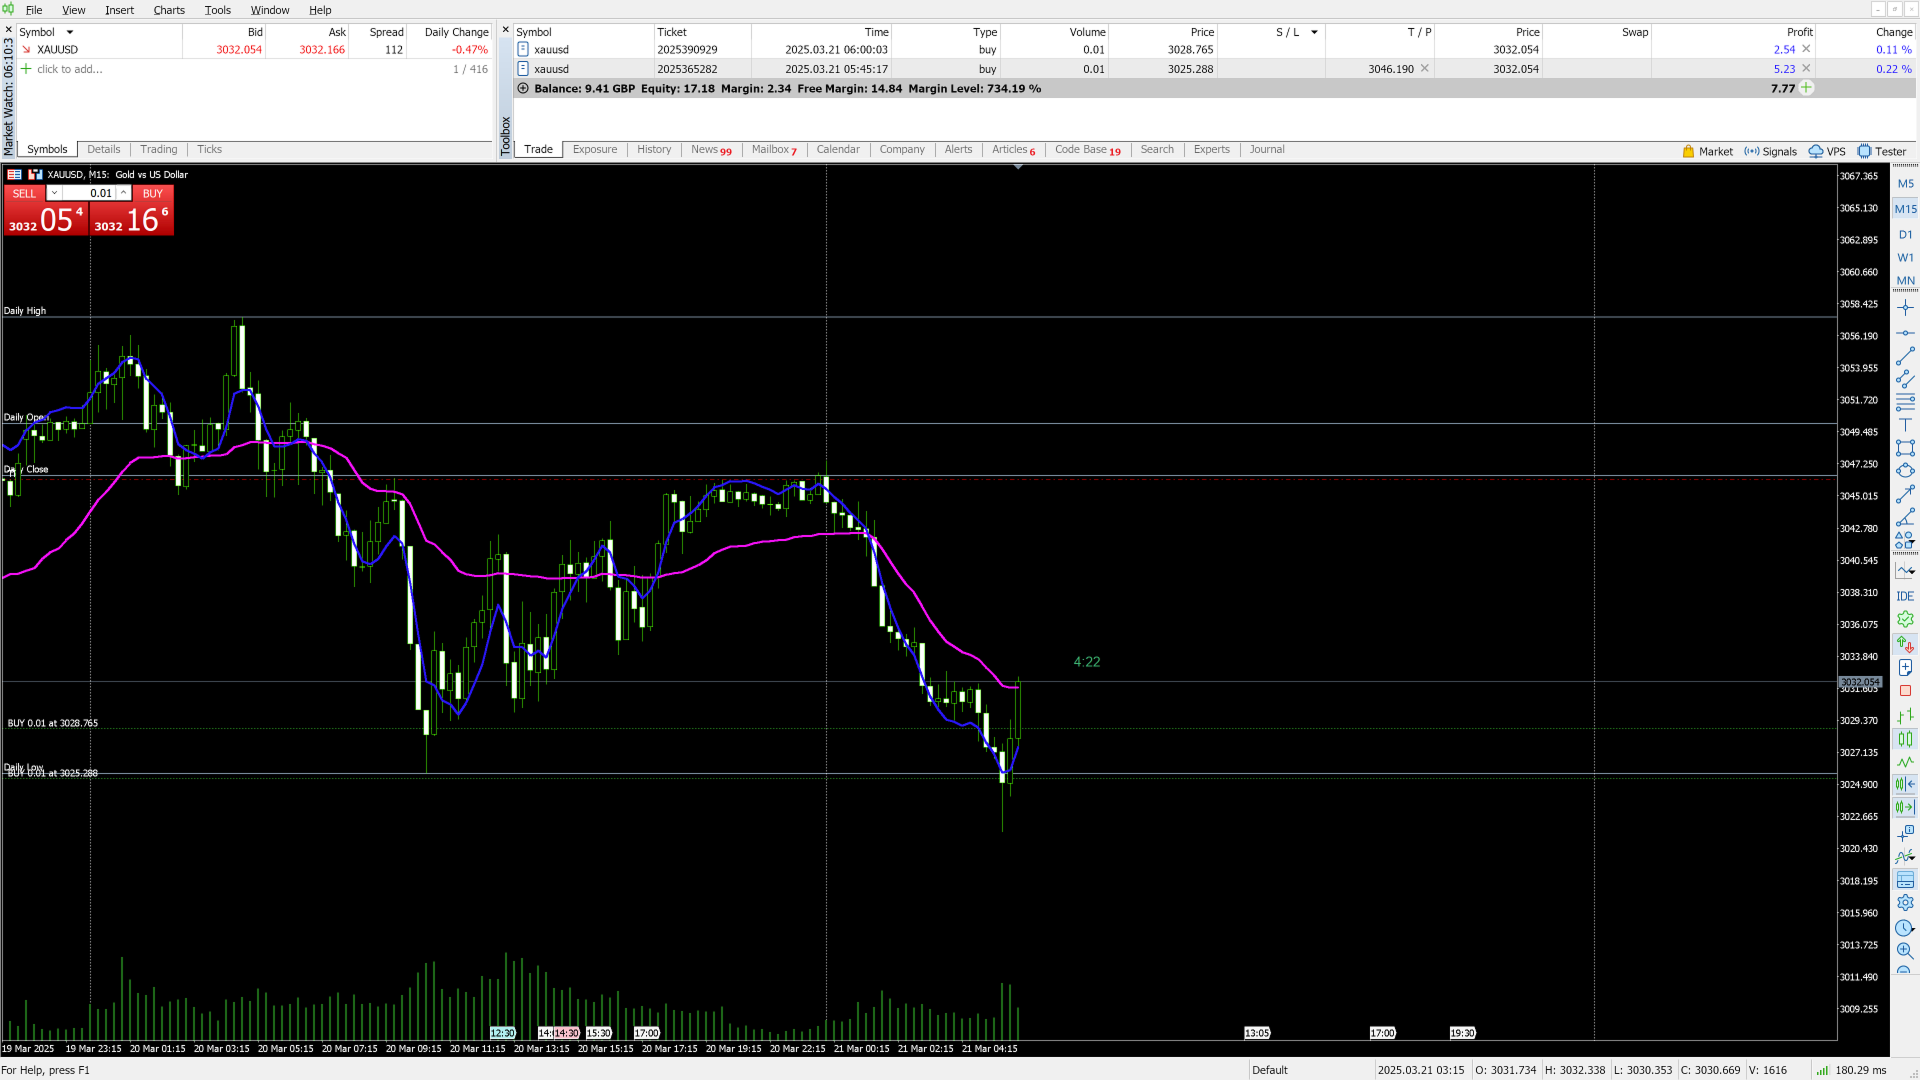
HumaI Power Zones™ is a precision-designed indicator that automatically plots key OHLC (Open, High, Low, Close) levels from the Daily (D1), Weekly (W1), Monthly (MN1), and Yearly (Y1) timeframes.
These levels are calculated and drawn in real time, offering a stable and clear view of price structure. Whether you're working with lower timeframes or tracking higher timeframe context, HumaI Power Zones™ provides a structured visual framework to support informed trading decisions.
Key Features
-
Institutional Precision-Based OHLC Levels
Automatically maps Open, High, Low, and Close from major timeframes — D1, W1, MN1, Y1. -
Smart Alert System
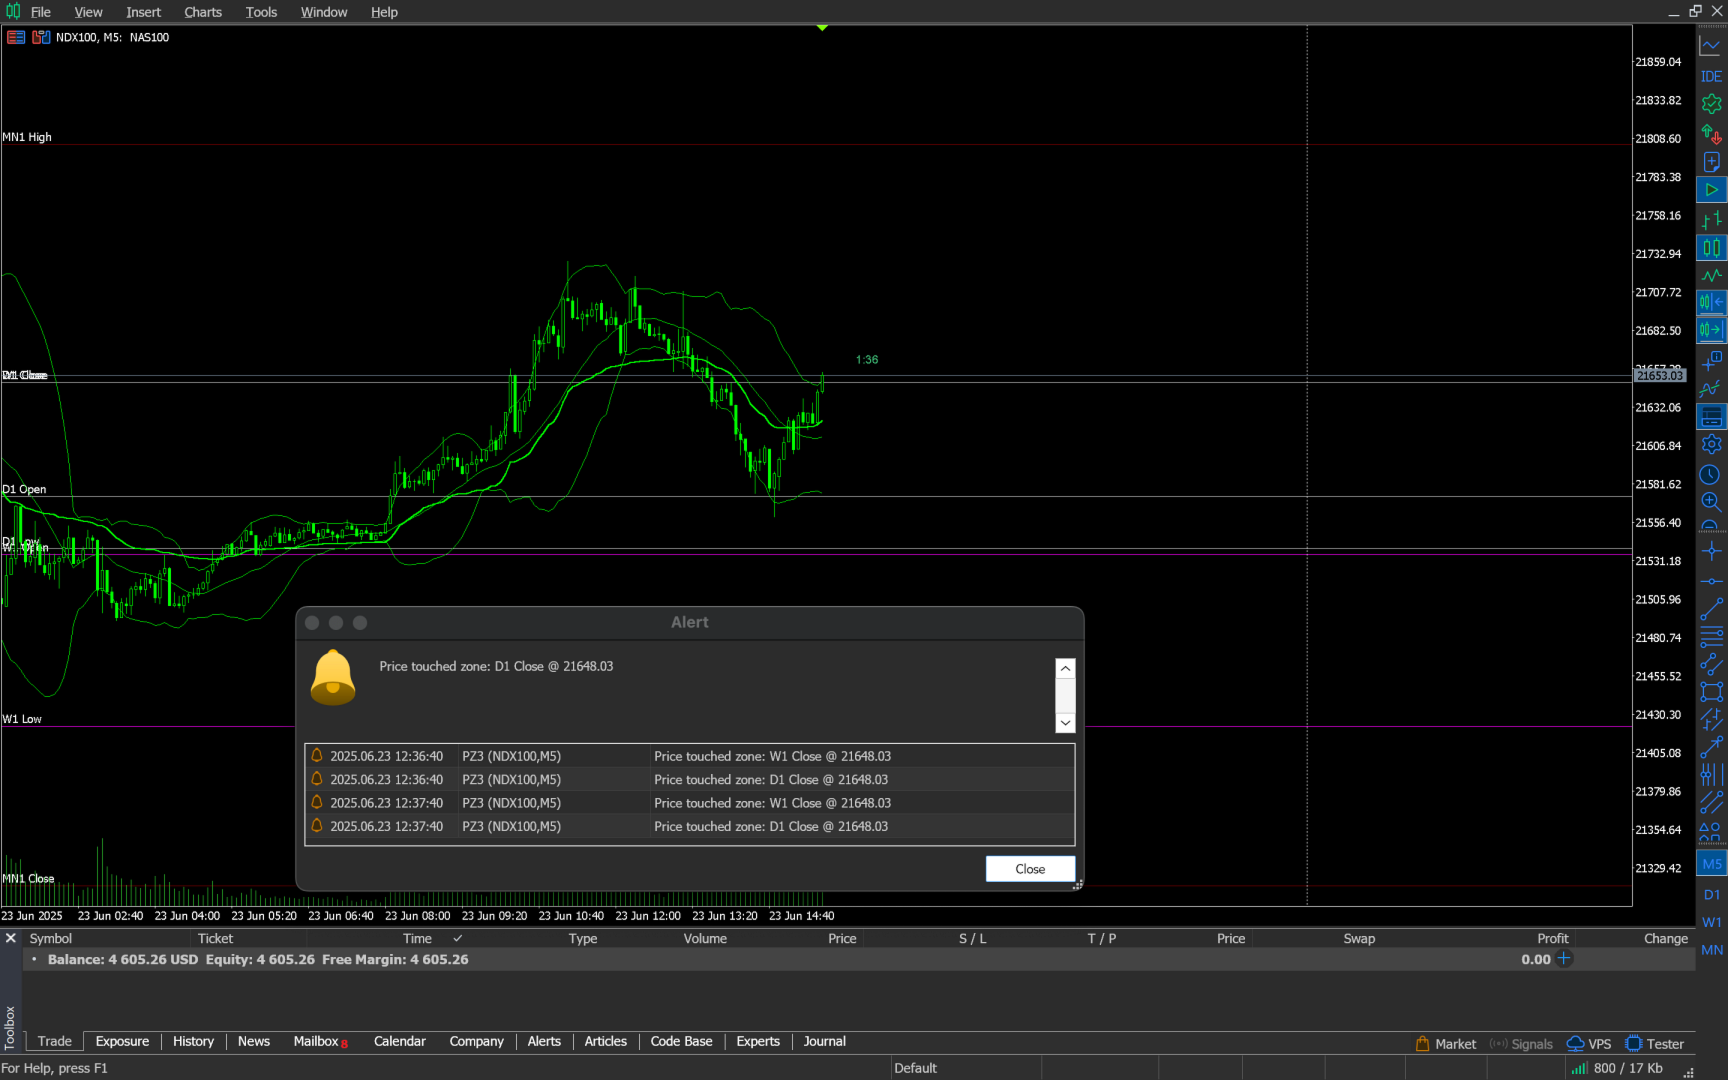
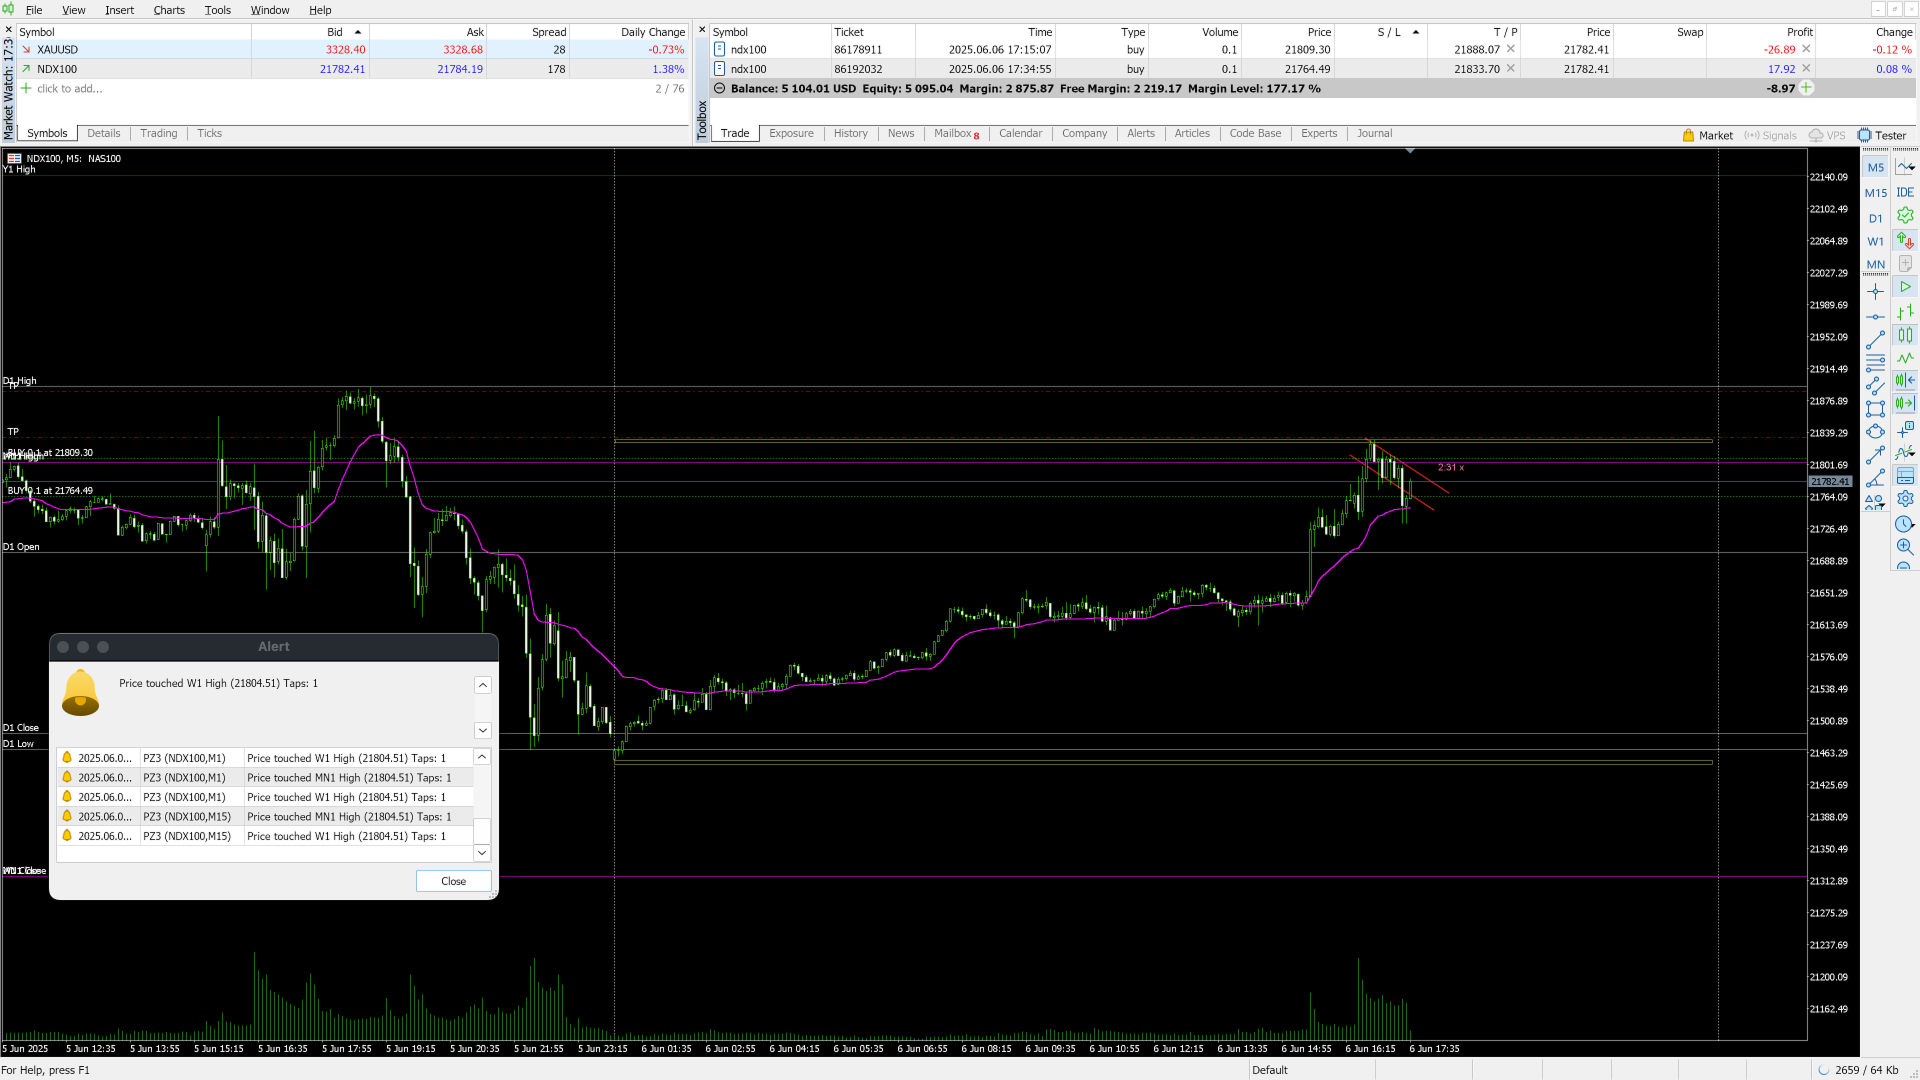
Get notified the moment price reaches a level — alerts are triggered by active candle logic, not delayed timers. -
Zone Interaction Memory
Keeps track of how many times each level has been touched — helping you assess the relative strength of a zone. -
Minimalist Visual Layout
Clean, high-contrast levels designed for clarity — no visual clutter, suitable for all trading environments. -
Timeframe-Sensitive Display
Automatically adapts zone visibility based on your chart — see only what’s relevant to your analysis. -
Fixed and Non-Repainting
All zones are time-locked and remain consistent — helping you maintain a stable reference across sessions.
Ideal For
-
Traders who rely on well-defined price structure
-
Funded account managers and professionals working across timeframes
-
Technical analysts combining taps, zones, and multi-timeframe confluence
-
Traders who want clarity without visual overload
-
Professionals who recognize the impact of OHLC prices on market behavior
HumaI Power Zones™ delivers clarity and precision for those who trade with purpose.
It’s more than an indicator — it’s a consistent structure for confident decision-making.