HumaI Power Zones

HumaI Power Zones™ – Mappatura OHLC Precisa per Trader Professionisti

Descrizione del Prodotto
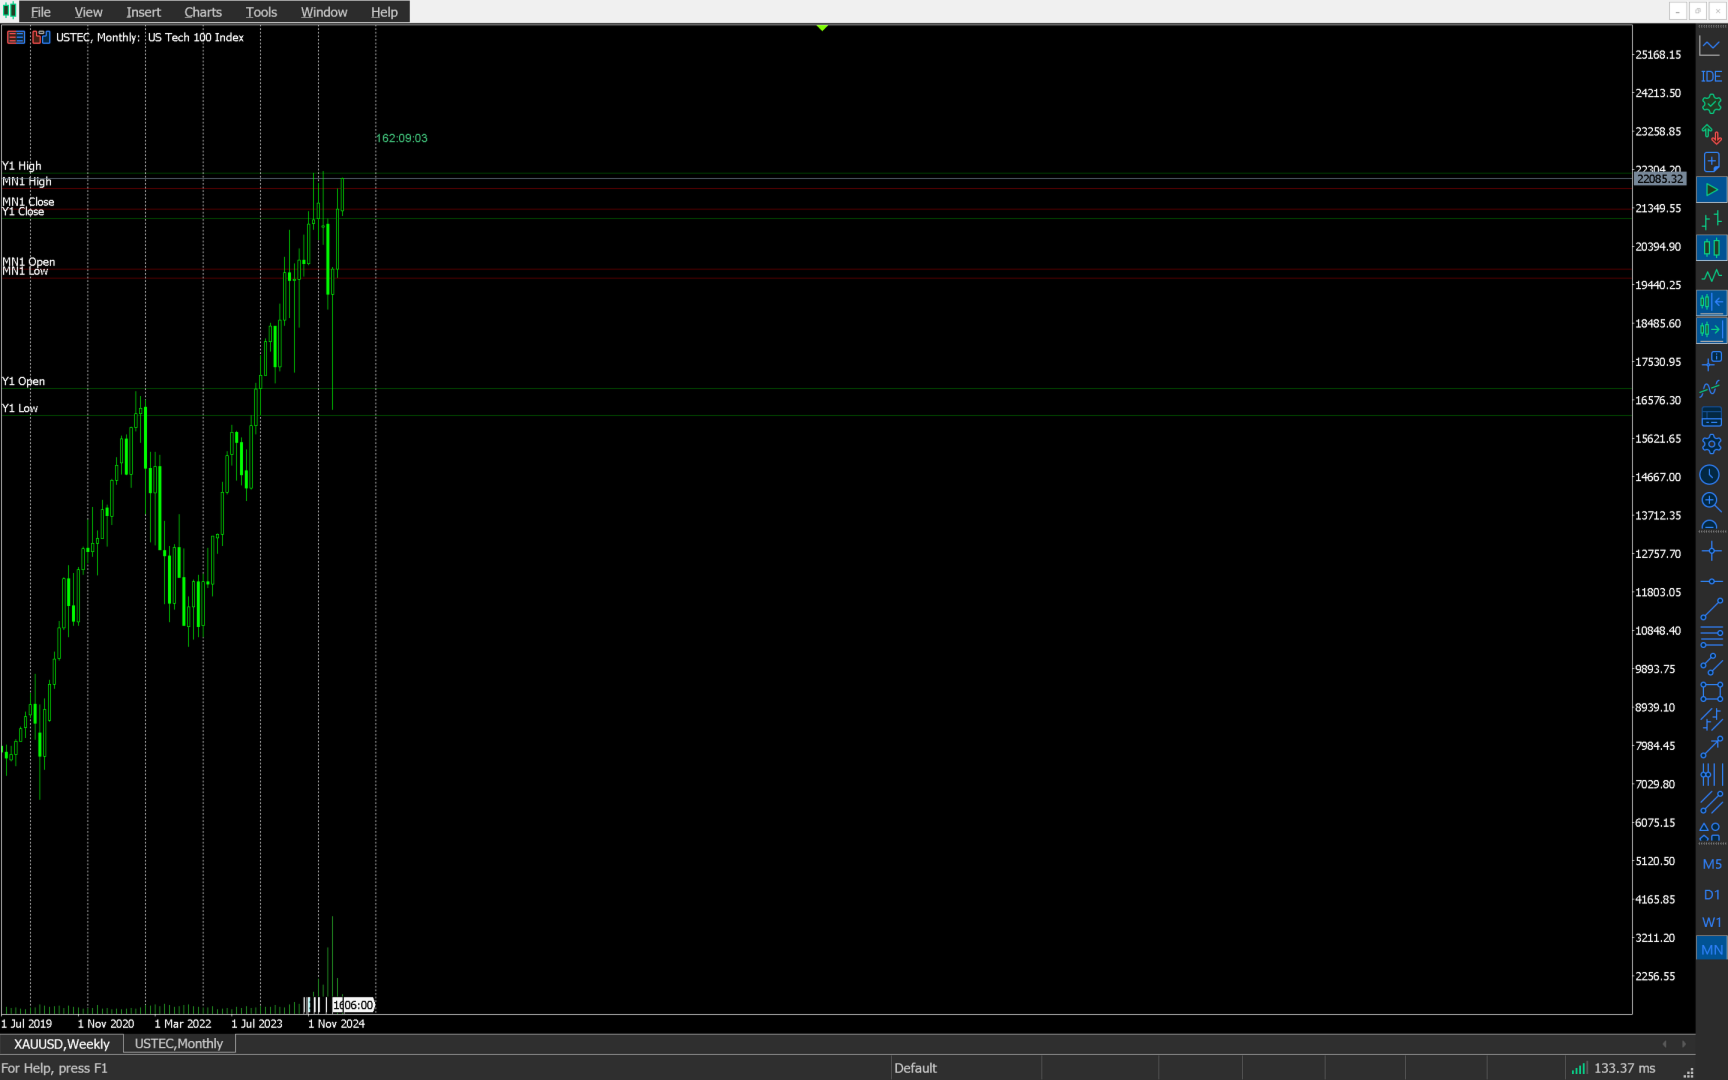
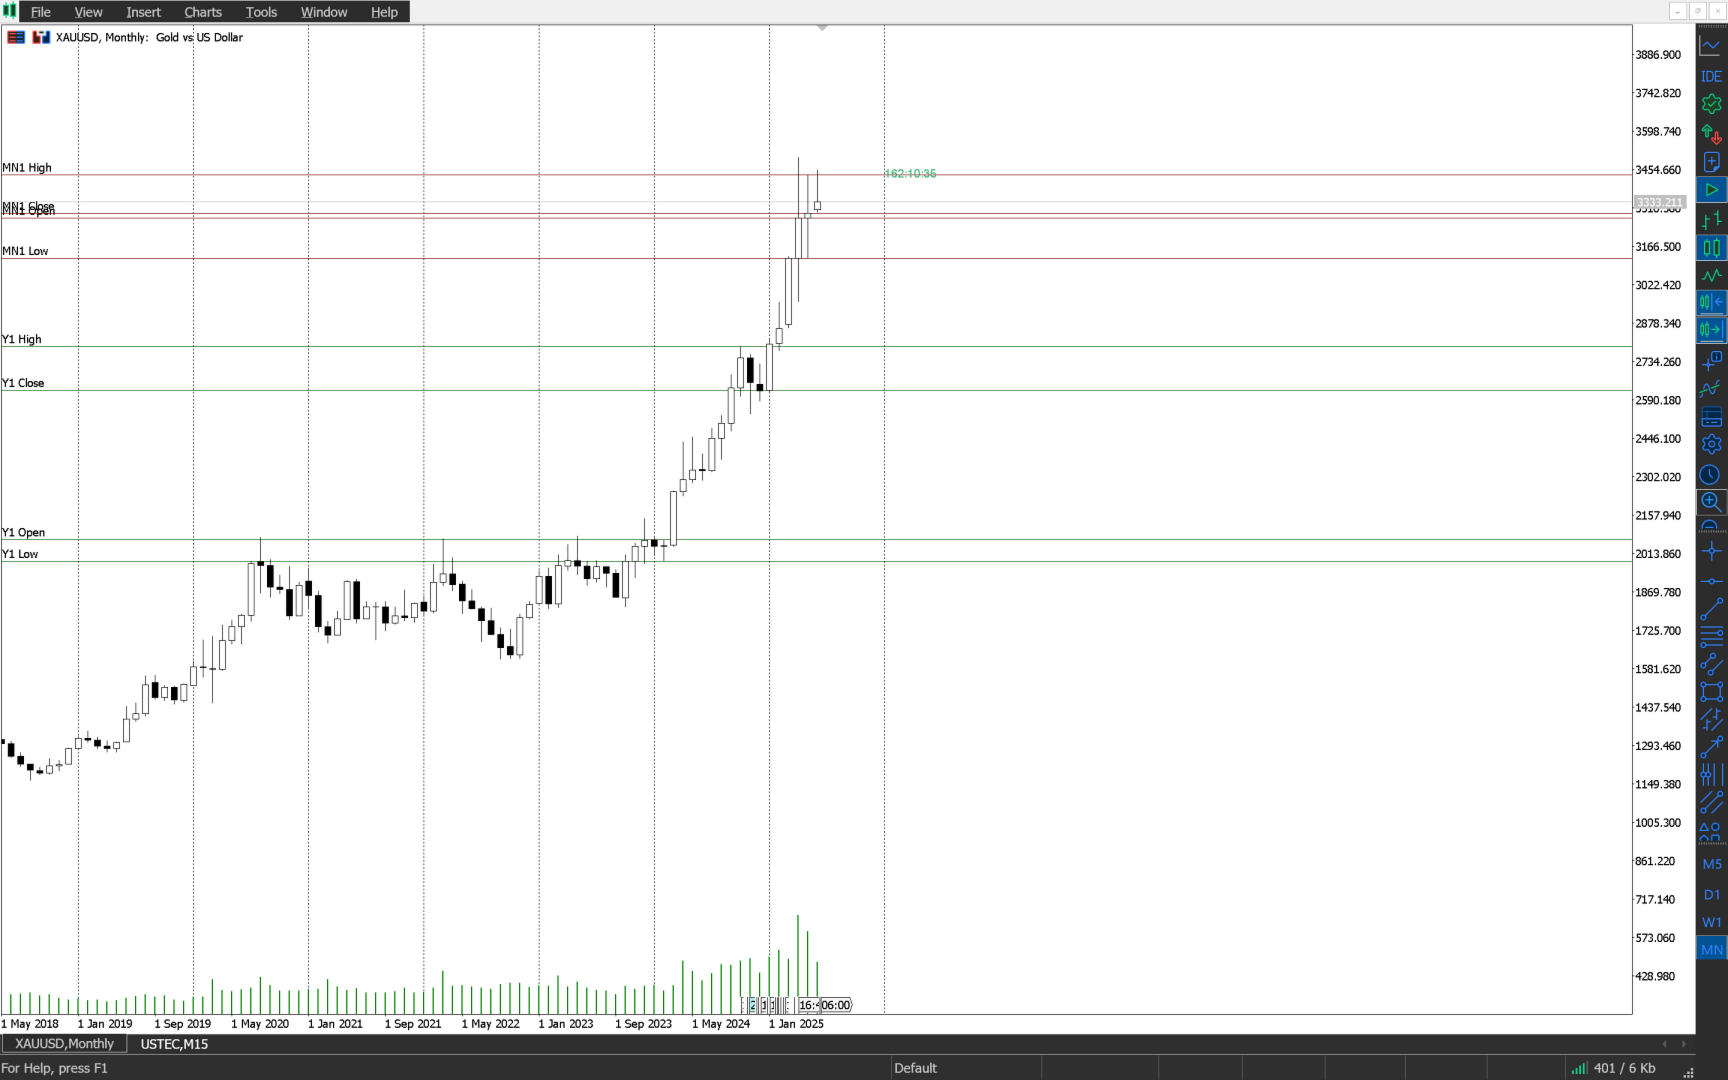
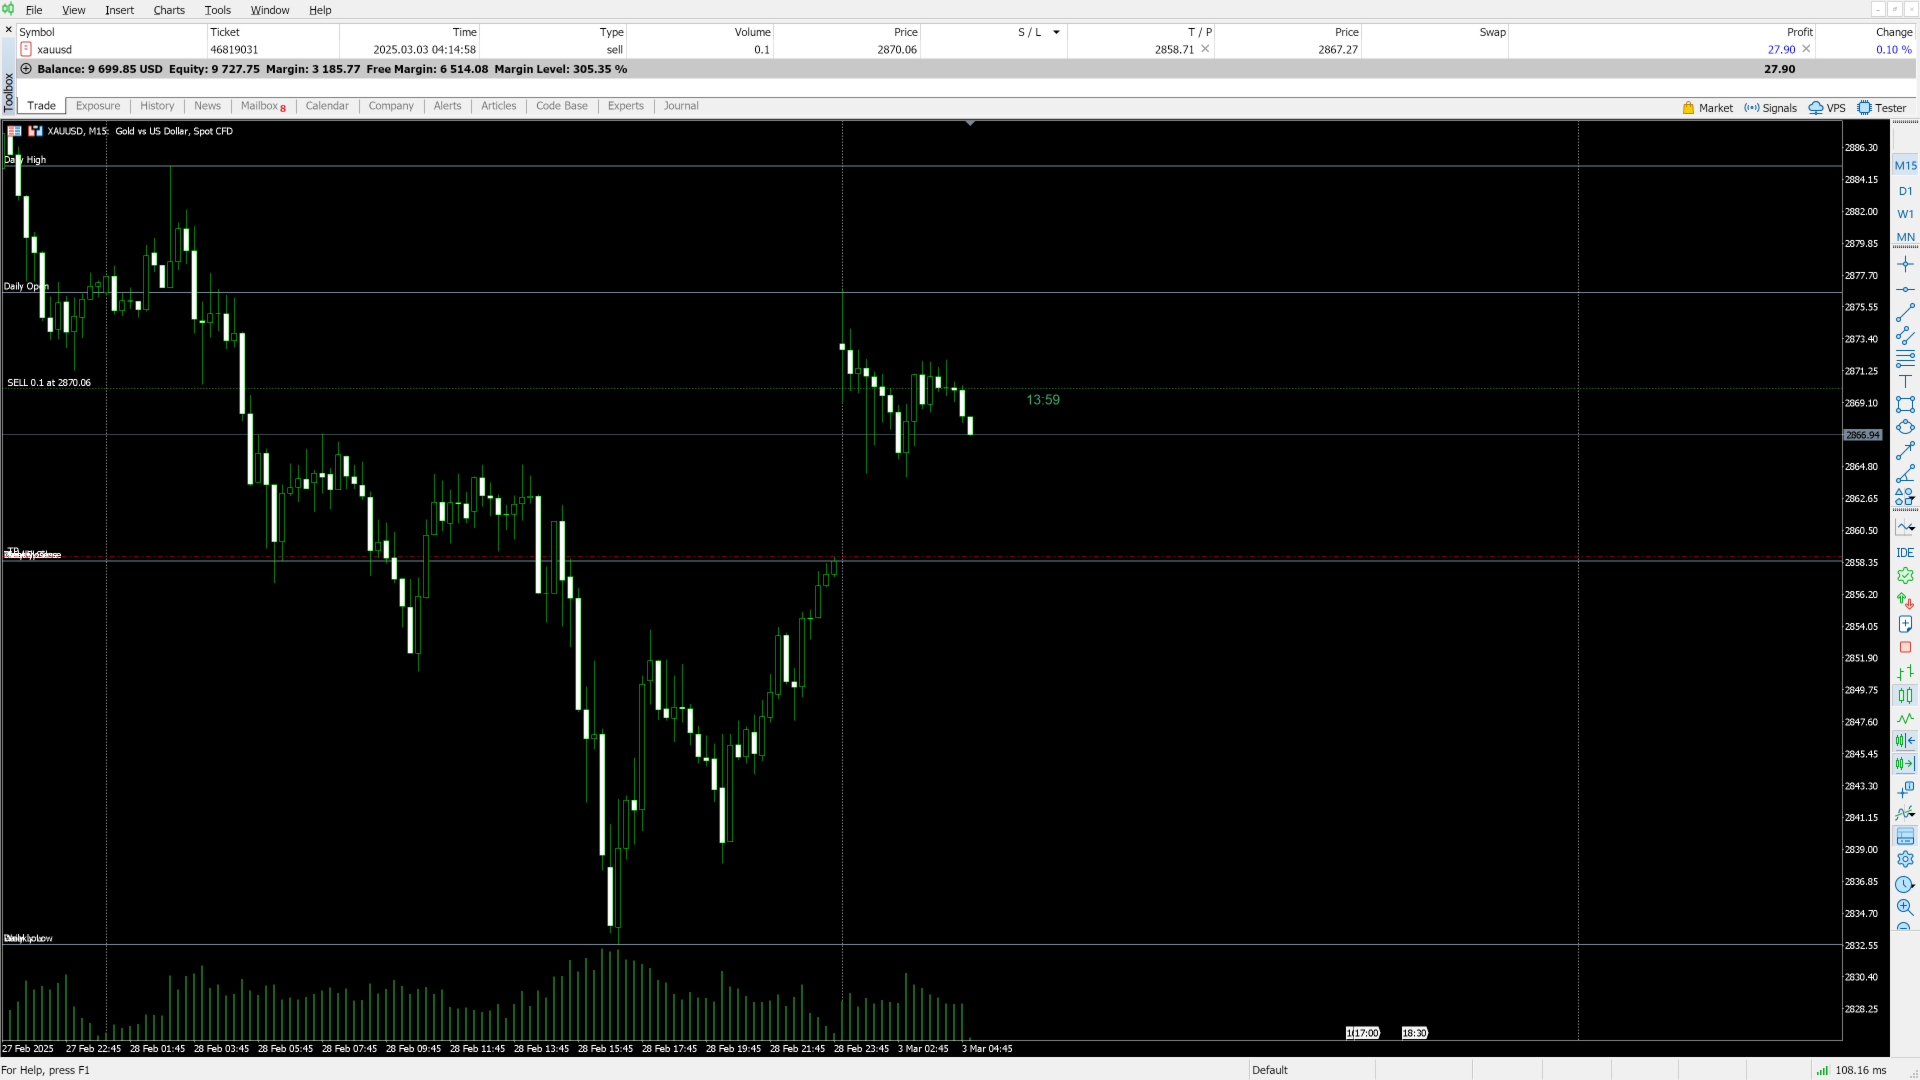
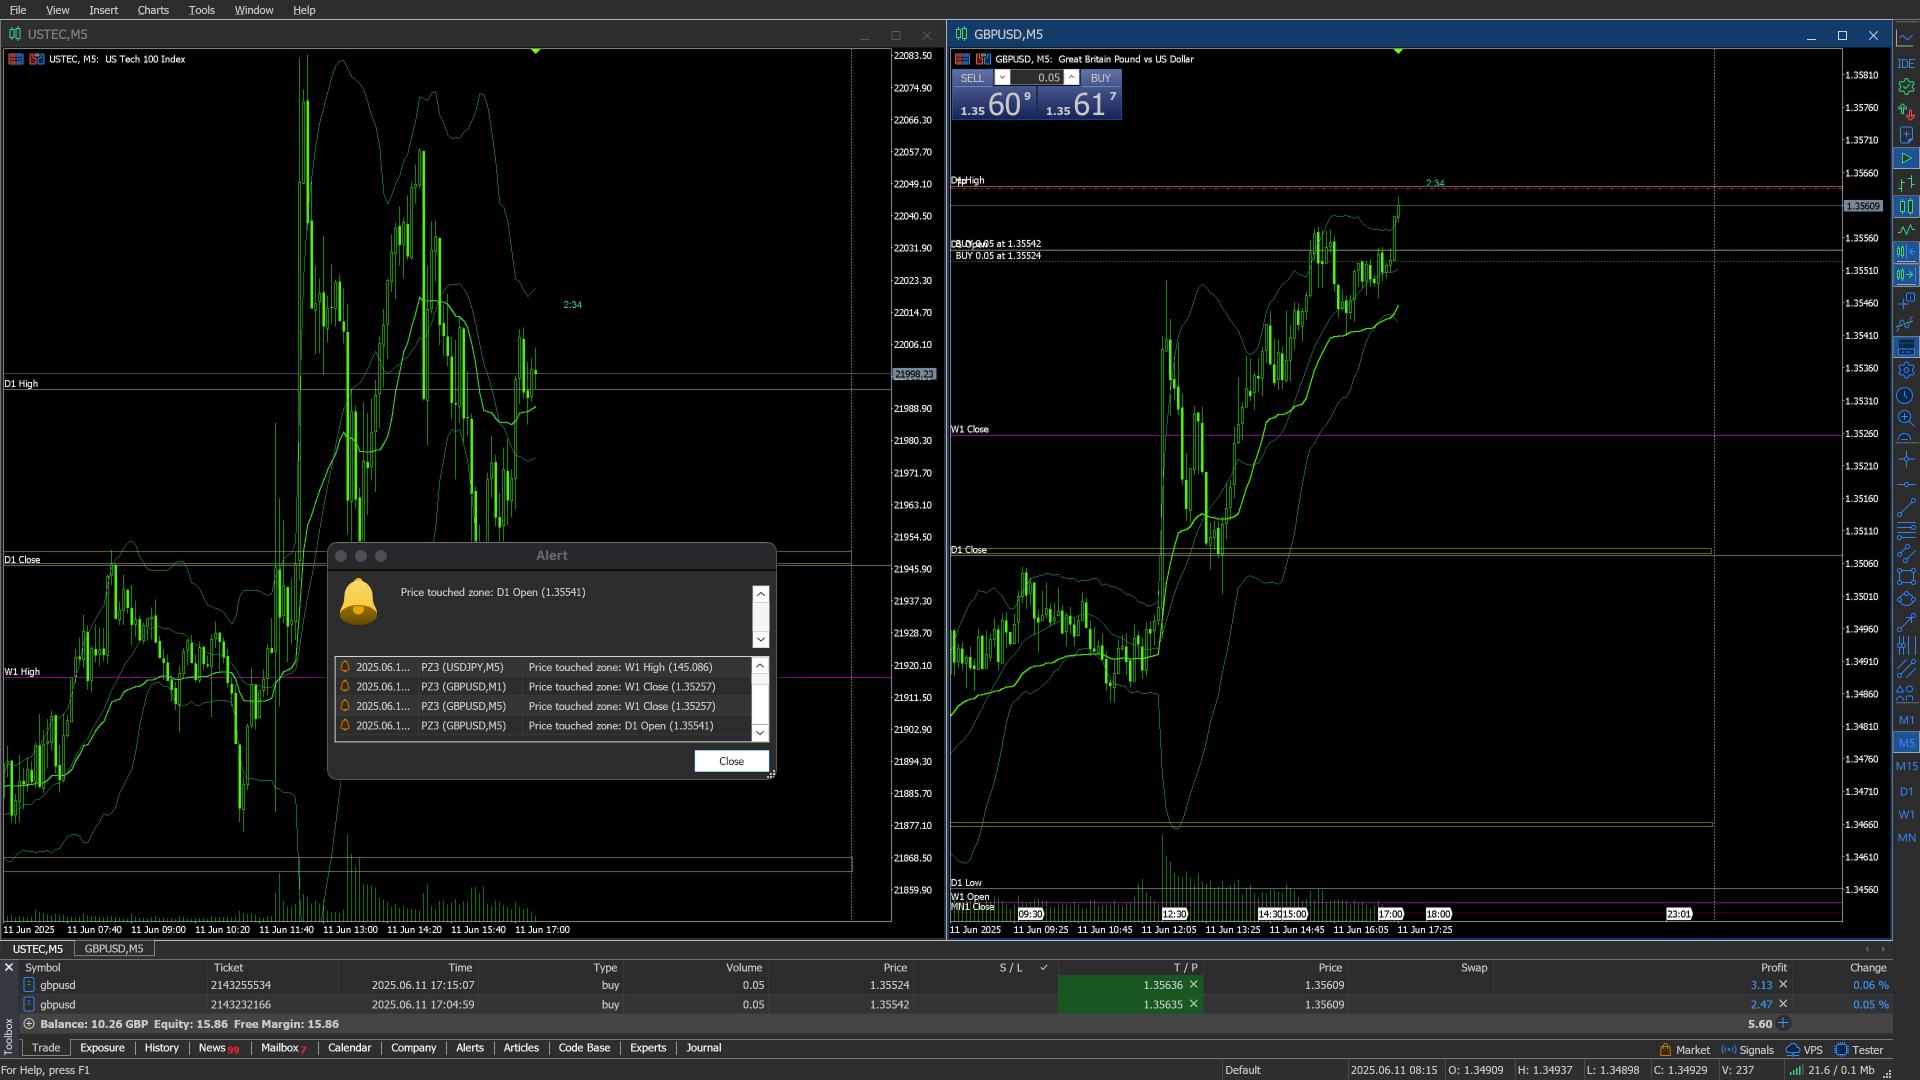
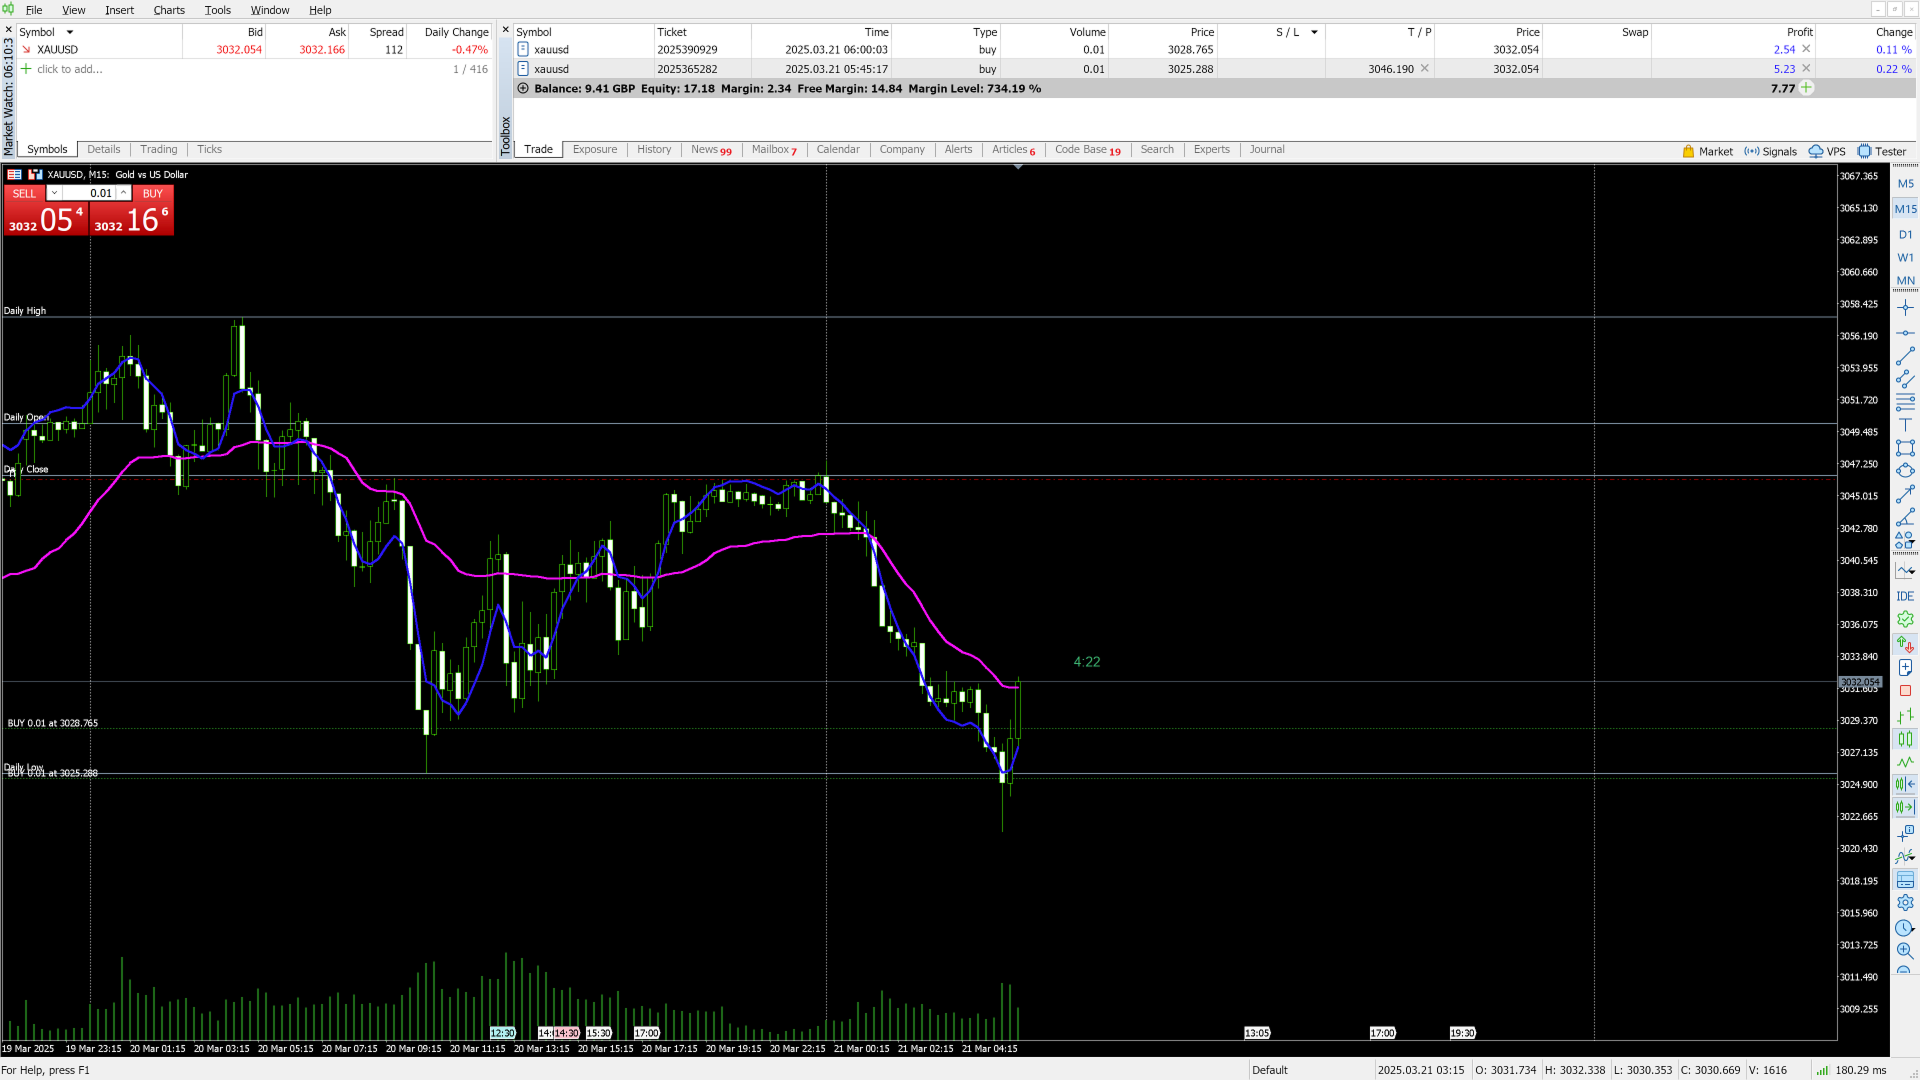
HumaI Power Zones™ è un indicatore progettato con precisione per identificare e tracciare automaticamente i livelli OHLC (Open, High, Low, Close) più rilevanti sui timeframe Giornaliero (D1), Settimanale (W1), Mensile (MN1) e Annuale (Y1).

Questi livelli vengono calcolati in tempo reale con estrema esattezza, offrendo una visione chiara e affidabile della struttura storica dei prezzi su qualsiasi grafico. Che tu faccia trading su timeframe bassi o analizzi la struttura su larga scala, HumaI Power Zones™ ti fornisce un quadro preciso e ordinato per supportare le tue decisioni operative.

Caratteristiche Principali

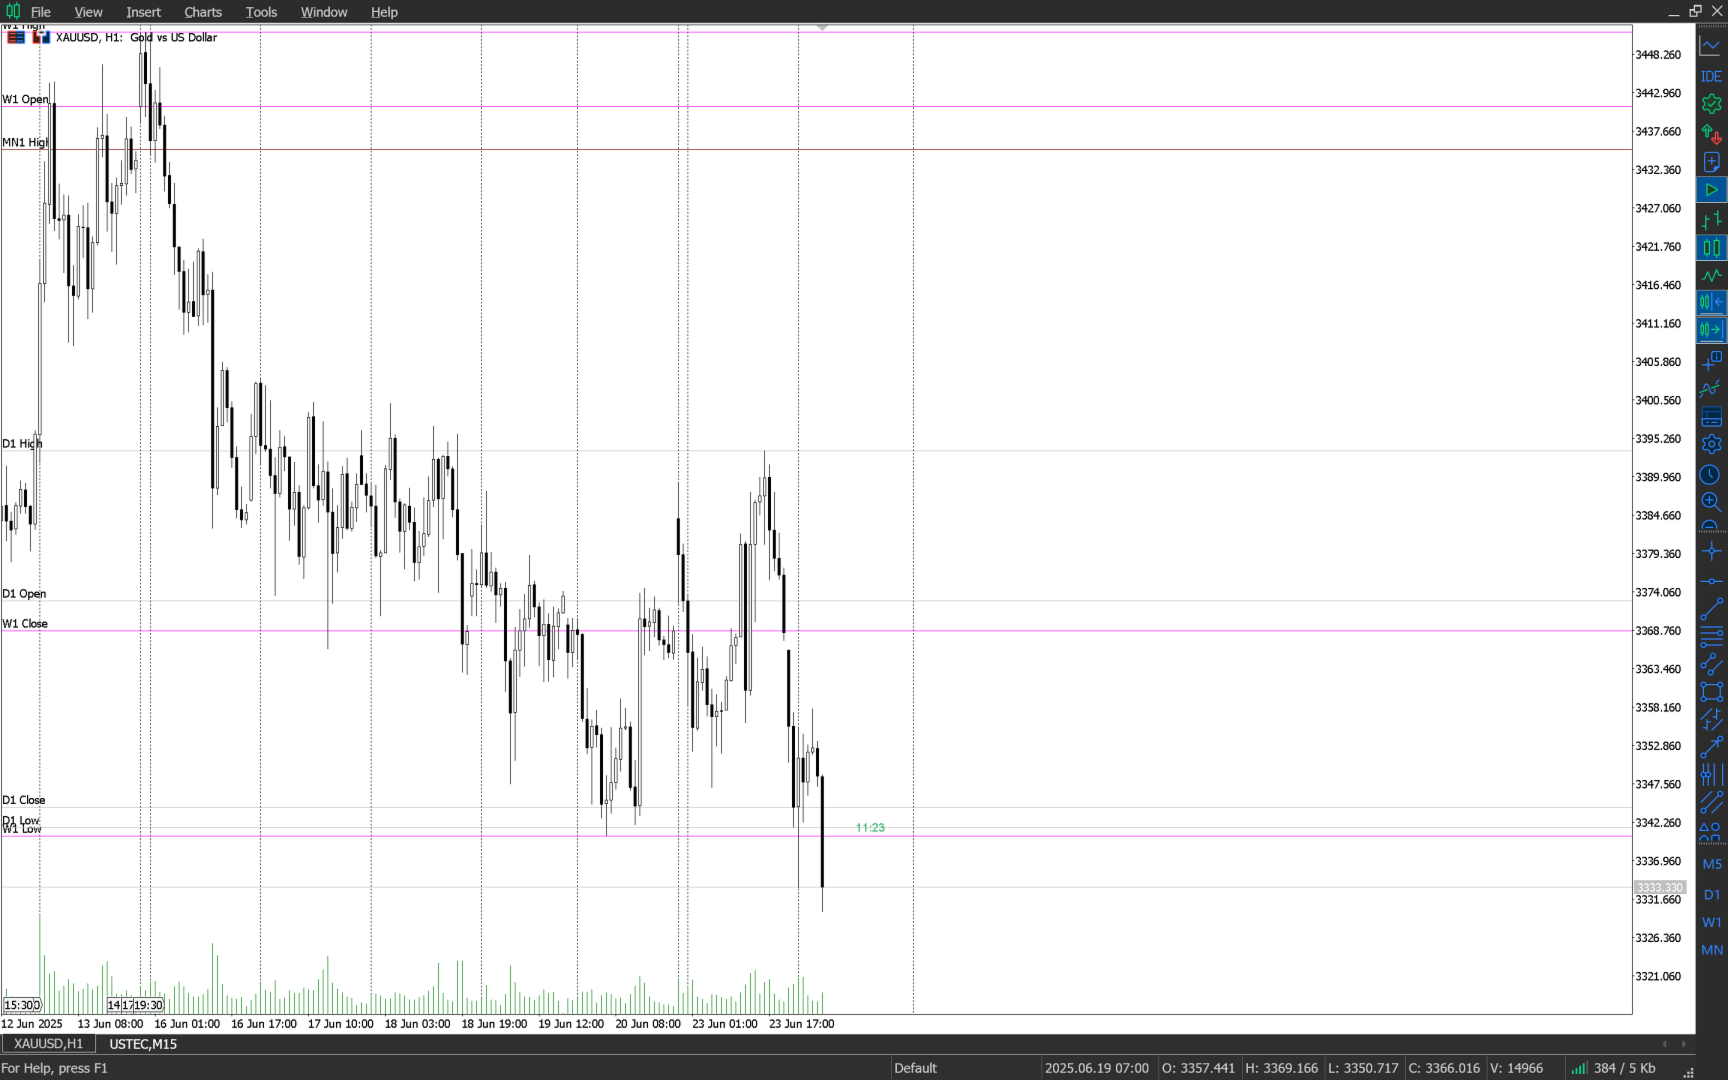
  • Livelli OHLC di Precisione Istituzionale
    Tracciamento automatico dei livelli di apertura, massimo, minimo e chiusura dai timeframe D1, W1, MN1 e Y1.

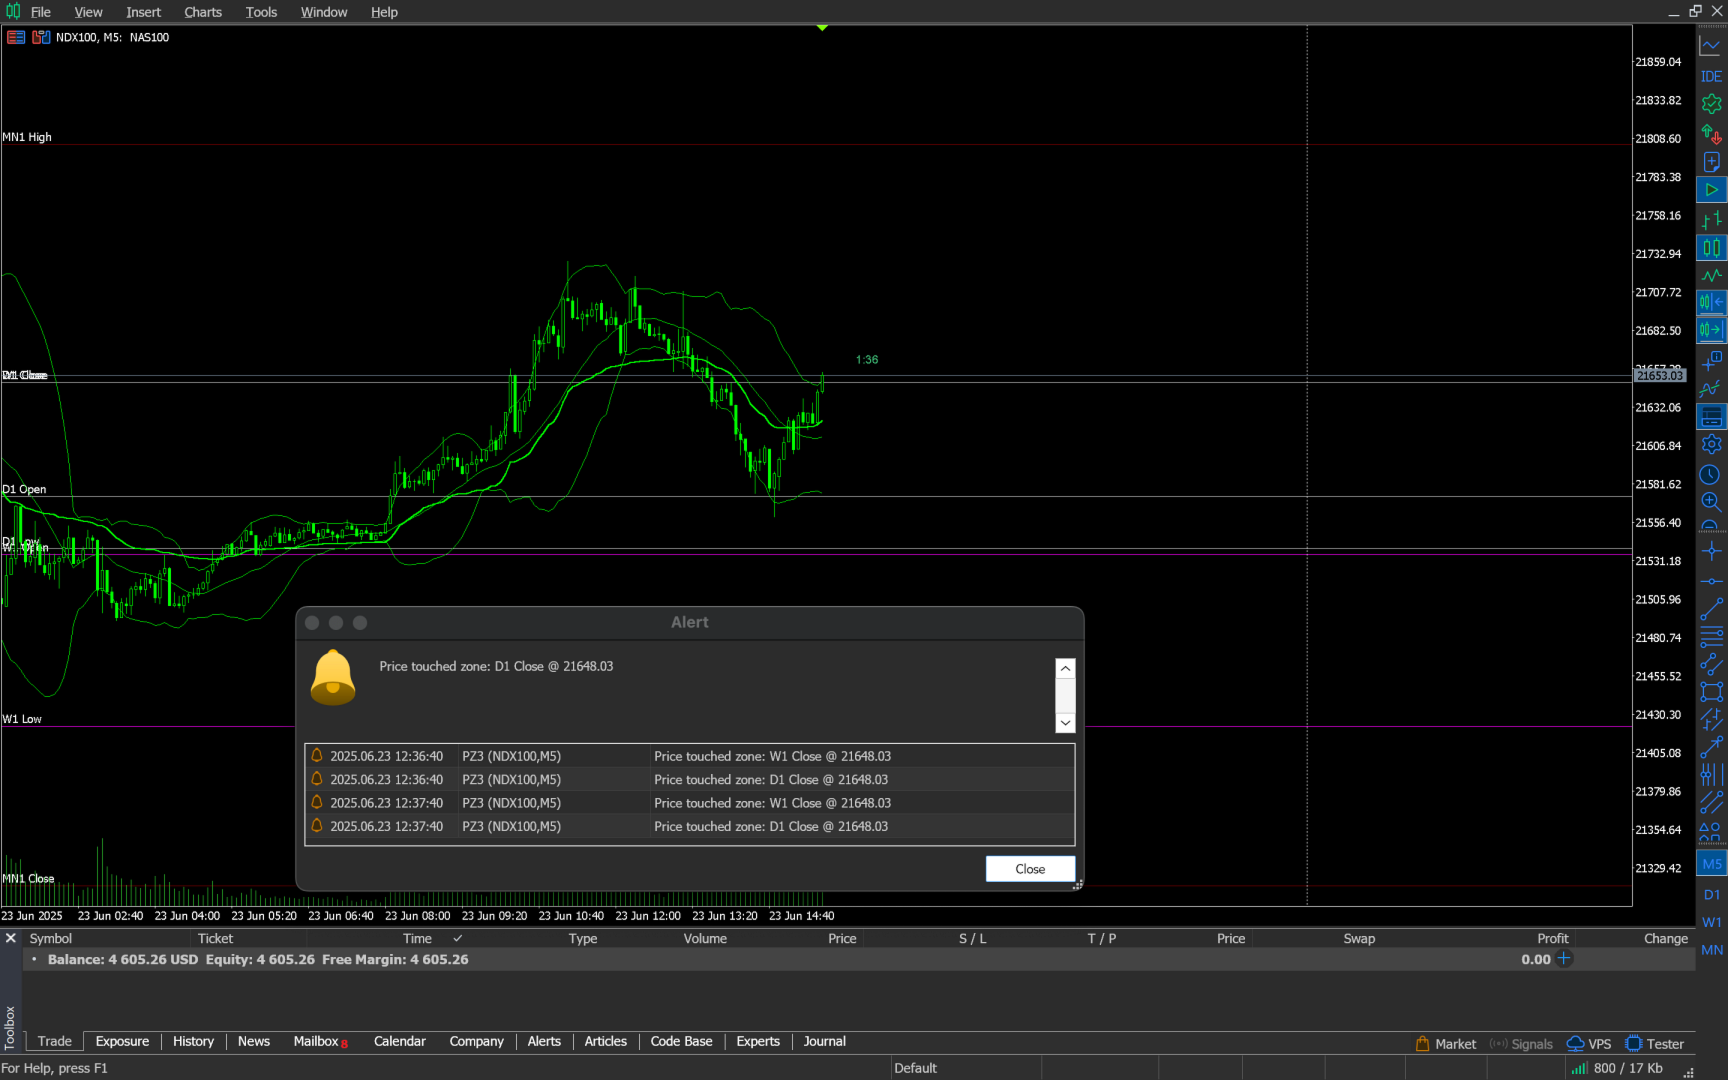
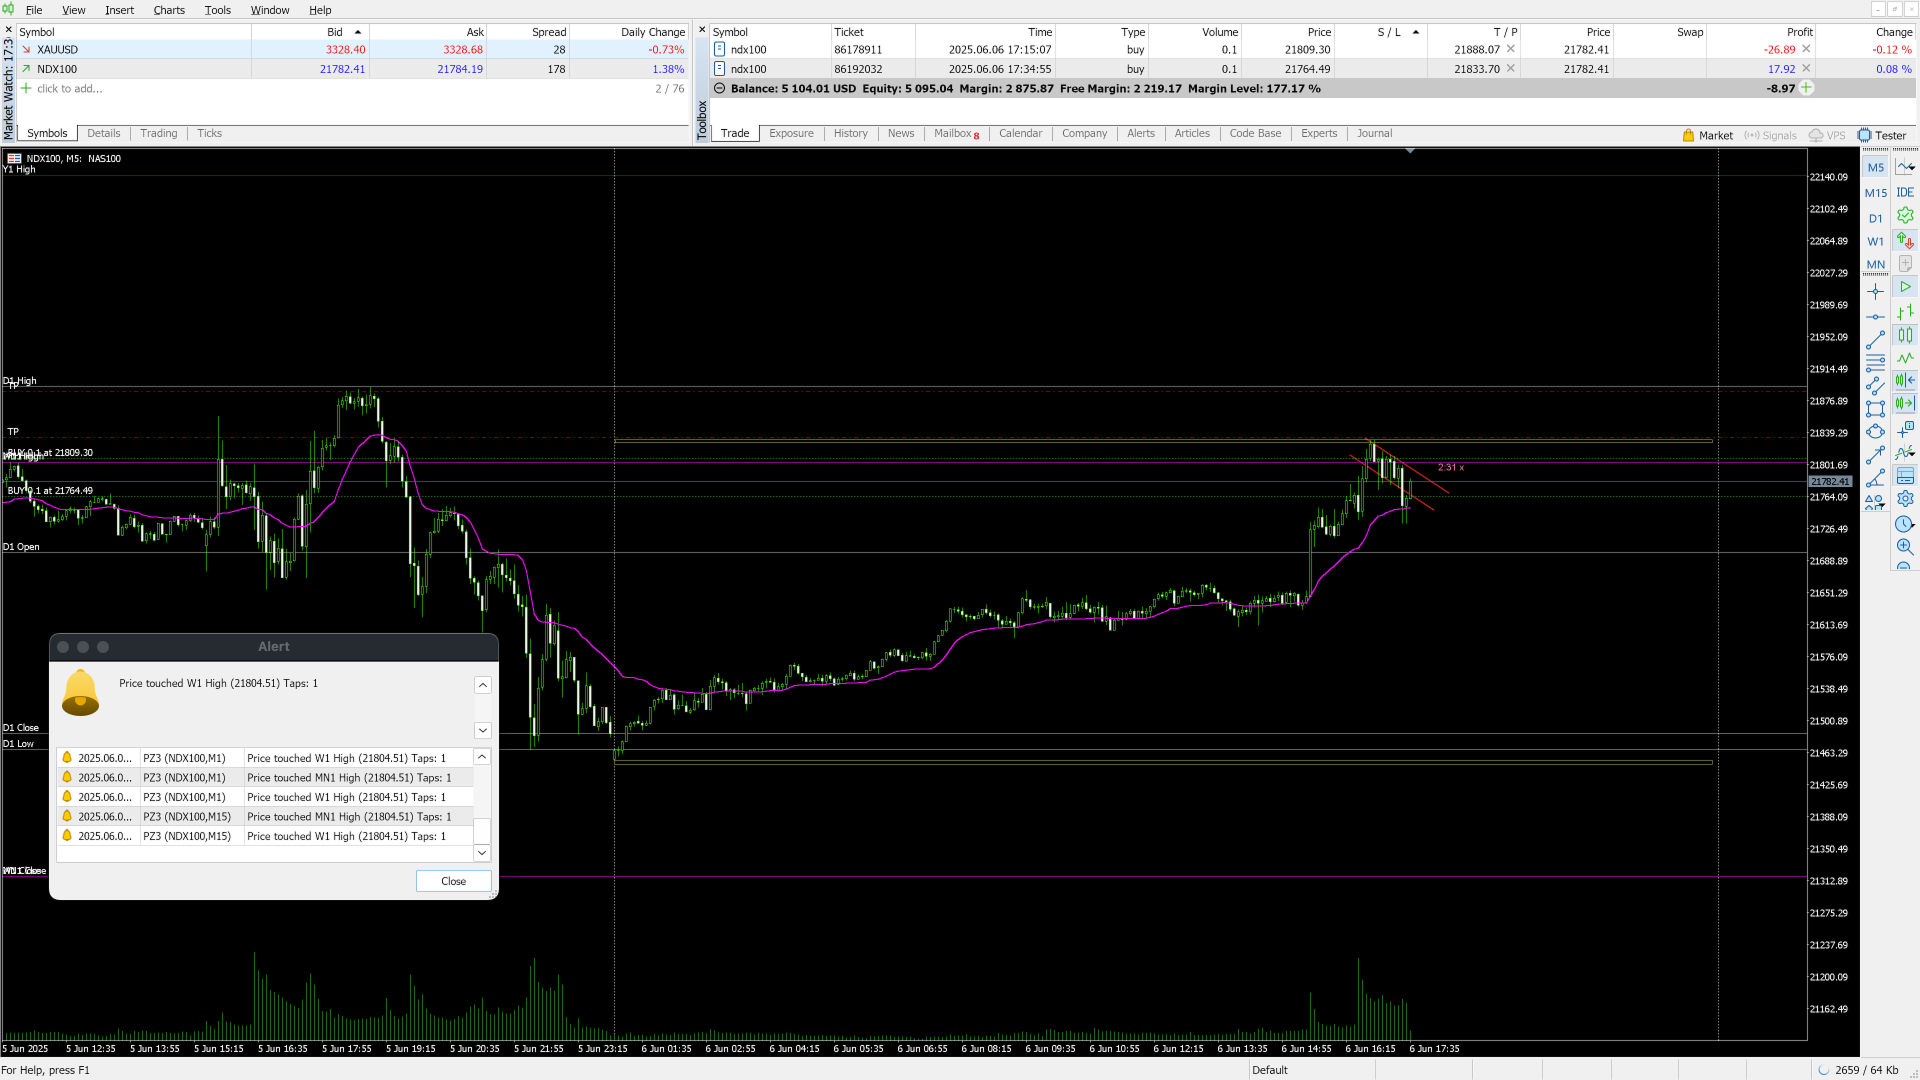
  • Sistema di Avvisi Intelligente
    Ricevi notifiche immediate quando il prezzo raggiunge una zona — basato su logica reale delle candele, senza ritardi.

  • Memoria dell’Interazione con le Zone
    Registra quante volte il prezzo ha toccato ciascun livello — utile per valutare la forza o debolezza di una zona.

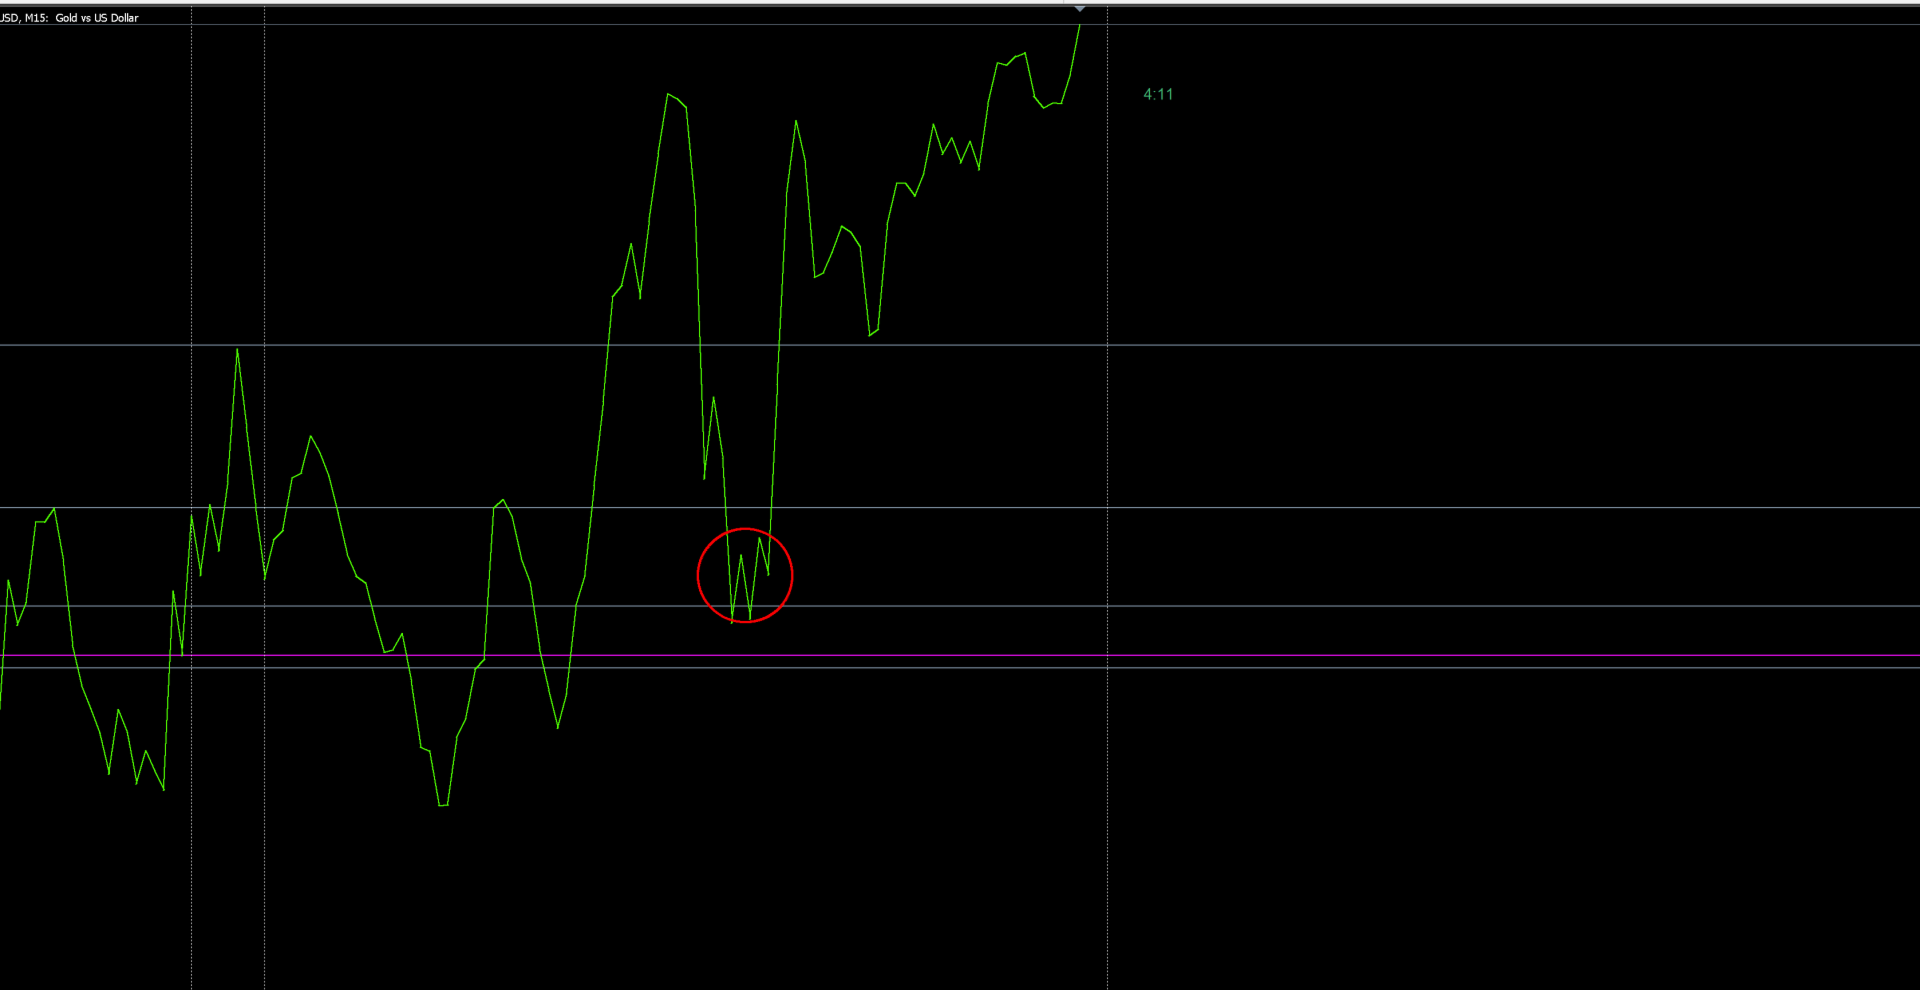
  • Design Visivo Minimalista
    Linee pulite e ad alto contrasto, senza ingombro visivo — ideale per ambienti di trading dinamici.

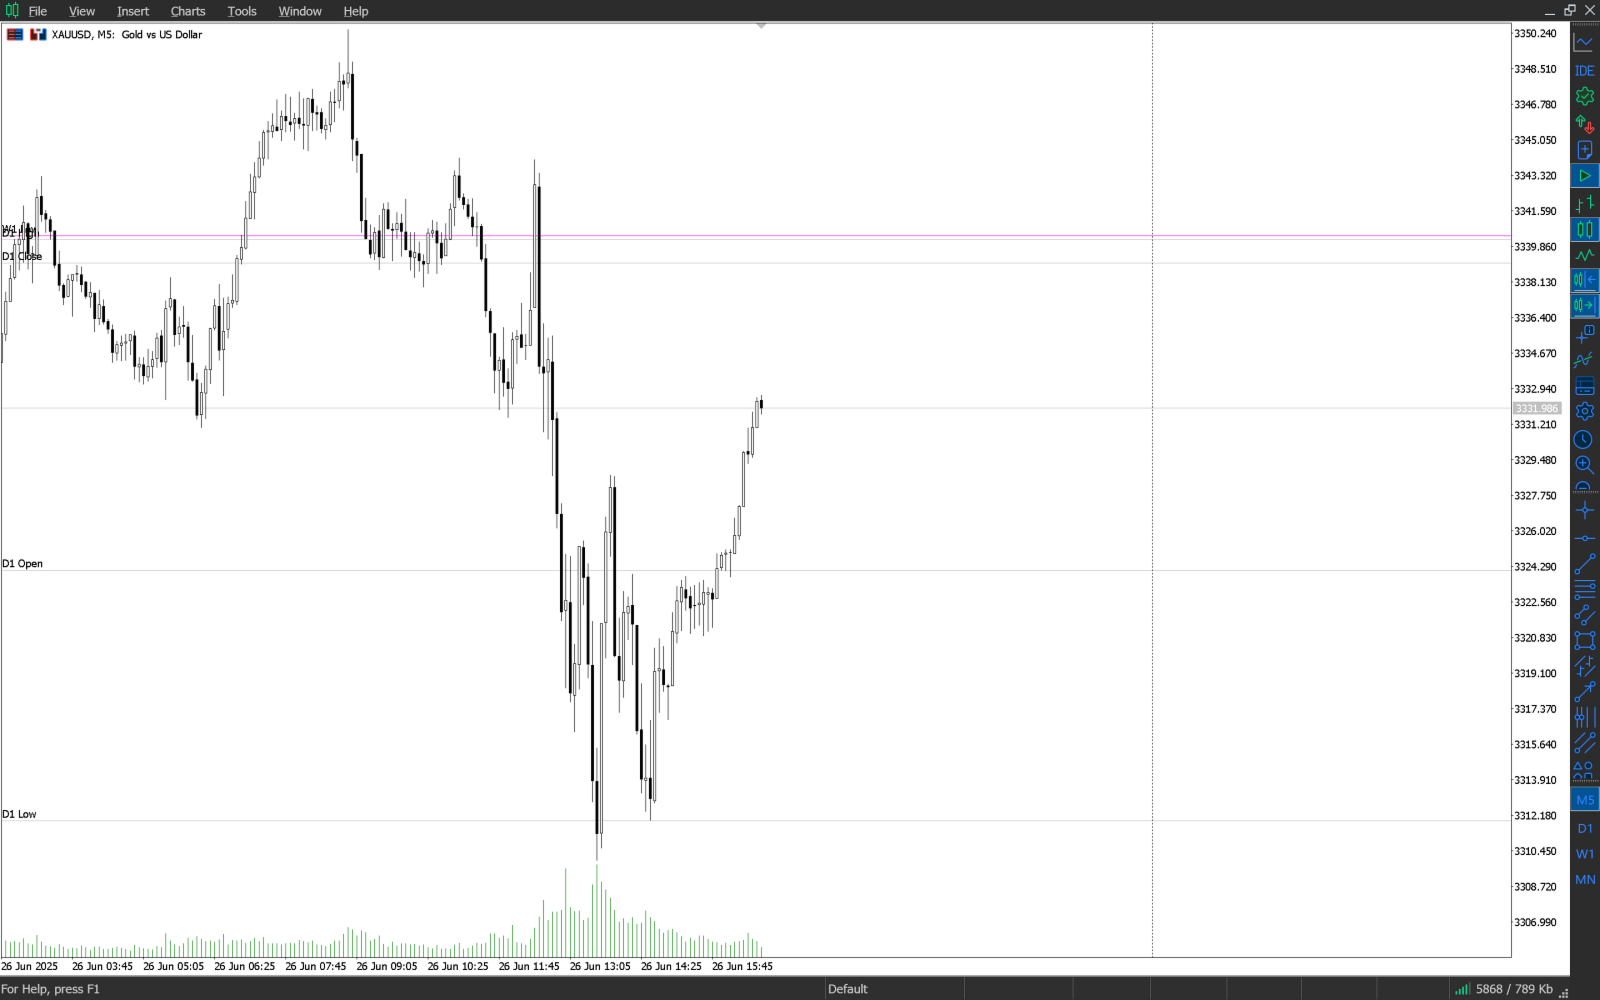
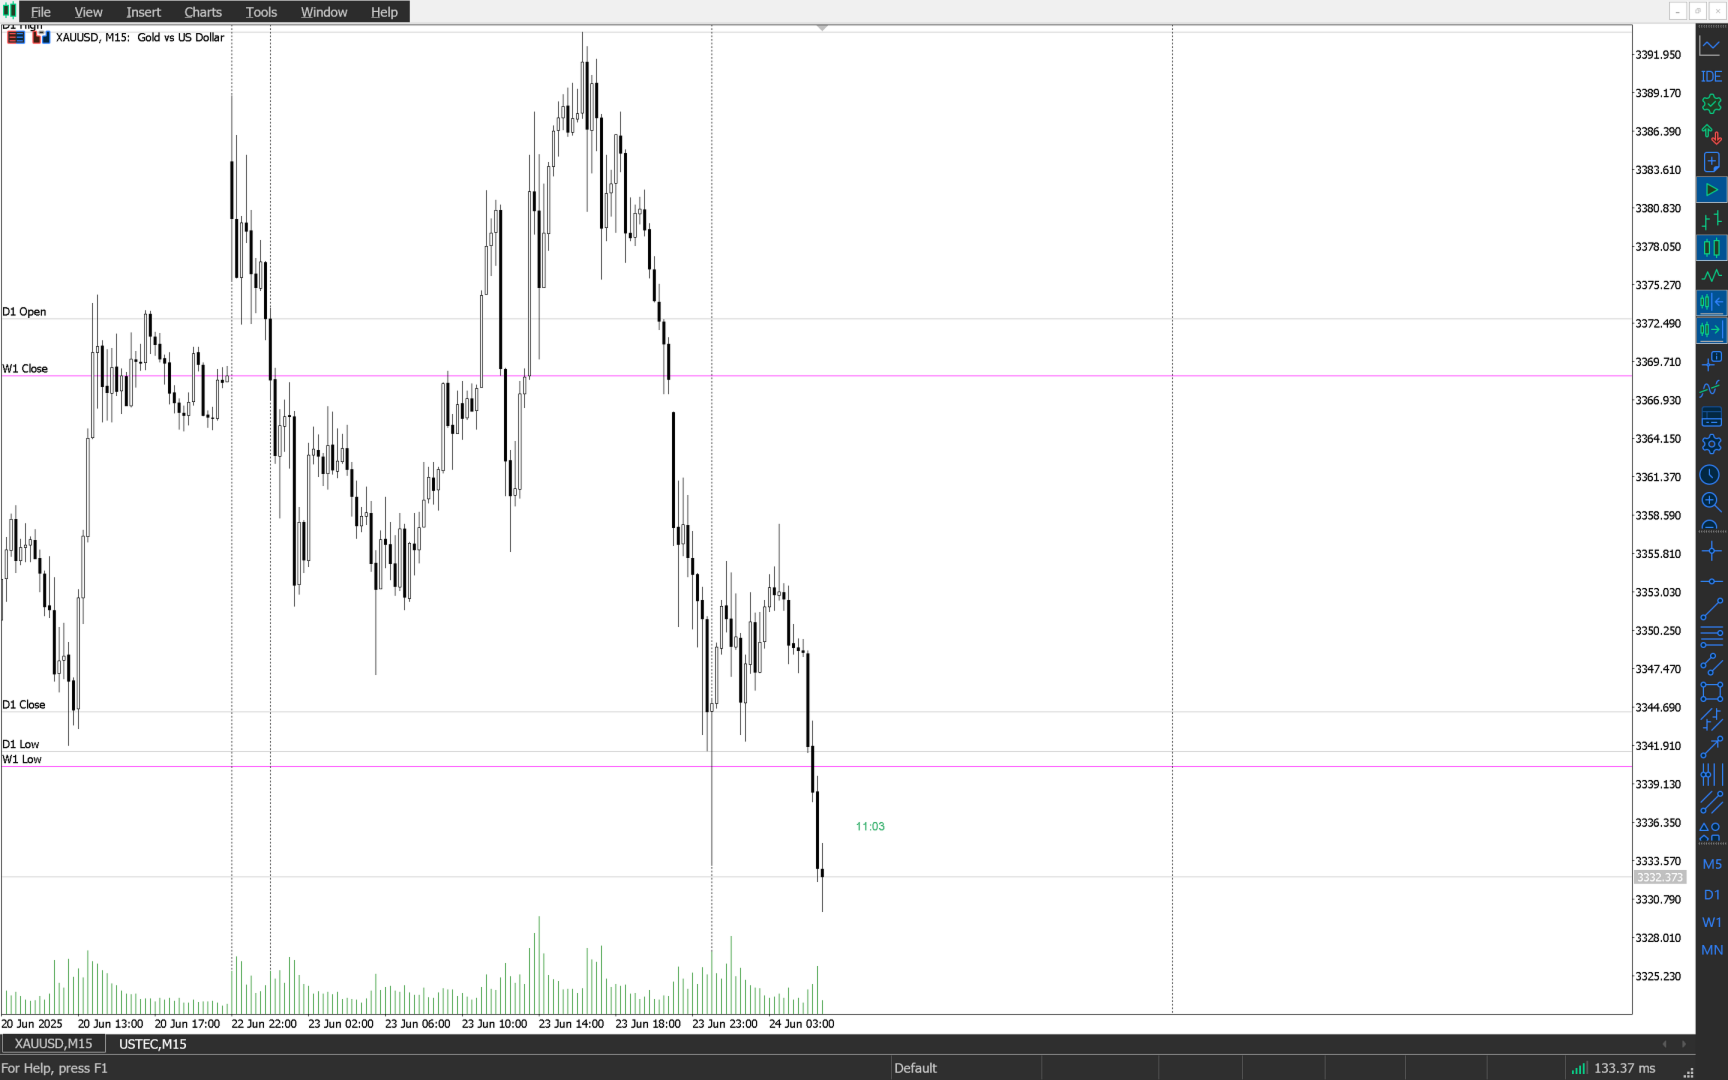
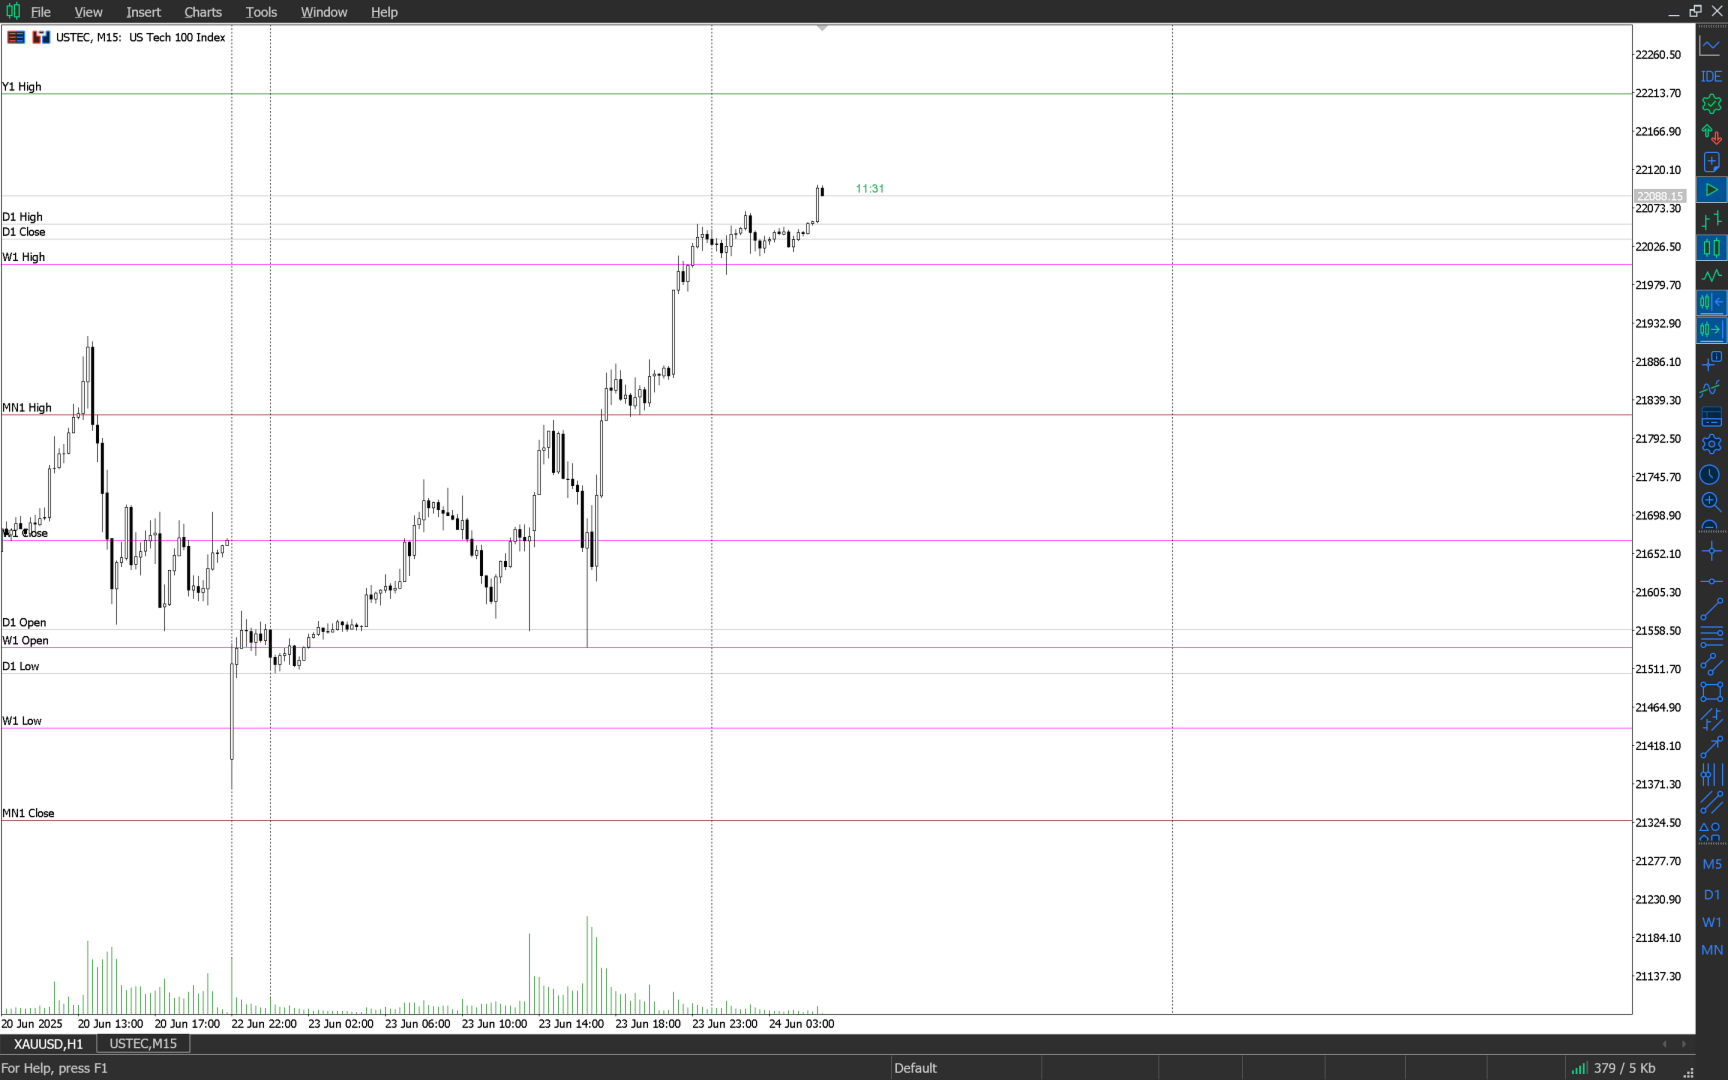
  • Visualizzazione Sensibile al Timeframe
    Mostra solo le zone rilevanti per il timeframe corrente — per una lettura focalizzata ed efficace.

  • Fisso e Senza Repainting
    Ogni livello è ancorato nel tempo e non si ridisegna — garantendo coerenza e precisione.

Ideale Per

  • Trader che si affidano alla struttura storica dei prezzi

  • Trader professionisti o finanziati attivi su più timeframe

  • Analisti tecnici che integrano zone, contatti e struttura

  • Chi cerca riferimenti affidabili senza sovraccarico visivo

  • Professionisti che comprendono l’impatto dei livelli OHLC nei mercati finanziari

HumaI Power Zones™ offre chiarezza e precisione per ogni decisione relativa alla struttura del prezzo.
Non è solo uno strumento di disegno — è un sistema strutturato pensato per migliorare la tua analisi con controllo e sicurezza.


Prodotti consigliati
Deal multiplier Mt5
Mikhail Mitin
4.5 (8)
The utility opens copies of open trades. It is very convenient if you use the   Signals   service and want to increase the volume of transactions. Settings: Symbols: all symbols only current symbol Orders: Buy Sell Magic Any Magic Input Magic Lot size Original - lot size from original order; Fix Lot - fix lot size (input); Lot X Mult - lot size X koef; Stop Loss From sender - Stop Loss from original; Without - without Stop Loss; Plus Fix - Stop Loss from original order + fix points; Fix Point -
FREE
LT Pointer Sync
Thiago Duarte
4.5 (6)
Pointer Sync is a pointer synchronizer between open charts. It makes the MT5 cross (activated by the middle mouse button) to be replicated on all open charts. In addition, it is possible to create horizontal lines (letter H) and vertical lines (letter V), very useful for studying. The appearance of the lines is customizable. Note: Synchronization is through the X and Y scale in pixels , not price and/or date. It is a simple and free utility. Enjoy! This is a free indicator, but it took hours to
FREE
LT Ajuste Diario
Thiago Duarte
3.67 (3)
This is a tool in script type. It shows in chart the actual and/or past day ajust price in a horizontal line. The symbol name and it expiration must be set up according to the actual parameters. The lines appearance are fully customizable. You need to authorize the B3 url on MT5 configurations:  www2.bmf.com.br. You need this to the tool can work. This is a tool for brazilian B3 market only!
FREE
The   Pivot Point indicator   automatically calculates and displays the pivot point line and support and resistance levels. Pivot can be calculated according to the Classic, Floor, Fibonacci, Woodie, Camarilla or DeMark formula. It is also possible to select the period for calculating the indicator. A trader can choose from daily, weekly, monthly, or user-defined periods. Types of pivots Classic Floor Fibonacci Woodie Camarilla DeMark Main features The indicator shows the current and historic
FREE
️ Trade Manager oneclick  ( Reverse Trade,  Partial Close,  Breakeven, Close All Running Trade )   control – Smart Manual Trade Control for MT5 Trade Manager oneclick control is a powerful yet lightweight trade management utility built for manual traders who want precise control over their open positions — directly from the MT5 chart. This EA does not open or close trades automatically based on any strategy. It simply provides one-click management tools to handle your running trades efficient
FREE
SphereSample
MetaQuotes Ltd.
The script SphereSample.mq5 illustrates control of graphic objects using the classes from the Standard Library (Base class of objects array CArrayObj , CChartObjectText ).
FREE
Hi you, I need your help! Be my Patron, let's make it possible! https://www.patreon.com/joaopeuko https://github.com/Joaopeuko/Mql5-Python-Integration Channel: English version - Versão Inglês: https://www.mql5.com/en/channels/Mql5_Python_Integration_EN Portuguese version - Versão Português: https://www.mql5.com/en/channels/Mql5_Python_Integration_PT Paid version with 38 indicator: https://www.mql5.com/en/market/product/58056 I believe that development in PYTHON is easier and simpler
FREE
Indicatore Ombre: Svela il Potere Nascosto di Ogni Candela! Sei stanco di un'analisi superficiale dell'azione dei prezzi? Desideri una comprensione più profonda della forza di acquirenti e venditori in ogni intervallo temporale? Ti presentiamo l' Indicatore Ombre – il tuo strumento indispensabile per visualizzare e analizzare le dinamiche nascoste del mercato! Questo potente indicatore trasforma la battaglia invisibile tra tori e orsi, riflessa nella dimensione delle ombre delle candele, in un i
FREE
Gina Dual TPO — Brief MQL5 indicator TPO + Volume profile overlaid on chart — fast, scalable, and beginner-friendly. Built for traders who read market structure by POC and Value Area. What it is An MQL5 indicator that overlays dual market profiles—Time-at-Price (TPO) and Volume-at-Price (VPO)—directly on your chart. It’s fast (pixel-based drawing), scalable, and beginner-friendly. Who it’s for Intraday and swing traders who read market structure via POC (Point of Control) and Value Area to spot
FREE
SuperGridder
Jere Katainen
4.71 (7)
This utility allows creating any amount of grid orders just by  clicking with the mouse.  Instructions: Trading mode Deleting mode Press ctrl and click with mouse to start drawing a grid While drawing, press shift to cancel Release buttons to send orders Press shift and click with mouse to draw a removal line Release buttons to   confirm removal: EA deletes every pending order that the line touches Inputs: - 3 options to calculate the grid sizing: Fixed points distance between grid level
FREE
Shows various helpful informations lik: ATR (in Pips) Spread  (in Pips) Spread in percent of ATR (very helpful when your SL/TP is based on ATR Time left to next candle period Change in percent of last X candles (configurable) Spread warning, when its higher then 1/3 of the ATR Next-candle warning, when it appears shortly (2.5% of period) Please follow me on Twitter https://twitter.com/semager and stay up to date with the newest Indicators and EAs.
FREE
Instant Close All Charts
Sivakumar Paul Suyambu
️ Instant Close All Charts – MT5 Utility Script One-Click Solution to Instantly Close Every Chart Window in MetaTrader 5 Managing too many open chart windows in MetaTrader 5 can slow down your platform, clutter your workspace, and reduce productivity. Instant Close All Charts is a lightweight, ultra-fast MT5 utility script designed to close all open chart windows with a single click — clean, safe, and efficient. Live Signals & Products Whether you're a trader working with dozens of charts or a
FREE
Exp Assistant 5
Vladislav Andruschenko
4.77 (122)
Impostazione automatica, stop loss, take profit, trailing stop, livelli di pareggio, attivazione di stop loss e take profit   virtuali   . Exp Assistant   ti aiuterà a organizzare il mantenimento delle tue posizioni. Questo programma, l'Expert Advisor, è progettato per impostare automaticamente il   Reale o il Virtuale       Livelli   di Stop Loss e Take Profit   per le tue posizioni durante il trading. Puoi gestire facilmente tutte le operazioni dell'Expert Advisor dal pannello di controllo sul
FREE
MultiFrame Volume Trend (MFVI) is a powerful VWAP-based indicator that displays volume trends across multiple timeframes in a clean, easy-to-read dashboard directly on your chart. Instantly capture the overall market direction in just seconds. Features Multi-timeframe VWAP analysis from M1 to MN1. Dashboard panel shows the trend state of each timeframe at a glance. Plots VWAP line and buy/sell arrows directly on the chart. Fully customizable: colors, line width, panel position, arrow symbols. Bu
FREE
Indicador Monte Carlo Simulation Indicador faz uma regressão linear nos preços de fechamento do ativo escolhido e gera uma simulação de Monte Carlo de N preços aleatórios para definir 3 níveis de sobrecompra e 3 níveis de sobrevenda. O primeiro processo é a Regressão Linear dos preços de fechamento do ativo, no qual é regido pela equação: Y = aX + b + R Onde   Y   é o valor do ativo escolhido,  X   é o tempo,   a   é a inclinação da reta,   b   é a intersecção da reta e   R   é o resíduo. O resí
FREE
Morwa Symbols
Michael Mafate Mogajane
Smart Watermark Displays current symbol + timeframe Shows account name (or custom text) Customizable font/color/position One-Click Tools Timeframe Switcher:   Quick-access buttons (M1 to D1) Drawing Tools:   Create horizontal lines, trendlines, and Fibonacci retracements with consistent sizing Object Cleanup:   "Delete" button removes all indicator-created drawings Pips Meter Real-time P/L tracking in pips Color-coded (green/red) for profit/loss Supports magic number filtering Chart Zoom Contro
FREE
This is a decorative utility that replaces the standard marks of completed deals with "Kingdom Come: Deliverance" game style markers. In addition to the graphic display of the price and time of the transaction, the notes also contain a textual representation of the transaction volume. Running utility Drag the utility from the Navigator window to the desired graph. The utility does not use input parameters and does not require configuration. All trademarks available on the chart will be replaced
FREE
Correlation for SH
Vladimir Khlystov
Script for quickly selecting a tool with high correlation. The script is placed on the tool to which you need to select the second correlating one. Then you can change the number of bars to calculate and the timeframe. The script iterates through all available symbols in the market overview and returns the 20 most correlated ones. You can use the selected pairs to trade with THE new SH expert Advisor
FREE
Auto Midas VWAP
Paulo Henrique Faquineli Garcia
AUTO MIDAS VWAP Volume Weighted Average Price (VWAP) is a trading benchmark commonly used by Big Players that gives the average price a Symbol has traded throughout the day. It is based on both Volume and price. Commonly, MIDAS VWAP damand you to determine the initial point of analysis. This indicator plots automatically based on ZigZag Approach. You will be able to use up to 3 HIGH MIDAS VWAP's and 3 LOW MIDAS VWAP's. Wish the best trade results!!
MultiTradeNews
Leeank Andres Fernandez Molano
This script is designed for traders who need to quickly place trades across multiple currency pairs during critical news releases, where every second counts. With this tool, you can pre-select your desired currency pairs and assign independent volumes for each one. When a major news event hits, such as Non-Farm Payroll (NFP) or PMI data releases, the script allows you to execute all your trades instantly without the need to open each pair manually. Key Features: Customizable Pairs : Choose from
FREE
Know the Candle Close Time
Benbyaanda Silvere Henri Sedric Kabore
This indicator allows to know the remaining time before the closing of the candle. It works on every timeframe. It is very usefull when your trading strategy depend of the close or the open of a specific candle. So use it like you want. Don't forget to leave a comment or a request for a EA or an indicator. Also spread it to your friends and don't hesitate to visit my profile to see others tools.
FREE
Draw and Sync Objects
Nguyen Thanh Sang
5 (7)
Draw and Sync Objects Multiple Charts 1. Draw objects by key press. ( You must: 1.  Press Function key => 2. Click where you want to draw => 3. Draw it => 4. Press ESC to complete). (If you don't want to draw after pressing function key, you must press ESC to cancel). 2. Developing  : Sync selected objects to multiple charts by button. 3. Developing: Hide objects that do not belong to the current symbol (Objects drawn with this indicator will belong to the symbol they are plotted on. When your c
FREE
Quick Style MT5
Maxim Polishchuk
4.73 (11)
The Quick Style utility is designed for facilitation and acceleration of working with the properties of graphical objects. Left-click a graphical object while holding the Shift key to open the quick access window for configuring the object properties. In the window, you can change the color, style and line width with one click, including those of other graphical objects. All changes are displayed immediately. To close the Quick Style , simply click the free space on the chart. The utility is eas
FREE
Phone Trade Manager
Krutik Piyushkumar Parekh
Smart Lot-Size Calculator And Trade Assistant for Mobile Trading Overview: This is the tool every trader in the market must have no matter if you are scalper, swing traders, day trader, or long term trader. This On-The-Go trading tool will help you stay disciplined and also stay free from daily trade management chores, Most traders face common problems like   1. Calculation of proper lot-size of a position to take controlled risk  2. Managing every trade and trailing stop-loss if trades goes in
FREE
ConfluenceHunter
Ivanvielle Bonifacio Dupaya
ConfluenceHunter helps you detect confluences on the chart. Determine the market structure, find the best price, helps you calculate lots and trade levels, displays price data  ALL IN ONE GLANCE! It saves you time doing MTF (Multi-timeframe) Analysis. ConfluenceHunter does it for you! All that's left for you to do is to take that trade and take your profits!
FREE
Moving average indicator to work with the F12 Replay simulation and replay tool. In this way, the F12 Replay tool now supports the moving average indicator. F12 Replay:   https://www.mql5.com/pt/market/product/38313 This is a product developed by Renato Fiche Junior and available to all MetaTrader 5 users! Partners: "Águia Traders"  team ( Eagle Traders ) by  Larissa Sihle  #aguiatraders #larissasihle Input Parameters Period Shift Method
FREE
Monthly Weekly Open Lines
Aurthur Musendame
5 (5)
The Monthly Weekly Open Line is an indicator that plots: The current month open line that will extend till the last week on the month. Weekly lines that span the look back days period that you have set . Each line will extend from the respective weekly Monday zero GMT till friday of the respective week. Monthly and Weekly open lines can be used to build very powerfull anc consistent trading strategies. They act as natural S/R price barriers.
FREE
Breakeven Bot
Gabriel Paul Ange Perrin
Optimize your trading management with Breakeven Bot, the essential tool for active traders managing multiple positions at once. No more wasting time manually adjusting your stops—one click is all it takes to secure your profits! Main Feature: ️ "BREAKEVEN" Button – Instantly set all profitable positions to breakeven and protect your gains quickly. ️ Customization Options: Set breakeven in pips or currency, depending on your preference. Choose whether breakeven should be at the entr
FREE
Script for Metatrader 5. One click to Delete the background grid and object, all objects on the chart such as Trend lines you have drawn or created by another program arrows text Fibonacci lines removes the background grid making a clearer clean chart horizontal and vertical lines Easy for clearing a chart or when opening new charts. Please leave a review on how its working.
FREE
Trade Table EP
Shamil Mamalov
Questa utilità di trading è una soluzione universale per trader attivi, che permette di semplificare e automatizzare al massimo il processo di lavoro sul grafico. Le sue funzionalità chiave includono: Impostazione preventiva di TP e SL: Prima di posizionare un’operazione sul grafico, è possibile impostare in anticipo i parametri di Take Profit e Stop Loss. Ciò consente di determinare anticipatamente i livelli di uscita dalla posizione e di proteggere il capitale dai movimenti imprevisti del mer
FREE
Gli utenti di questo prodotto hanno anche acquistato
ARIPoint
Temirlan Kdyrkhan
1 (1)
ARIPoint is a powerful trading companion designed to generate high-probability entry signals with dynamic TP/SL/DP levels based on volatility. Built-in performance tracking shows win/loss stats, PP1/PP2 hits, and success rates all updated live. Key Features: Buy/Sell signals with adaptive volatility bands Real-time TP/SL/DP levels based on ATR Built-in MA Filter with optional ATR/StdDev volatility Performance stats panel (Success, Profit/Loss, PP1/PP2) Alerts via popup, sound, push, or email Cu
Ottieni l’indicatore AUX GRATUITO e il supporto EA Download diretto — Clicca qui [ D.I.C.E ] The DICE Indicator  Divergence in Chaos Environment è uno strumento MT5 specializzato per trader che applicano la Teoria delle Onde di Elliott nel contesto delle tecniche di Trading Chaos. Identifica divergenze nascoste e regolari nell’azione dei prezzi, sincronizzate con l’ambiente di mercato caotico descritto da Bill Williams. Caratteristiche principali Divergenza allineata alle Onde di Elliott: rilev
ARICoins
Temirlan Kdyrkhan
ARICoin is a powerful trading companion designed to generate high-probability entry signals with dynamic TP/SL/DP levels based on volatility. Built-in performance tracking shows win/loss stats, PP1/PP2 hits, and success rates all updated live. Key Features: Buy/Sell signals with adaptive volatility bands Real-time TP/SL/DP levels based on ATR Built-in MA Filter with optional ATR/StdDev volatility Performance stats panel (Success, Profit/Loss, PP1/PP2) Alerts via popup, sound, push, or email Cust
ARIScalping
Temirlan Kdyrkhan
ARIScalp is a powerful trading companion designed to generate high-probability entry signals with dynamic TP/SL/DP levels based on volatility. Built-in performance tracking shows win/loss stats, PP1/PP2 hits, and success rates all updated live. Key Features: Buy/Sell signals with adaptive volatility bands Real-time TP/SL/DP levels based on ATR Built-in MA Filter with optional ATR/StdDev volatility Performance stats panel (Success, Profit/Loss, PP1/PP2) Alerts via popup, sound, push, or email Cus
AriX
Temirlan Kdyrkhan
1 (4)
AriX Indicator for MT5 A powerful trend-following and signal-evaluation tool AriX is a custom MT5 indicator that combines Moving Averages and ATR-based risk/reward logic to generate clear buy/sell signals. It visualizes dynamic SL/TP levels, evaluates past trade outcomes, and displays win/loss statistics in a clean on-chart panel. Key features include: Buy/Sell signals based on MA crossovers ATR-based SL/TP1/TP2/TP3 levels with visual lines and labels Signal outcome tracking with real-time stat
Rtc ML Ai Predictor
Muhammad Faisal Sagala
Rtc ML Ai | Predictor CORE MACHINE LEARNING ENGINE Adaptive ML Market Predictor – Multi-Bar Trend & Candle Forecast What This Indicator Does This indicator is a  real-time market prediction engine  designed to analyze price behavior and estimate  future market tendencies . Unlike conventional indicators, this system  does not rely on static parameters or historical curve-fitting , but adapts its internal state dynamically during live market operation. Instead of using static rules, the indic
IVISTscalp5
Vadym Zhukovskyi
5 (6)
What's new about iVISTscalp5 forecast indicator (Version 10)? iVISTscalp5 is a unique nonlinear forecasting for a week ahead system for any financial instrument which executes fast scalping using time levels. iVISTscalp5 is a tool for easy study and understanding of financial market. 1) iVISTscalp5 forecast indicator has been completely rewritten into another programming language (C++), which has accelerated data loading and processing. As a result, a different graphical display of forecasts
TrendMaestro5
Stefano Frisetti
Attenzione alle truffe, questo indicatore e' distribuito esclusivamente su MQL5.com nota: questo indicatore e' per METATRADER5, se vuoi la versione per  METATRADER4 questo e' il link:   https://www.mql5.com/it/market/product/108106 TRENDMAESTRO ver 2.5 TRENDMAESTRO   riconosce un nuovo TREND sul nascere, non sbaglia mai. La sicurezza di identificare un nuovo TREND non ha prezzo. DESCRIZIONE TRENDMAESTRO identifica un nuovo TREND sul nascere, questo indicatore prende in esame la volatilita' i
VTrende Pro
Andrii Diachenko
5 (1)
VTrende Pro - MTF indicator for trend trading with a display panel for MT5 *** Videos can be translated into any language using subtitles (video language - Russian) Although the signals of the VTrende Pro indicator can be used as signals of a full-fledged trading system, it is recommended to use them in conjunction with the Bill Williams TS. VTrende Pro is an extended version of the VTrende indicator. Difference between Pro version and VTrende: - Time zones - Signal V - signal 1-2 waves -    S
FXLAND Smart Reversal Indicator (MT5) FXLAND Smart Reversal Indicator is a professional technical analysis tool designed to help traders identify potential price reversal zones and key market turning points with clarity and precision. The best reversal indicator and price return by choosing only one ceiling or floor in each time frame A masterpiece of combining mathematics and Gann, fractal matrix, Fibonacci, movement angle and time. Completely intelligent Key Features Detects potenti
Pantera Indicator
Temirlan Kdyrkhan
5 (1)
A tool for on-chart strategy backtesting and performance analysis. A utility for developing, debugging, and testing custom trading ideas and indicator functions. An indicator designed to quickly test trading concepts and visualize the effectiveness of different input parameters. An all-in-one sandbox for testing everything from simple crossovers to complex, multi-condition trading systems.
WanaScalper
Isaac Wanasolo
1 (1)
A scalping indicator based on mathematical patterns, which on average gives signals with relatively small SL, and also occasionally helps to catch big moves in the markets (more information in the video) This indicator has three main types of notifications: The first type warns of a possible/upcoming signal on the next bar The second type indicates the presence of a ready signal to enter the market/open a position The third type is for SL and TP levels - you will be notified every time price re
##   ONLY GOLD ##   Тiльки Золото ## **Mercaria Professional Trading Zones - Complete Guide** ## **Mercaria Professional Trading Zones - Повний посібник** ### **How Mercaria Zones Work / Як працюють зони Mercaria** **English:** Mercaria Zones is an advanced trading indicator that identifies high-probability support and resistance areas using ZigZag extremes combined with mathematical zone calculations. The indicator works on multiple timeframes simultaneously, providing a comprehensive view
Enigma 112
issam rahhal sabour
Enigma 112 Indicator - User Manual Enigma 112 Indicator Complete User Manual - Ultimate Trading Solution Introduction The Enigma 112 is a comprehensive multi-timeframe trading indicator that combines advanced technical analysis concepts including Tesla 3-6-9 Gates, Huddleston Theory, PO3 Dealing Ranges, and sophisticated risk management systems. Tesla 3-6-9 Gates Based on Nikola Tesla's vortex mathematics for precise support and resistance levels Huddleston Theory Volume-based market
The Expert Advisor and the video are attached in the Discussion tab . The robot applies only one order and strictly follows the signals to evaluate the indicator efficiency. Pan PrizMA CD Phase is an option based on the Pan PrizMA indicator. Details (in Russian). Averaging by a quadric-quartic polynomial increases the smoothness of lines, adds momentum and rhythm. Extrapolation by the sinusoid function near a constant allows adjusting the delay or lead of signals. The value of the phase - wave s
Классификатор силы тренда. Показания на истории не меняет. Изменяется классификация только незакрытого бара. По идее подобен полной системе ASCTrend, сигнальный модуль которой, точнее его аппроксимация в несколько "урезанном" виде, есть в свободном доступе, а также в терминале как сигнальный индикатор SilverTrend . Точной копией системы ASCTrend не является. Работает на всех инструментах и всех временных диапазонах. Индикатор использует несколько некоррелируемых между собой алгоритмов для класси
FFx Universal Strength Meter PRO is more than a basic strength meter. Instead of limiting the calculation to price, it can be based on any of the 19 integrated strength modes + 9 timeframes. With the FFx USM, you are able to define any period for any combination of timeframes. For example, you can set the dashboard for the last 10 candles for M15-H1-H4… Full flexibility! Very easy to interpret... It gives a great idea about which currency is weak and which is strong, so you can find the best pai
The FFx Universal MTF alerter shows on a single chart all the timeframes (M1 to Monthly) with their own status for the chosen indicator. 9 indicators mode (MACD-RSI-Stochastic-MA-ADX-Ichimoku-Candles-CCI-PSAR). Each can be applied multiple times on the same chart with different settings. Very easy to interpret. Confirm your BUY entries when most of the timeframes are showing green color. And confirm your SELL entries when most of the timeframes are showing red color. 2 Alert Options : input to s
The FFx Watcher PRO is a dashboard displaying on a single chart the current direction of up to 15 standard indicators and up to 21 timeframes. It has 2 different modes: Watcher mode: Multi Indicators User is able to select up to 15 indicators to be displayed User is able to select up to 21 timeframes to be displayed Watcher mode: Multi Pairs User is able to select any number of pairs/symbols User is able to select up to 21 timeframes to be displayed This mode uses one of the standard indicators
FFx Patterns Alerter gives trade suggestions with Entry, Target 1, Target 2 and StopLoss .... for any of the selected patterns (PinBar, Engulfing, InsideBar, OutsideBar) Below are the different options available: Multiple instances can be applied on the same chart to monitor different patterns Entry suggestion - pips to be added over the break for the entry 3 different options to calculate the SL - by pips, by ATR multiplier or at the pattern High/Low 3 different options to calculate the 2 TPs -
MetaTrader 4 version available here : https://www.mql5.com/en/market/product/24881 FFx Basket Scanner is a global tool scanning all pairs and all timeframes over up to five indicators among the 16 available. You will clearly see which currencies to avoid trading and which ones to focus on. Once a currency goes into an extreme zone (e.g. 20/80%), you can trade the whole basket with great confidence. Another way to use it is to look at two currencies (weak vs strong) to find the best single pairs
MetaTrader 4 version available here: https://www.mql5.com/en/market/product/25793 FFx Pivot SR Suite PRO is a complete suite for support and resistance levels. Support and Resistance are the most used levels in all kinds of trading. Can be used to find reversal trend, to set targets and stop, etc. The indicator is fully flexible directly from the chart 4 periods to choose for the calculation: 4Hours, Daily, Weekly and Monthly 4 formulas to choose for the calculation: Classic, Camarilla, Fibonac
ClassicSBA
Umri Azkia Zulkarnaen
this indicator very simple and easy if you understand and agree with setup and rule basic teknical sba you can cek in link : please cek my youtube channel for detail chanel : an for detail info  contact me  basicly setup buy (long) for this indicator is Magenta- blue and green candle or magenta - green  and green candlestik and for setup sell (short) is Black - yellow - and red candle or black - red  and red candlestik
Pendiente de Precio
Cesar Juan Flores Navarro
Indicador en base a la pendiente de la linea de precio, dibuja una línea de color cuando sube a base de los precios que previamente has sido procesados o linealizados, y cuando baja la pendiente la linea linealizada toma otro color. En este caso se a considerado 6 lineas de diferentes procesos desde pendientes largas hacia las cortas, observándose que cuando coincidan las pendientes se produce un máximo o mínimo, lo que a simple vista nos permitirá hacer una COMPRA O VENTA.
Индикатор Coefficient Of Determination (COD) представляет собой значение коэффициента детерминации или квадрат коэффициента корреляции между зависимой переменной — ценой и объясняющей переменной — тиковым объемом. Что это дает нам на практике? COD отлично распознает кульминацию трендовых движений, что позволяет подбирать оптимальные точки и ловить развороты рынка. Как использовать индикатор: Наиболее популярная торговая стратегия строится совместно с трендовым индикатором Moving Average (MA), пе
Fibonacci Multiple 12
Cesar Juan Flores Navarro
Fibonacci Múltiple 12, utiliza la serie fibonacci plasmado en el indicador fibonacci, aumentadolo 12 veces según su secuencia. El indicador fibonacci normalmente muestra una vez, el presente indicador se mostrara 12 veces empezando el numero que le indique siguiendo la secuencia. Se puede utilizar para ver la tendencia en periodos cortos y largos, de minutos a meses, solo aumentado el numero MULTIPLICA.
Recommended TimeFrame >= H1. 100% Non Repainted at any moment.  Use it carefully, only with Trend Direction. Trading Usage: 2 Variants: as Range System or as BreakOut System (Both Only With Trend Direction)::: (Always use StopLoss for minimise Risk); [1] as Range System: (Recommended) in UP TREND:  - BUY in Blue Line , then if price goes down by 50 points (on H1) open Second BUY.   Close in any Profit you wish: TrailingStop(45 points) or Close when Price touches upper Gold Line. in DOWN TREND
Linea Horizontal Inteligente
Cesar Juan Flores Navarro
En base a cálculos matemáticos de determino una linea Horizontal que cruza a todas las señales de trading, mostrando los máximos y mínimos. La linea horizontal parte en dos las subidas y bajadas de las señales de trading, de tan manera que es fácil identificar los máximos y mínimos, y es inteligente por que es sensible a las subidas y bajadas, afín de no quedarse en un solo lado por siempre, trabaja excelentemente con otros indicadores suavizadores ya que les garantiza que en un intervalo de tie
Spike Detector
Tete Adate Adjete
this indicator is a Spike detector indicator, it is specially designed to trade Boom 1000, Boom 500, Crash 1000 and Crash 500 We recommend using it on Deriv Boom and Crash indices only Its setting is intuitive, familiar, easy to use it has notification functions; audible notifications and push notifications. this tool is simple to use, easy to handle This update is based on different strategies for spikes
Limitless MT5
Dmitriy Kashevich
Limitless MT5 is a universal indicator suitable for every beginner and experienced trader. works on all currency pairs, cryptocurrencies, raw stocks Limitless MT5 - already configured and does not require additional configuration And now the main thing Why Limitless MT5? 1 complete lack of redrawing 2 two years of testing by the best specialists in trading 3 the accuracy of correct signals exceeds 80% 4 performed well in trading during news releases Trading rules 1 buy signal - the ap
Filtro:
Nessuna recensione
Rispondi alla recensione