KDJ Indicator MT4
- Indicators
- Eda Kaya
- Version: 1.3
KDJ Indicator for MetaTrader 4 Download
The KDJ Indicator is a refined evolution of the traditional Stochastic Oscillator.
By incorporating the J line alongside the classic K and D lines, this indicator delivers deeper insights into market momentum and price dynamics. Its primary function is to highlight potential reversal zones by identifying overbought and oversold market conditions—helping traders to determine optimal entry and exit points with higher precision.
«Indicator Installation & User Guide»
MT4 Indicator Installation | KDJ Indicator MT5 | ALL Products By TradingFinderLab | Best MT4 Indicator: Refined Order Block Indicator for MT4 | Best MT4 Utility: Trade Assistant Expert TF MT4 | TP & SL Tool: Risk Reward Ratio Calculator RRR MT4 | Money Management: Easy Trade Manager MT4 | Trade Copier: Free Fast Local Trade Copier MT4 | Money management + prop protector: Trade Assist Prop Protector MT4
KDJ Indicator Specifications
| Category | Price Action - Momentum - Oscillator |
| Platform | MetaTrader 4 |
| Skill Level | Intermediate |
| Indicator Type | Trend Reversal - Continuation |
| Timeframe | Multi-Timeframe |
| Trading Style | Day Trading |
| Market | Crypto - Forex - Stock Markets |
Overview of the Indicator
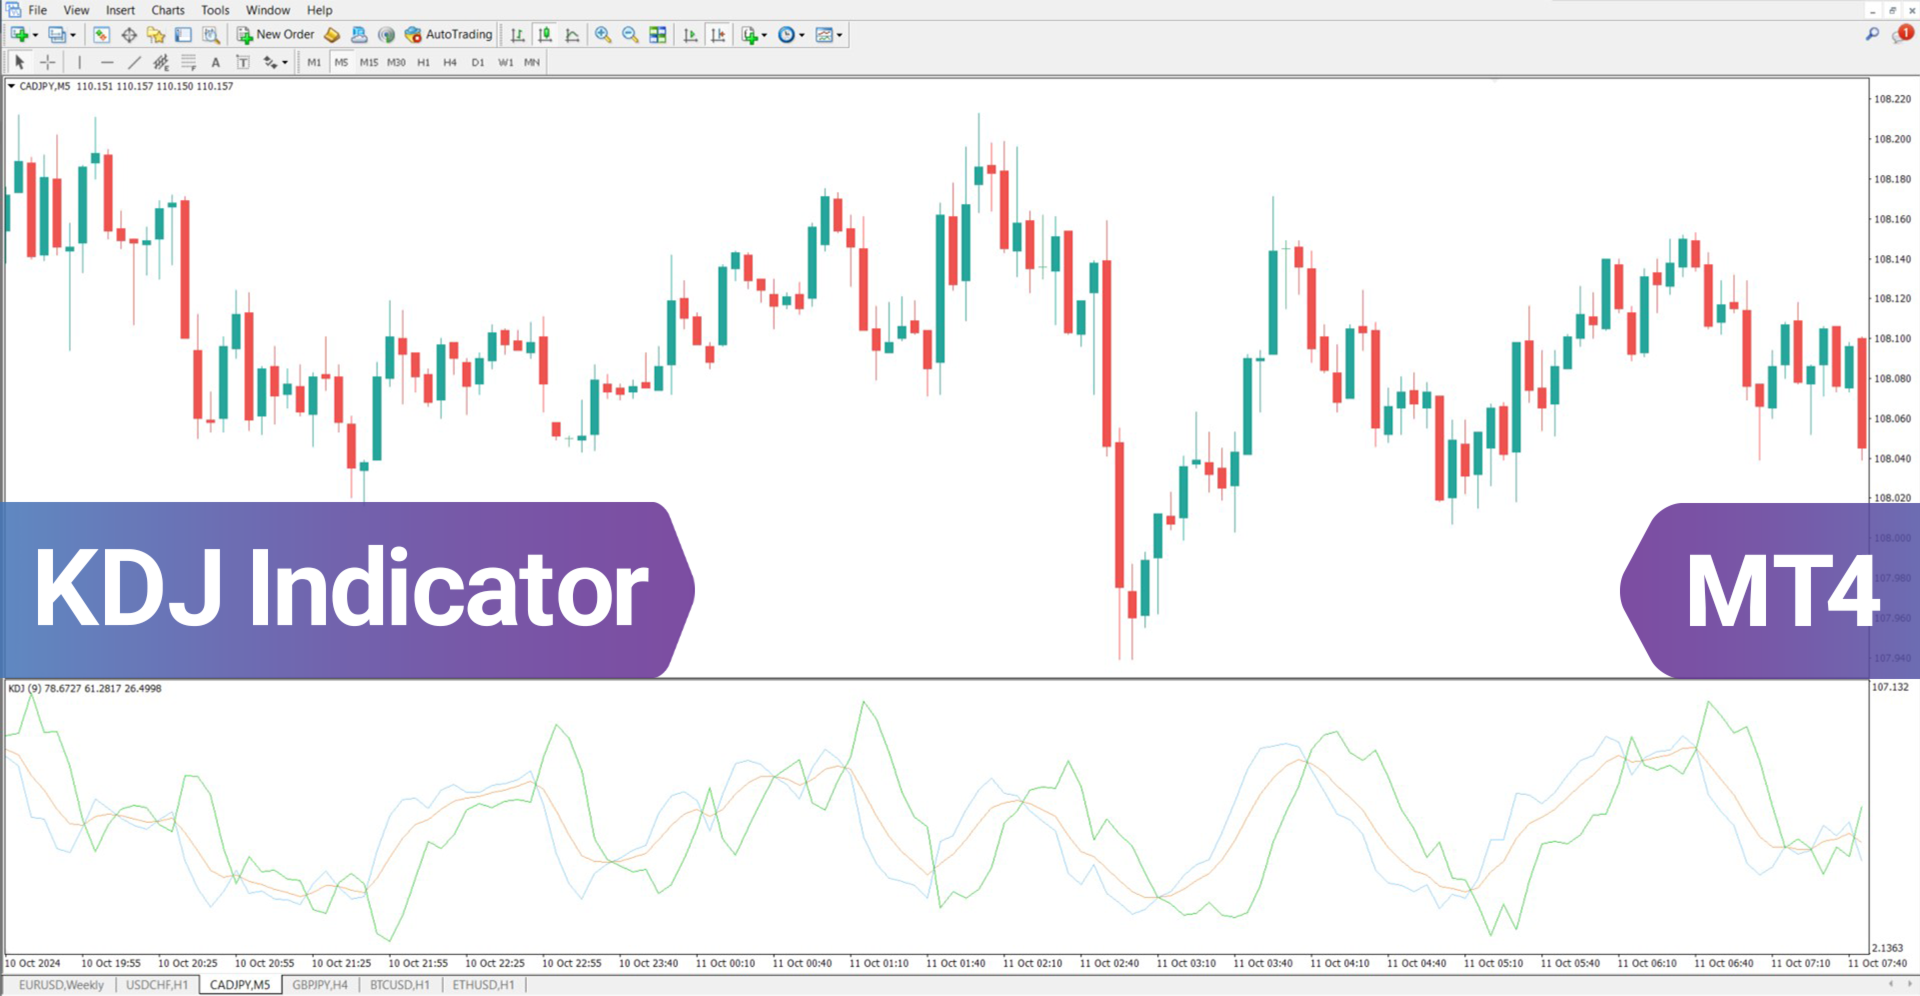
This indicator plots three lines—K, D, and J—each serving a specific analytical role. The K and D lines follow the structure of the classic stochastic oscillator, derived from historical price fluctuations across set periods. The J line, which distinguishes the KDJ from its predecessor, illustrates the divergence between K and D values, adding a sharper layer of interpretation.
This line appears green within the oscillator display.
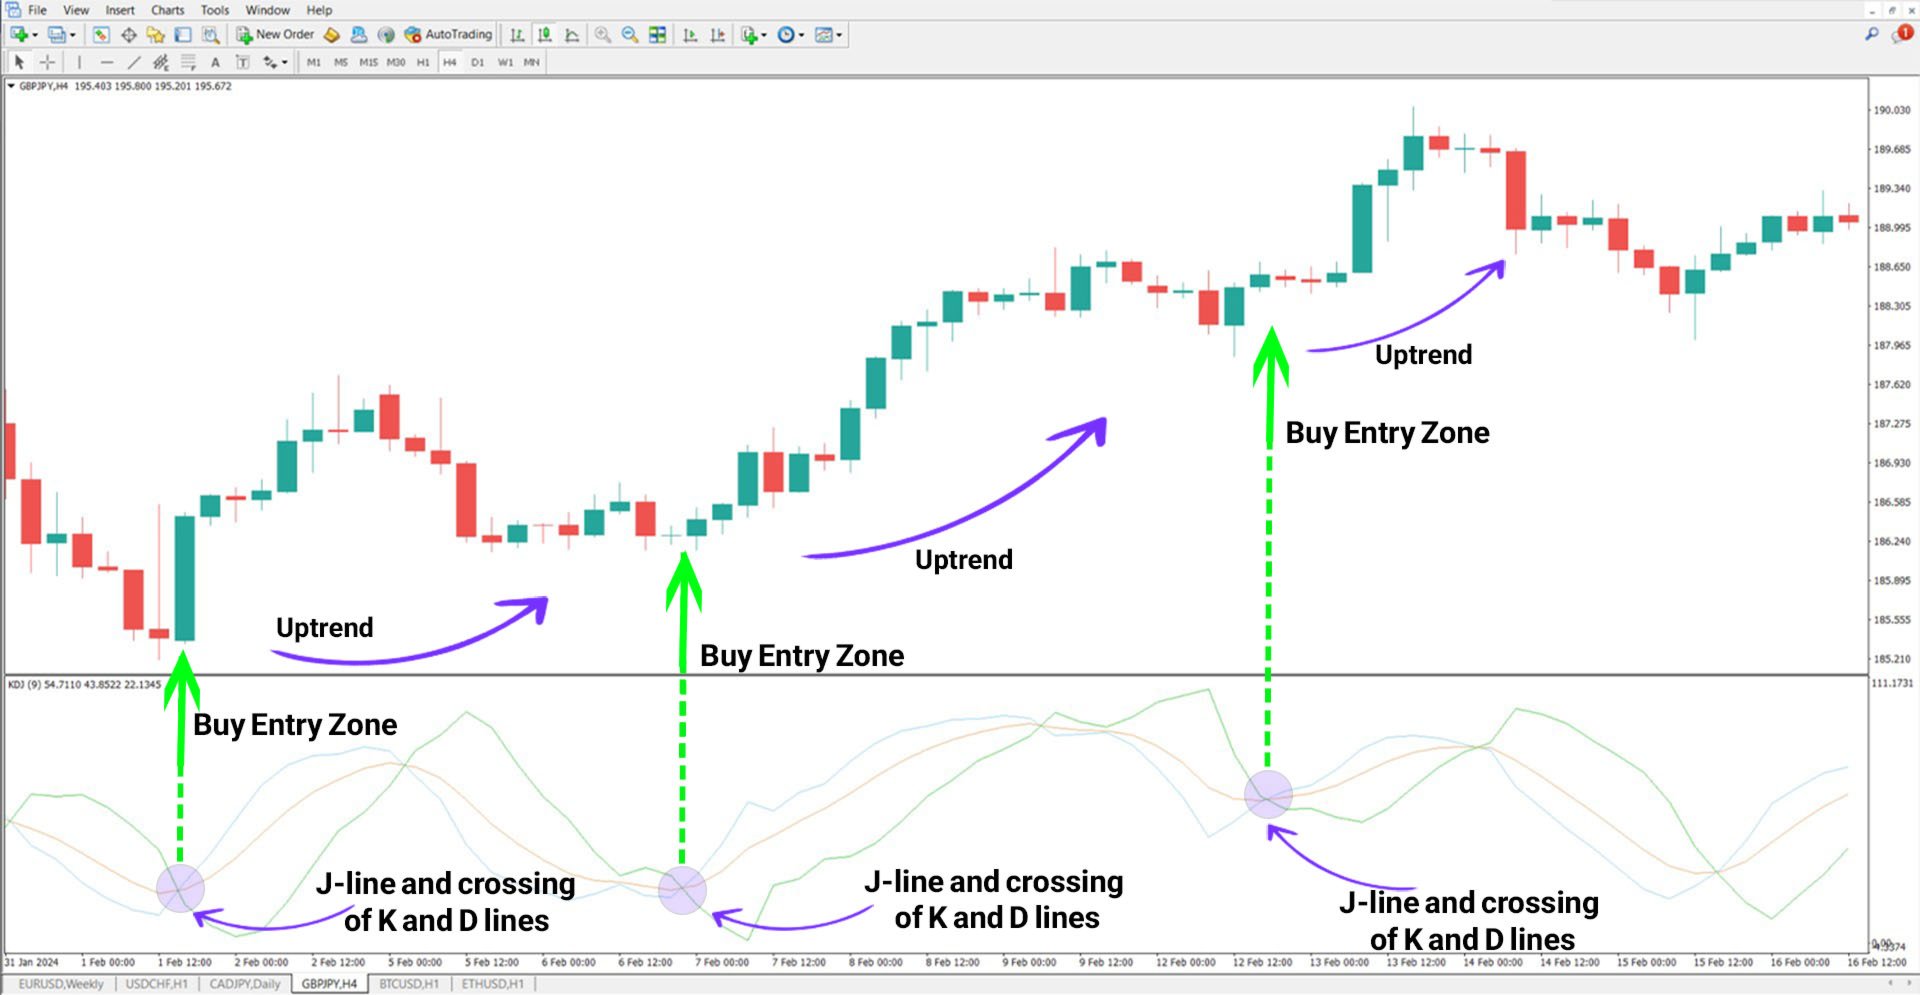
Bullish Signal Detection
Shown here is the GBP/JPY pair on a 4-hour chart. A bullish signal emerges when the green J line moves beneath both the K and D lines, suggesting that the asset is oversold. This configuration typically implies a potential upward reversal. Traders may use this signal in conjunction with price action validation to initiate a long position.
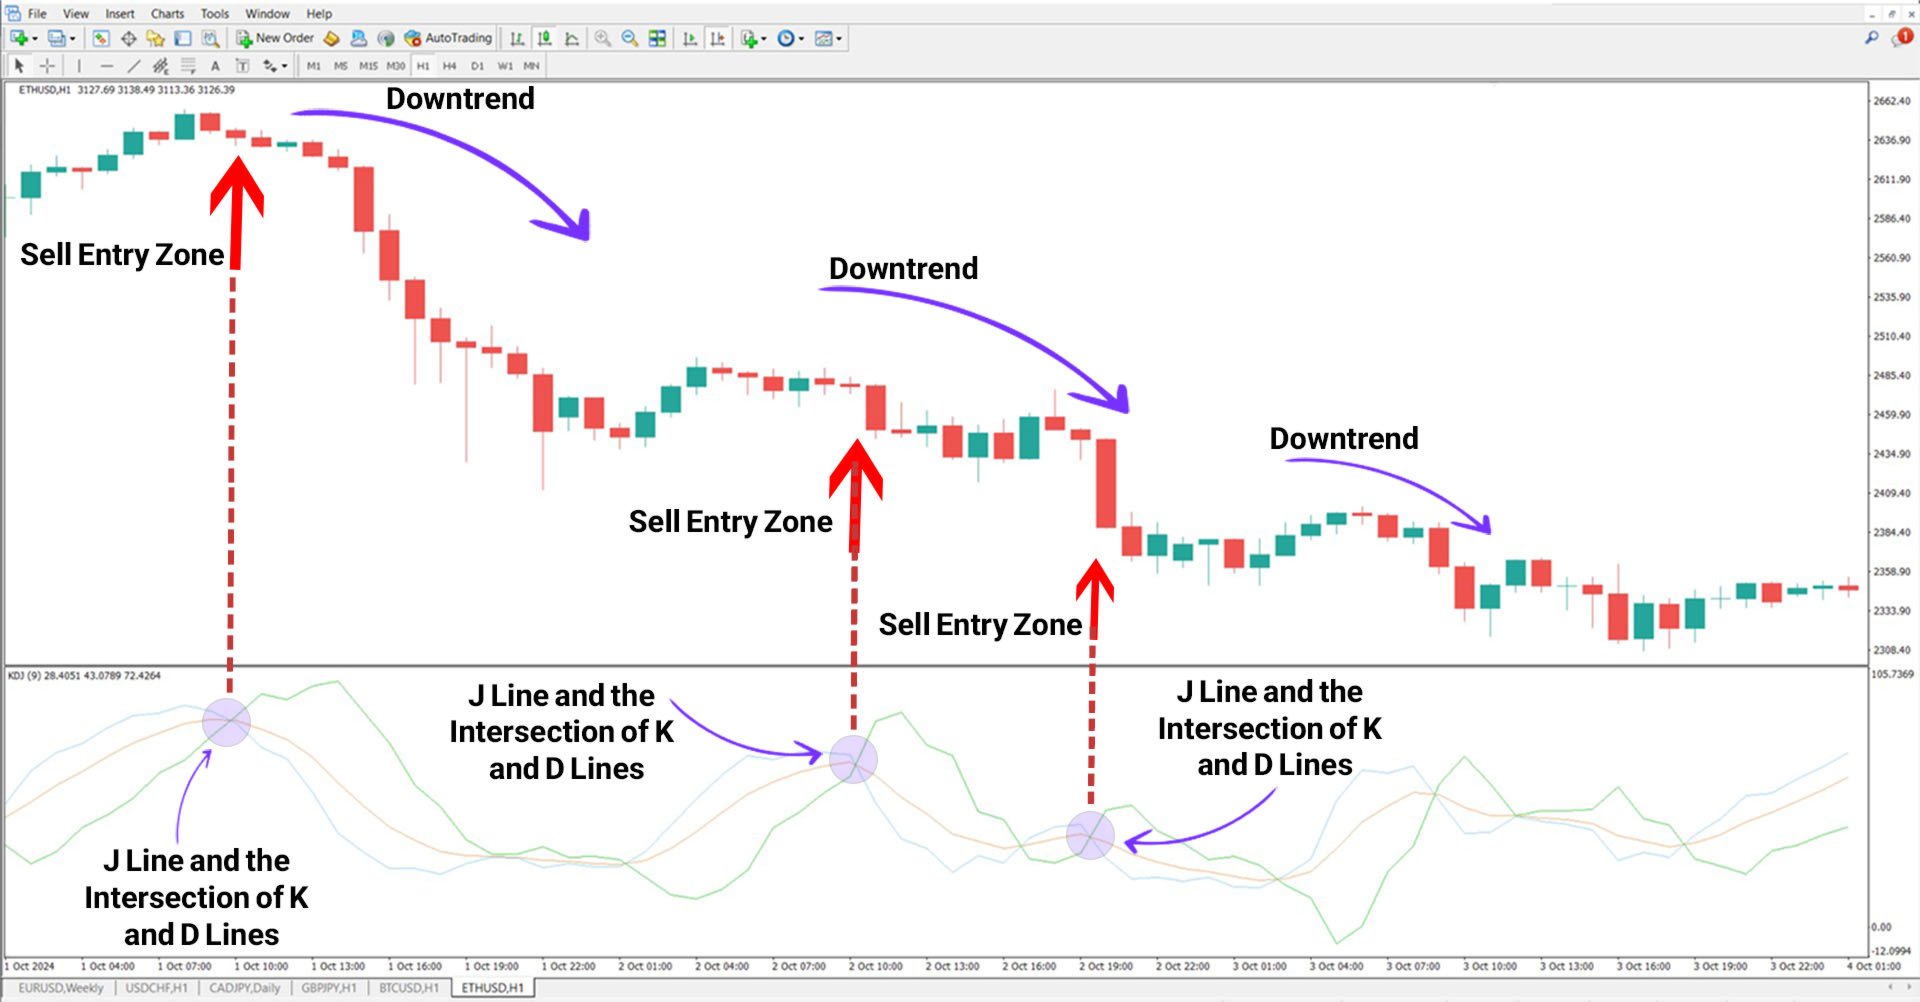
Bearish Signal Detection
On a 1-hour chart of Ethereum (ETH), the KDJ Indicator signals a bearish reversal when the J line crosses above the K and D lines. This scenario reveals a weakening in buying pressure and hints at the beginning of a downward trend. When supported by technical confirmations, traders may interpret this as an opportunity to enter a short position.
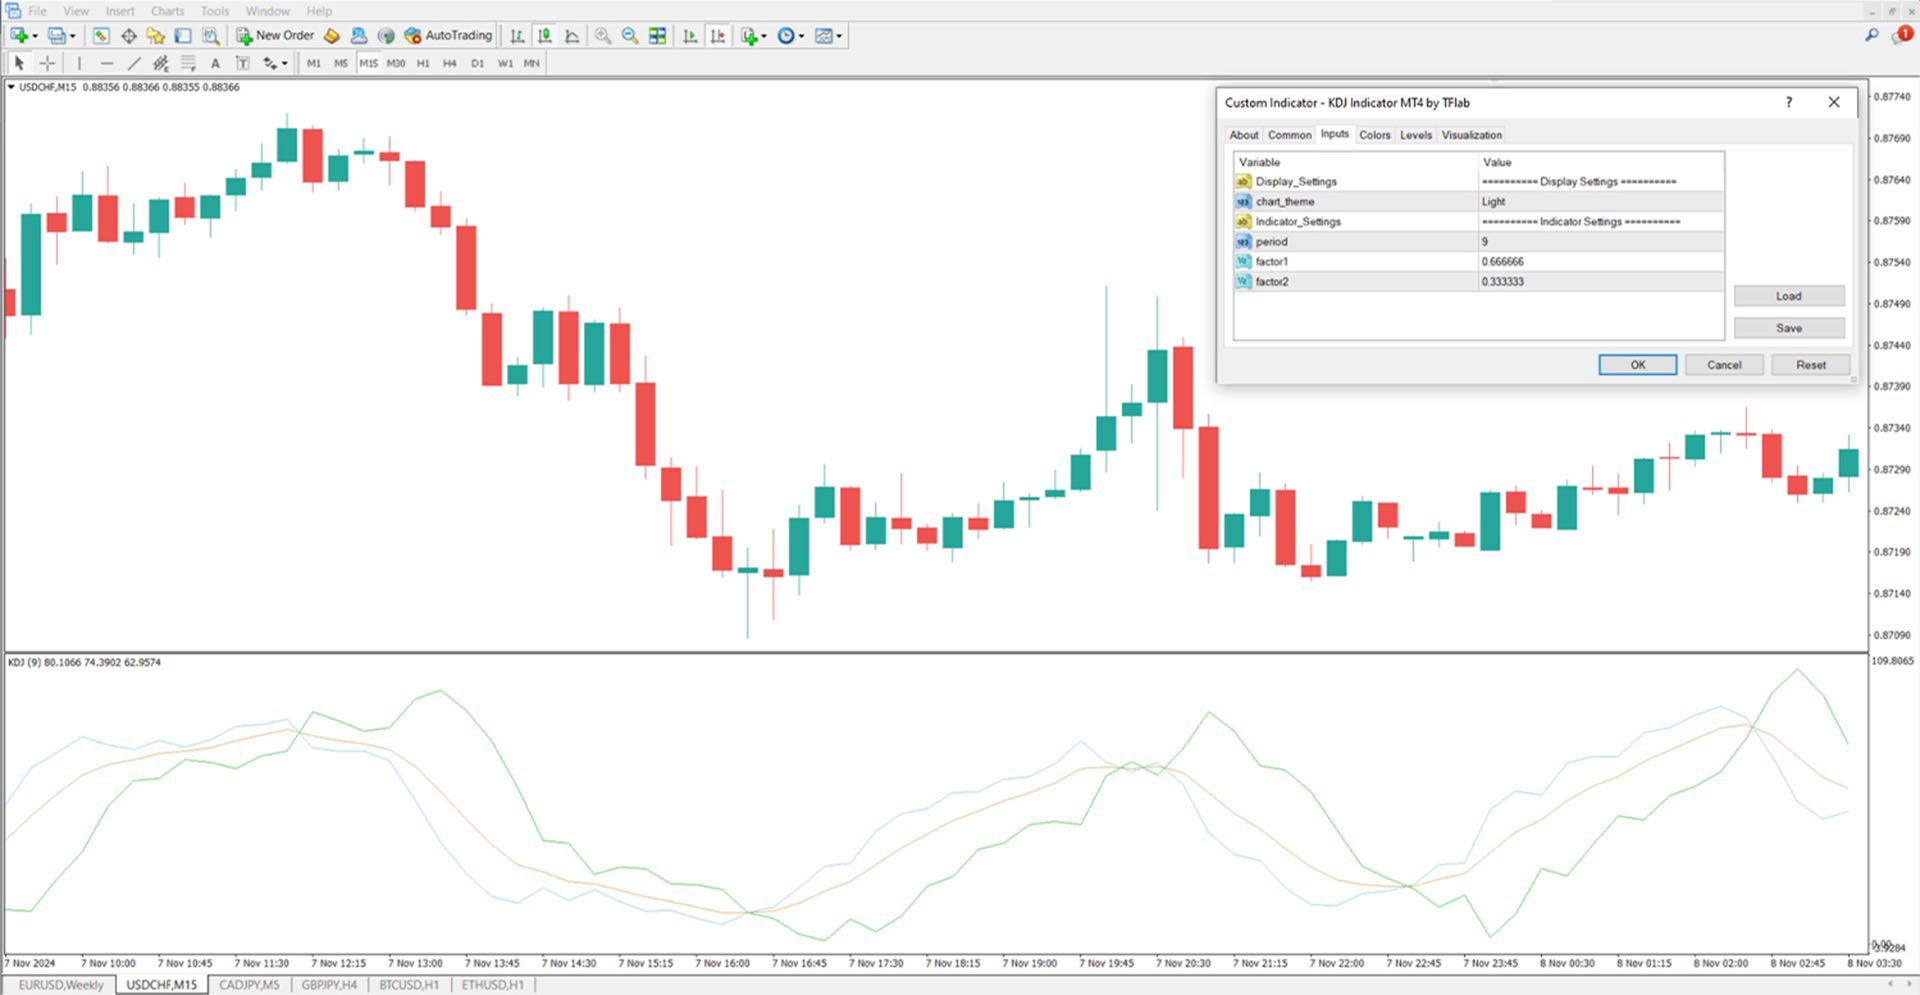
KDJ Indicator Settings
- Chart Theme: Controls the visual background of the chart
- Period: Defines the length of data used in calculations (default: 9)
- Factor1: Smoothing coefficient for initial calculation (default: 0.666666)
- Factor2: Secondary smoothing coefficient (default: 0.3333333)
Conclusion
The KDJ Indicator for MetaTrader 4 Download serves as a powerful upgrade to the standard stochastic approach, focusing on trend reversal and market condition analysis. By adjusting settings and combining the indicator with complementary tools like moving averages or key support/resistance zones, traders can significantly improve timing and accuracy in trade execution across different financial markets.