ExecutorCCI
- Indicators
- Ren Xiang Wang
- Version: 0.85
- Updated: 17 March 2025
Based on the CCI Trend-Following Principle, Improved to Identify Trend Reversals
This indicator is designed to confirm trends after identifying them using the ( Executor Trend Indicator ) indicator, making it a tool for both trend confirmation and reversal detection.
Features
-
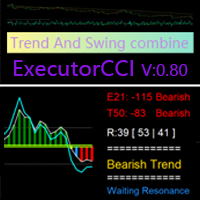
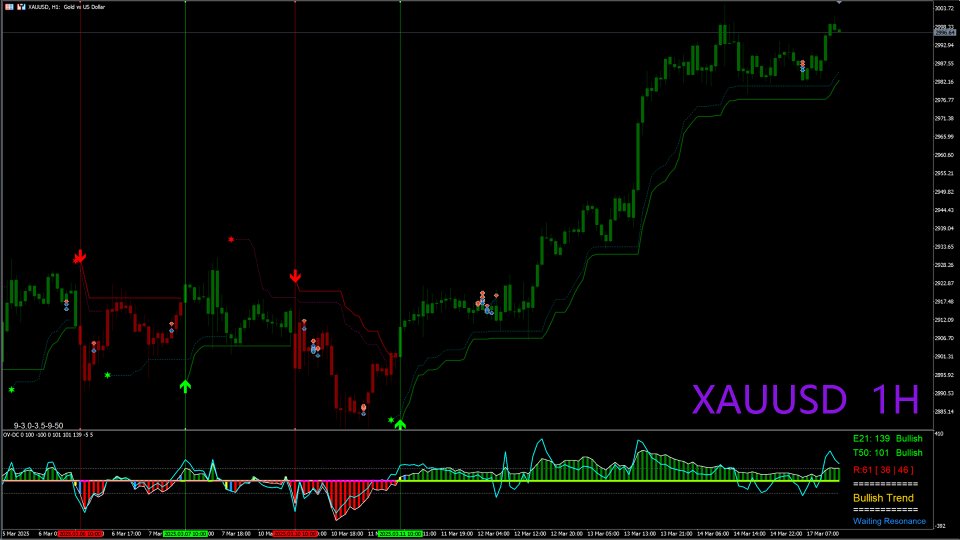
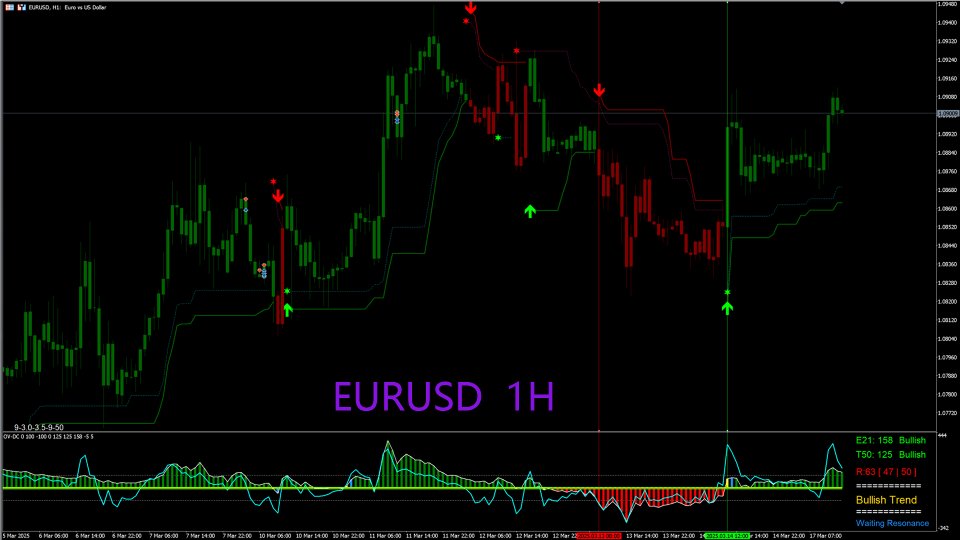
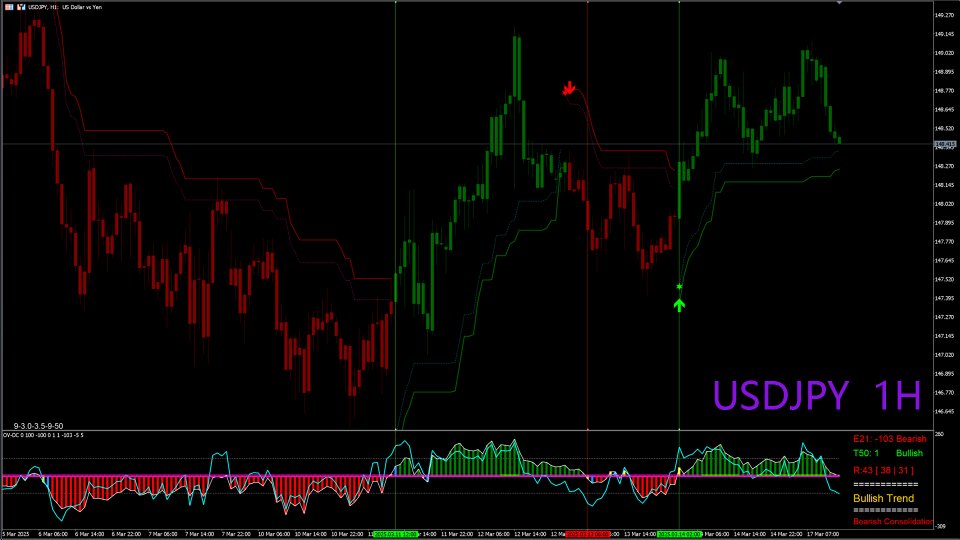
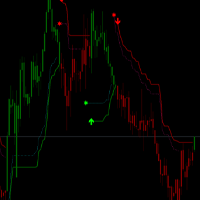
Green and Red Histogram: Represents the development of bullish (green) or bearish (red) trends in the current timeframe.
-
Blue Line and Green Histogram (Bullish Confirmation):
-
When the blue line rises above +100 and the green histogram crosses above the zero line, it confirms a bullish trend.
-
-
Blue Line and Red Histogram (Bearish Confirmation):
-
When the blue line falls below -100 and the red histogram crosses below the zero line, it confirms a bearish trend.
-
-
Right-Side Panel: Provides real-time numerical updates, indicating whether the current trend is rising or falling, and highlights potential entry zones.
Usage
-
For Trend Traders: Recommended for use on the 1-hour (1H) timeframe.
-
For Scalpers or Range Traders: Recommended for use on the 1-minute (1M) or 5-minute (5M) timeframes.
Combined Use
-
Use in conjunction with the ( Executor Trend Indicator ) indicator to confirm trend reversals.
-
During a bullish trend identified by ( Executor Trend Indicator ) , confirm if the ExecutorCCI green histogram crosses above the zero line.
-
During a bearish trend identified by ( Executor Trend Indicator ) , confirm if the ExecutorCCI red histogram crosses below the zero line.
-
This improved CCI-based indicator provides a clear visual representation of trend developments and reversals, making it a valuable tool for both trend-following and reversal trading strategies.







Can you help add push notifications to phone when it is +100 and - 100 That way it will make sense