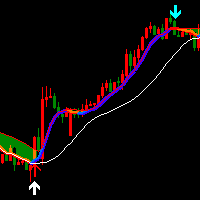
The First Red MT5

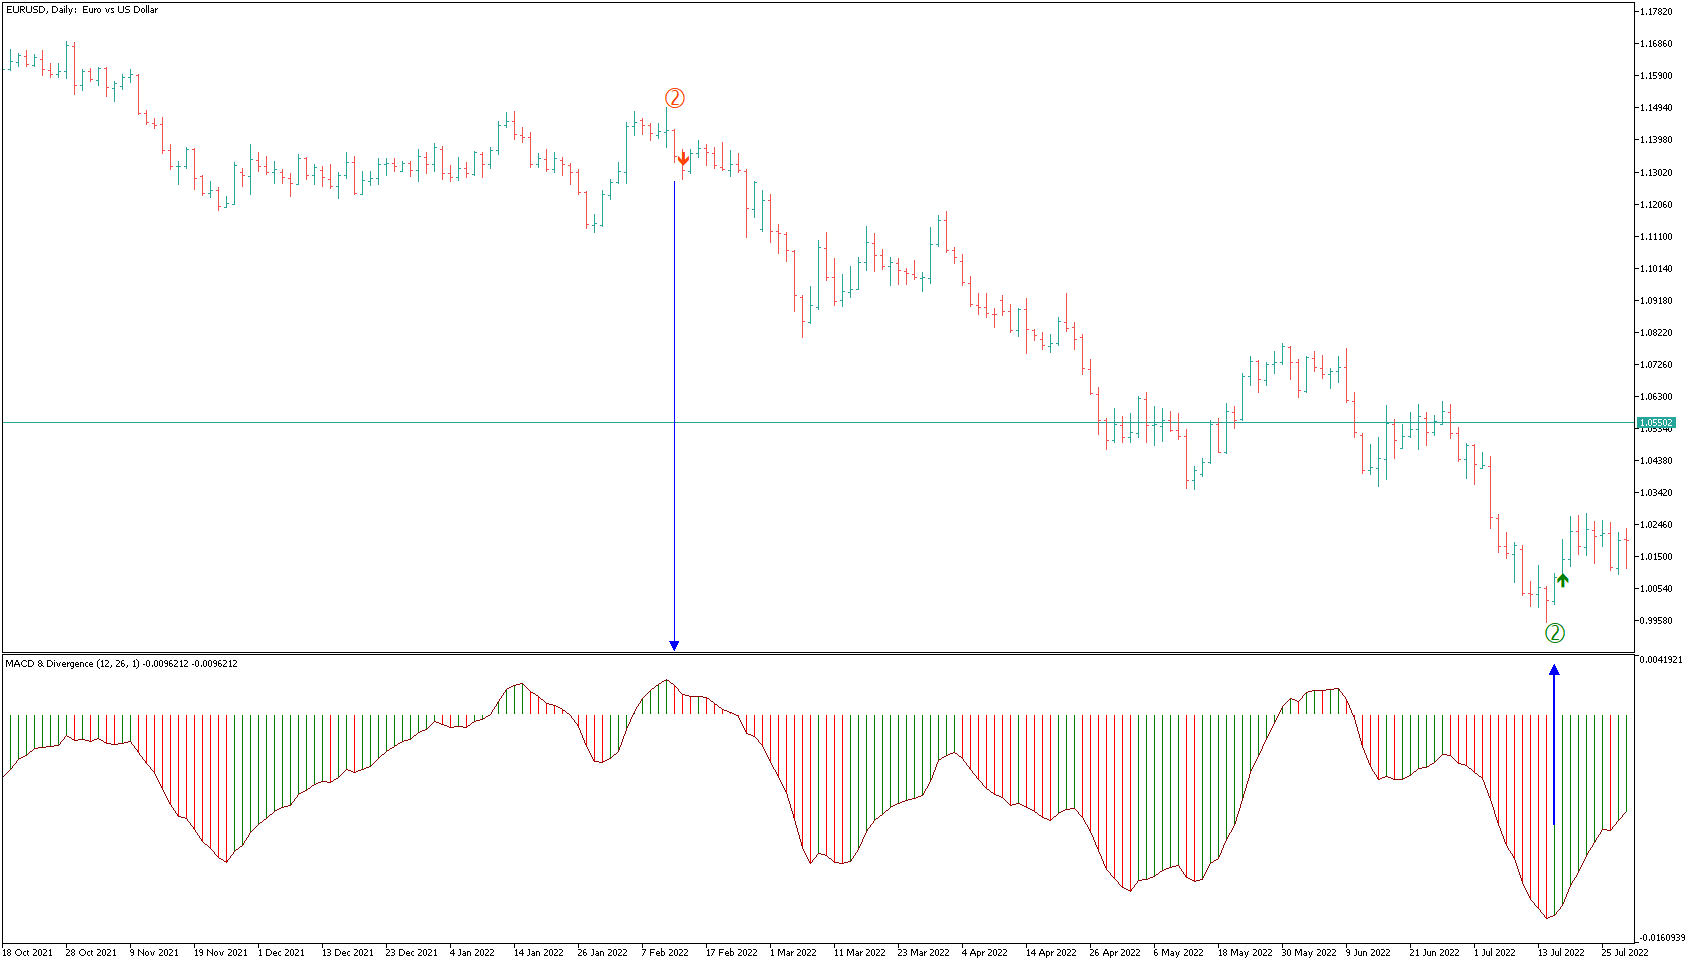
基于达里乌什·达戈(Dariusz Dargo)创建的策略,“The First Red”指标旨在识别并标记图表上符合“The First Red”策略及其扩展条件的蜡烛图,例如“Second Red”、“First Green”和“Second Green”。该策略主要分析局部极值和MACD振荡器的信号。

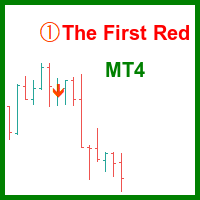
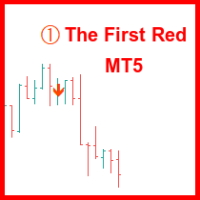
  • 第一根红色蜡烛(First Red Candle): 当蜡烛形成局部最高点且MACD直方图转向看跌时,将其标记为“First Red”。 图表符号:红色向下箭头位于蜡烛上方。

  • 第二根红色蜡烛(Second Red Candle): 紧随“First Red”之后的第二根看跌蜡烛,确认趋势方向的改变。 图表符号:红色数字“2”位于蜡烛上方。

  • 第一根绿色蜡烛(First Green Candle): 当蜡烛形成局部最低点且MACD直方图转向看涨时,将其标记为“First Green”。 图表符号:绿色向上箭头位于蜡烛下方。

  • 第二根绿色蜡烛(Second Green Candle): 紧随“First Green”之后的第二根看涨蜡烛,确认趋势方向的改变。 图表符号:绿色数字“2”位于蜡烛下方。

指标功能:

  • 在图表上直接标记蜡烛图。
  • 与MACD振荡器集成以精确识别动量变化。
  • 可自定义颜色和符号以便于解释。

用途: 此指标适用于寻求动态转折点和精确市场进入信号的交易者,可有效用于标准蜡烛图表和Range Bar图表。


推荐产品
Adaptive Trend Projection is a MetaTrader 5 indicator designed to help traders visualize the possible continuation of the current market structure. The indicator analyzes recent price behavior using two weighted regression windows: a longer lookback to understand the broader direction and a shorter lookback to capture the most recent movement. It then combines trend slope, recent acceleration, volatility, and ATR-based limits to draw a forward projection for the next candles. The central project
SMC Workflow Auto EA
Choawana Malaikitsanachalee
English – Product Description (V1.42) SMC Workflow Auto EA — SR / OB / FVG with BOS–CHOCH Confirmation Smart-Money-Concepts Expert Advisor that trades only when a clean SMC setup appears: Order-Block retest after Break of Structure (BOS / CHOCH) confirmation, with optional SR and Fair Value Gap (FVG) confluence. The EA uses pending limit orders, fixed SL/TP or RR-based exits, step-lock trailing and strict risk-controls designed to pass broker validation. What it does Detects swing structure usi
FREE
DM IND Exclusive
Sergio Vidal Prado
Indicador Para Opções Binarias. Indicator for Binary Options Usa dois gales. Instalar em mt5 Esse indicador é para ser usado no tempo de vela de 5 minutos e em M5. Este também funciona em M1, porém é mais eficiente em M5. Só descompactar e copiar os arquivos na pasta de dados do seu MT5. Arquivos indicator na pasta MQL5 - Indicator. Baixe também a Media Movel totalmente gratis: https://www.mql5.com/pt/market/product/50400 Esse Indicador é para a próxima vela. Apareceu a seta, só aguardar a próx
Utilities
Douglas Lucio De Araujo
Indicator with 3 features - Clock : Clock independent of the chart, counting continues even when the market is closed. - Template : After setting up a configuration in any graphic, be it color patterns, indicators, zoom ... The configuration will be copied to all active graphics. - TimeFrame : Set the TimeFrame on a chart, and with just one click all the active charts will be changed to the same TimeFrame.
Retracement Catcher Multi Timeframe   is an Expert Advisor designed for visual backtesting and manual execution around multi-timeframe retracement and reversal setups. It displays divergence structure, L2/L3 Fibonacci retracement levels, and higher-timeframe FIB zones directly on the chart. The EA includes chart buttons to switch FIB timeframes, filter divergence signals, and execute simple market actions during testing. Main features: Multi-timeframe Fibonacci retracement visualization L2 and L
BDB First Wiseman
Sergey Chepurnykh
Bearish/Bullish divergent bar . One of the signals of the "Trade Chaos" system of Bill Williams. (First wiseman) When bar moving away from the  "Alligator" indicator and there is divergence on the Awesome Oscillator indicator, it shows a potential point of movement change. It is based on the opening/closing of the bar, the position relative to the previous ones, the Alligator and AO. When trading, the entrance is at the breakthrough of the bar(short trade - low of bar, long trade high of bar), a
指标介绍: 通道和趋势线指标,是手动交易的好工具,也可用于创建新的 EA,无漂移或重新绘制。 它适用于任何时间框架和任何符号。 指标信号如屏幕截图所示。 对于任何新手和编程交易的朋友,您可以将信号写入EA中自由发挥,缓冲区0对应粗体趋势线,缓冲区4和5分别对应通道的上下边界。 参数介绍: Sound Name :警报声音文件名,必须位于“...\drive_c\Program\Files\MetaTrader5\Sounds\alert.wav”文件夹中。   Repetitions :每次通知您时提醒/电子邮件/通知的重复次数。   Pause ,以秒为单位:两个连续警报/电子邮件/通知之间的间歇时间。   Use Sound: 设置 是否播放系统声音。 Use Alert: 设置 是否使用alert提醒。 Use Send Mail:设置是否使用邮件提醒。 Use Send Notification: 设置 是否向手机推送消息。 我的其他指标和 EA 可以在这里找到 :   https://www.mql5.com/zh/users/hzx/seller   。
Fibonacci automatically draws Fibonacci retracement, Because Fibonacci automatically draws Fibonacci retracement, you can know at a glance the price to buy at a push or sell back. Therefore, you can trade in favorable conditions in a trending market. We are live-streaming the actual operation of the system. Please check for yourself if it is usable. Please check it out for yourself. https://www.youtube.com/@ganesha_forex We do not guarantee your investment results. Investments should be made
AO unpaid divergences
Diego Arribas Lopez
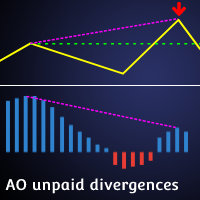
[ How to use the Demo version ] [ MT4 Version ] AO unpaid divergences MT5 AO unpaid divergences is the first indicator developed to detailed analyze Regular and Hidden Divergences. It uses this analysis to find out possible entry points and targets. Below some of the characteristics of this indicator:  Time saving Highly customizable Working for all pairs (Crypto, Forex, Stocks, Indices, Commodities...) Suitable for Scalping or Swing trading Possible reversal swings Alerts and Notifications on M
ApexForge MA Trend Strength Professional 是 ApexForge 系列中功能最完整、最強大的旗艦版本,專為追求專業分析與高效率交易的使用者打造。除了完整的 MA 趨勢強度分析外,Professional 版本提供更多進階功能、更多自訂選項,以及更高的分析自由度,滿足從剝頭皮、日內交易到波段交易等不同操作需求。 指標可自動分析圖表中的移動平均線斜率,並以 Strong Down、Down、Flat、Up、Strong Up 五段式趨勢強度清楚呈現市場狀態,協助交易者快速判斷趨勢是否正在增強、減弱或進入盤整。透過直覺化的介面設計,即使同時監控多個商品與多個時間週期,也能迅速掌握整體市場方向。 Professional 版本支援完整的介面客製化,包括更新頻率、面板位置、顏色配置、文字大小及更多專業設定,並採用極致輕量化架構,不依賴 Tick 更新、不重繪歷史資訊,長時間運行依然保持流暢,適合需要同時開啟多張圖表的專業交易環境。 本指標並非提供買賣訊號,而是提供客觀且一致的趨勢評估,協助交易者建立更有紀律的交易流程。無論搭配價格行為、均線策略、支撐壓力或
MasterCharts
Alexander Berger
You can think of these indicators as moving pivot points. MasterChartsTrading Price Action Indicators show good price levels to enter or exit a trade. The Blue indicator line serves as a Bullish Trend setter. If your instrument closes above the Blue line, we think about going Long (buying). When your trading instrument closes below the Red line, we think about Shorting (selling). It is very easy to read price action if you have a reference point. These support/resistance lines are there to help
TrendTunnel MT5
Vladimir Pokora
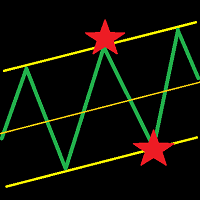
This indicator draws a trend line and a trend tunnel on the chart. You can choose several calculation methods, alerts, notifications, and other settings. It can also draw trendlines from another TimeFrame. You can also use this indicator for your ExpertAdvisor. The current values of the lines are stored in the memory buffer from where the EA can load them. You can trade the price bounce from the upper and lower lines .   Settings TimeFrame – trend timeframe Description – show description of line
Clean Chart Toggle
Liam Alex Thomas Webb
5 (1)
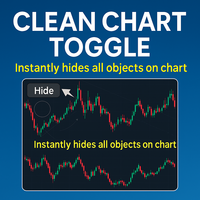
清晰图表切换 是一个用户友好的指标,专为提升 MetaTrader 5 (MT5) 图表体验而设计,通过简单的方式管理图表上指标和对象的可见性。只需位于图表窗口左上角的单个按钮,用户即可立即隐藏或显示所有指标和绘图对象,减少杂乱,提升对价格走势或特定分析需求的专注。 主要功能 一键切换按钮:位于 MT5 图表窗口左上角的按钮,允许用户通过一次点击快速隐藏或显示所有指标和绘图对象。 可自定义可见性:在显示所有指标和对象或清除图表以获得简洁视图之间切换,非常适合专注于原始价格数据。 无缝 MT5 集成:完全兼容 MetaTrader 5,确保在平台内轻松设置和流畅性能。 用户友好设计:直观的界面,最小化设置,适合所有经验水平的交易者。 性能优化:轻量高效,确保不影响 MT5 图表性能或平台速度。 优势 提升图表清晰度:快速整理 MT5 图表,专注于关键价格走势,避免多个指标或绘图的干扰。 节省时间:无需手动隐藏或显示单个指标,简化 MT5 中的工作流程。 改善决策:清晰的图表视图帮助交易者专注于关键价格走势,提升分析和交易决策。 多用途使用:适合使用 MT5 的短线交易者、日内交易者和长期
FREE
. . is designed for traders who want a clean and practical way to identify bullish and bearish trend changes directly on the MT5 chart. The indicator uses a dual high/low smoothing engine to detect market direction and show a clear active trend line. When the market confirms a bullish or bearish flip
Double Fractal Entry Bot trades automatically using fractal breakouts or rebounds. It detects precise entry points, places SL and TP based on market structure, and includes logic to manage risk and avoid false signals. Simple, smart, and powerful. This product is also available for MetaTrader 4 =>  https://www.mql5.com/en/market/product/143609 Double Fractal Entry Bot is an intelligent trading robot based on the proven logic of the Double Fractal Entry indicator. It analyzes price using upper a
SMC Nexus Market Structure
Sergejs Rozkalns
5 (3)
MetaTrader 5 免费 SMC 指标。 SMC Nexus Market Structure 绘制每一位 Smart Money Concepts(SMC)交易者最先解读的两样东西:市场结构(BOS / CHoCH)和订单块(Order Blocks)。图表上再无其他 — 不杂乱、无延迟、不重绘。 结构突破仅在收盘K线上确认。昨天打印的水平位今天仍在原处。这是完整工作区的结构核心,免费发布 — 同一个引擎,没有任何阉割。 你将获得 市场结构 — 双层(内部 + 外部)BOS 与 CHoCH,带标签和颜色区分。同时读取次级摆动结构与主导结构。 订单块(Order Blocks) — 位移与失衡检测、缓解逻辑、中线以及强度百分比标签,让你分辨重量级区块与弱区块。 EQH / EQL — 等高点与等低点,价格倾向去触及的流动性池。 摆动标签 — HH / HL / LH / LL,可选。 浅色与深色主题 — Auto 自动识别图表背景,也可强制 Light 或 Dark。 真实透明度 — 区域填充绘制在画布图层上,下方的K线始终清晰可读。 完整版:Nexus Order Block
FREE
Adaptive Math Zones Indicator is a professional MT5 indicator designed to identify high-probability price reaction areas using mathematical price projections and Fibonacci-based channel structures. The indicator automatically builds a reference price channel, highlights neutral zones, and projects future price levels (50%, 100%, and 200%), helping traders visually understand market structure and potential reaction points. This tool is especially effective during ranging and corrective market con
1. Why did I develop this series of indicators I found that most traders need to use multiple time frame indicators. They usually switch time frame to see indicators. However, once the timeframe is switched, you cannot see the  corresponding relationship  between  the price in the smaller timeframe  and  the indicator in the larger timeframe . For example: if your price chart is in H1 timeframe, you can see H4, D1 and W1 indicators in H1 timeframe Chart. This is more helpful for you to find th
A top and bottom indicator that can intuitively identify the trend of the band. It is the best choice for manual trading, without redrawing or drifting. Price increase of $20 every 3 days, price increase process: 79-->   99 --> 119...... Up to a target price of $1000. For any novice and programming trading friend, you can write the signal into the EA to play freely. Array 3 and array 4, for example, 3>4 turns green, 3<4 turns red. If you don't understand, please contact me. ====================P
Moving pivot Average Fibonacci The  indicator compares the selected period with its counterpart from the previous period. The indicator determines the moving Fibonacci levels for the day or any time interval to assess the price movement range from the time average. The indicator helps predict the expected high or low for the day based on historical time data. The pivot line can be considered an average trend line and use it in a variety of trading strategies. If you have any question about the
Chip RT Trend Regime
Christoffel Jacobus De Klerk
Chip RT Regime Indicator VERY ACCURATE INDICATOR NO REPAINT!!!!!!!!!!! Description Chip RT Regime Indicator is a clean, structure-based trading tool designed to identify true market direction shifts and confirmed entry opportunities. Instead of guessing tops and bottoms, the indicator focuses on market structure and regime changes , giving you clear visual guidance with: Colour-coded trend lines (bullish vs bearish regimes) Confirmed entry arrows only after real momentum shifts No clutter
SupportResistence
Eduardo Borges Mariani
SupportResistance是一个动态支 撑和阻力指标,基于先前蜡烛的高点和低点。 计算参数是可配置的。 您可以使用前一支蜡烛的最大值和最小值作为参考,也可以使用一组前一支蜡烛的最大值和最小值。 指标使用红线表示阻力,绿线表示支撑。 当支撑或阻力破损时,其线将被点缀,仅在再次变得相关时才恢复。 支撑或阻力突破后,一旦到达相反的线,便会在最后一个有效值处找到新的支撑或阻力。 在历史最高或最低的情况下,将没有有效的支撑线或阻力线。 SupportResistance是一个动态支 撑和阻力指标,基于先前蜡烛的高点和低点。 计算参数是可配置的。 您可以使用前一支蜡烛的最大值和最小值作为参考,也可以使用一组前一支蜡烛的最大值和最小值。 指标使用红线表示阻力,绿线表示支撑。 当支撑或阻力破损时,其线将被点缀,仅在再次变得相关时才恢复。 支撑或阻力突破后,一旦到达相反的线,便会在最后一个有效值处找到新的支撑或阻力。 在历史最高或最低的情况下,将没有有效的支撑线或阻力线。
Descriptions A point point is a technical analysis indicator, or calculations, used to determine the overall trend of market over different time frames. This indicator calculate the highest or lowest pivots among left x and right y bars and show the high/low level during that period.   From that, you could clearly see the top resistance & bottom support level and how market goes break out. Instructions pivotLeft - pivot left bar count pivotRight - pivot right bar count pivotHighColor - color
Introducing Oneiro UMBS! This indicator is built to enter trending markets with an optimal position for more profitable trades. Two MAs identify the trend and an envelope to assure the most optimal entry.  Recommendations: This Indicator best works on trending pairs such as XAUUSD , so is the default settings. If you want to try other pairs, you can play around the settings.  Risk: 1:1 Risk ratios has the highest win rate and best suitable for prop firm trading! Always risk 1% for best consiste
Flag MT5
Dmitry Fedoseev
An indicator of patterns #21, #22, #23 ("Flag") from Encyclopedia of Chart Patterns by Thomas N. Bulkowski. Parameters: Alerts - show alert when an arrow appears Push - send a push notification when an arrow appears (requires configuration in the terminal) PeriodBars - period in bars K - an additional parameter that influences the accuracy of pattern shape recognition. The influence of the parameter will be visible if not all of the pattern variants are enabled (not all three parameters Expandin
"Battles between bulls and bears continue to influence price development long after the combat has ended, leaving behind a messy field that observant technicians can use to manage risk and find opportunities. Apply "trend mirror" analysis to examine these volatile areas, looking for past action to impact the current trend when price turns and crosses those boundaries." RSI Mirrors and Reflections is a robust technique using multiple RSI periods, mirrors and reflections based on RSI values to ind
Auto Fibo Retracement MT5
Nguyen Tuan Son
5 (10)
Auto Fibonacci Retracement Indicator — Flexible and Reliable This isn’t just another Auto Fibonacci Retracement indicator. It’s one of the most flexible and dependable tools available . If you find it useful, please consider leaving a review or comment — your feedback means a lot! Check out my other helpful tools below: Telegram to MT5 using AI   - AI-Powered Signal Copier Bot Smart Alert Manager   - Set up advanced alerts and send them to Mobile, Telegram, Discord, Webhook... Timeframes Trend
FREE
Sniper Pro
Md Wakiluzzaman Raz
Sniper Pro Sniper Pro is a sophisticated reversal trading indicator engineered for the MetaTrader platform. It utilizes advanced non-parametric regression and kernel smoothing techniques to filter out market noise and identify high-probability turning points. By calculating a dynamic probability envelope, the indicator provides a clear visualization of where price action is likely to exhaust and reverse back toward its mean. The Trading Philosophy Most traditional indicators rely on moving aver
ZigZagMozart
MIKHAIL VINOGRADOV
The ZigZagMozart indicator is based on the calculation of the advanced ZigZag. Displays trend break points (white squares), resulting points (yellow circles), flat zones (purple dots). The only indicator parameter: “ pivot in points ” - the minimum shoulder between the peaks of the indicator. The indicator uses market analysis based on the strategy of the famous modern trader Mozart. https://www.youtube.com/watch?v=GcXvUmvr0mY. ZigZagMozart - works on any currency pairs. If the parameter “pivo
Break of Structure
Rajesh Kumar Nait
市场结构是在更高的时间范围内突破时可能有助于清除交易者趋势的结构。 1. 该指标将之字折线仅绘制到最后 2 个结构(之字折线的前高点和低点),并且仅当结构发生突破时才会形成之字折线的新柱 2.它给终端和推送通知结构中断 3.通过[和]键增加和减少ZigZag的Extdepth来调整摆动 4.更改线AB BC和CD的颜色 5.添加到许多图表并获得多个符号的警报 如果您正在寻找结构断裂 Multi ExtDepth Breakout Multi Symbol Scanner 您可以使用此产品: Multi Symbol Multi ExtDepth ZigZag Breakout Scanner 市场结构是在更高的时间范围内突破时可能有助于清除交易者趋势的结构。 1. 该指标将之字折线仅绘制到最后 2 个结构(之字折线的前高点和低点),并且仅当结构发生突破时才会形成之字折线的新柱 2.它给终端和推送通知结构中断 3.通过[和]键增加和减少ZigZag的Extdepth来调整摆动 4.更改线AB BC和CD的颜色 5.添加到许多图表并获得多个符号的警报 如果您正在寻
该产品的买家也购买
本产品已针对 2026 年市场进行更新,并针对最新 MT5 版本进行了优化。 价格更新通知: Smart Trend Trading System 目前价格为 $99 。 接下来的 30 次购买 后,价格将上涨至 $199 。 特别优惠: 购买 Smart Trend Trading System 后,请发送私信给我,即可免费领取 Smart Universal EA ,并将您的 Smart Trend 信号转换为自动交易。 Smart Trend Trading System 是一套完整的交易系统,具备不重绘、不回绘、不延迟的特点,专为希望获得更清晰信号、更准确趋势方向以及更有组织交易方式的交易者打造。 Online course , manual and [download presets] . 它将 10 多种交易工具 整合到一个系统中,包括趋势检测、反转区域、Smart Cloud、移动止损逻辑、支撑与阻力、K线着色、提醒以及多周期分析。 该系统旨在帮助您应对不同的市场环境: 趋势市场: 识别主要趋势,发现回调,跟随动能,并通过止损指导和移动止损选项寻找更清晰的入场机会。
Trend Sniper X
Sarvarbek Abduvoxobov
5 (8)
Trend Sniper X 是一款适用于 MetaTrader 5 的多时间周期趋势跟踪指标,帮助交易者以清晰、精确的方式识别趋势方向和潜在的反转点。 价格信息: 当前价格为促销价,随着未来更新和新功能的发布,价格可能会有所变动。 Code2Profit 频道 通过多时间框架分析掌握市场! 技术规格 平台 MetaTrader 5 指标类型 多时间周期趋势指标 运行时间周期 任何图表时间周期,可独立选择更高的时间周期 (M1–MN1) 主要交易品种 外汇、黄金 (XAUUSD) 及其他差价合约 (CFD) 推荐账户 任何账户类型 可视化 彩色趋势蜡烛 (买入/卖出/微弱/变化) + 买入/卖出箭头 附加模块 交易时段方框 (悉尼、东京、伦敦、纽约) 主要功能 多时间周期趋势分析: 直接在当前图表上投射更高时间周期的趋势方向,提供清晰的宏观视角。 弱势/不确定柱检测: 高亮显示趋势条件不明朗的柱线,让交易者避开震荡区域。 买入/卖出信号箭头: 在确认趋势变化后的柱线上自动绘制箭头,支持警报、推送和电子邮件通知。 一键开启/关闭面板: 图表上的按钮可切换指标,下拉菜单可立即切换分析时间周
SMC Intraday Formula
Kareem Abbas
5 (20)
让我们先坦诚一点。 没有任何一个指标可以单独让你实现盈利。如果有人告诉你可以,那他是在向你兜售一个梦想。任何显示完美买卖箭头的指标都可以被做得看起来毫无瑕疵——只需要放大历史中的某一段并截取成功交易的截图。我们不会这样做。 SMC Intraday Formula 是一个工具。 它为你读取市场结构,标记出概率最高的价格区域,并用简单直白的语言准确告诉你当前智能资金的行为轨迹。你仍然需要做决定。你仍然需要执行交易。但现在,你是带着精确性执行,而不是靠希望。 我们已经在黄金(XAUUSD)以及主要外汇货币对的日内剥头皮交易中使用该指标将近三年。这是我们在 M1、M5、M15 和 M30 上的日常主力工具。它之所以有效,是因为它不试图预测未来——它展示的是当前正在形成的高概率交易机会,并解释 为什么 。 它与其他所有指标有什么不同? 大多数交易指标只做一件事。移动平均线交叉。振荡指标触及某个水平。出现一个箭头。你进场交易。你亏损。你责怪指标。重复。 SMC Intraday Formula 将多个机构级概念整合为一个统一的市场解读: - 斐波那契共振引擎 不只是普通的斐波那契水平——该指标
Welcome to ENTRY IN THE ZONE AND SMC MULTI TIMEFRAME Entry In The Zone and SMC Multi Timeframe is a professional trading indicator built on Smart Money Concepts (SMC) , combining market structure analysis with a No Repaint BUY / SELL signal system in a single indicator. It helps traders understand market structure more clearly, identify key price zones, and focus on higher-quality trading opportunities. By combining Multi-Timeframe Analysis , Points of Interest (POIs) , and real-time signals, th
Entry Points Pro for MT5
Yury Orlov
4.5 (147)
传奇回归:Entry Points Pro 10。 这款传奇指标曾 3 年稳居 MQL5 Market 前三,如今全面重启。 数百条热情好评(两个版本合计 589 条),每天有数千名交易者用它交易,演示版下载 31,000+   MT4+MT5  次。 五年来我读过你们的每一条评价——在第 10 版里,我没有给出许诺,而是把答案直接做进了产品。指标作者自 1999 年入市, 珍视诚信、自己的声誉和自己的客户 。 Entry Points Pro 给出的入场信号严格不重绘。 而且这一次不再只是作者的一面之词,而是可验证的事实:确认信号只在 K 线收盘后标出,自动化测试记录到 零重绘 (在 EURUSD、XAUUSD 和 BTCUSD 上共 2,486,568 次不变量检查——0 次违规)。测试方法完全公开——您可以在策略测试器中自行复现。 购买后请务必第一时间给我发私信。 我会发给您 扩展版说明书《交易者圣经》 ——使用本指标交易的完整指南——并告诉您如何免费获得 赠品:市场扫描器 ,它能同时分析多个品种和多个时间周期,并在一个界面上显示 Entry Points Pro 此刻在哪里表现
SuperScalp Pro
Van Minh Nguyen
4.6 (30)
SuperScalp Pro – 专业多层共振剥头皮交易系统 SuperScalp Pro 是一款专业的多重共振剥头皮交易系统,旨在帮助交易者识别更高概率的交易机会,提供更清晰的入场确认、基于 ATR 的止损(Stop Loss)和止盈(Take Profit)水平,以及适用于 XAUUSD、BTCUSD 和主要外汇货币对的灵活信号过滤功能。 完整使用文档可在产品博客查看: [User Guide] 支持通过 SuperScalp Pro Auto Trader EA 进行自动交易: [Auto Trader] 基于 SuperScalp Pro 交易逻辑开发的黄金自动剥头皮 EA: [SuperScalp Gold] SuperScalp Pro 集成了 Supertrend、VWAP、EMA、RSI、ADX、成交量分析、布林带(Bollinger Bands)以及 MACD 背离分析,用于过滤低质量交易机会,减少虚假突破信号,并提高入场精准度。 SuperScalp Pro 专为 XAUUSD、BTCUSD 以及主要外汇货币对优化设计,通过基于 ATR 的波动率逻辑和规则化信
M1 Quantum MT5
Hamed Dehgani
4.6 (10)
使用 M1 Quantum 的实盘交易信号 : 信号 (交易由 Quantum Trade Assistant 自动 执行,并作为本产品 免费 提供。) 价格计划: 当前价格: $169 (早期用户优惠) 下一阶段计划价格: $189 计划零售价: $299 开发者提示: 购买后请联系我,以获取 最新推荐的参数设置文件(Set File) 、交易建议,以及加入 VIP 支持群组 ,与其他 M1 Quantum 用户交流经验。 常见问题 - 设置文件 - 安装指南 M1 Quantum 是一款专业的 M1 交易系统,提供快速且精准的交易信号,并内置止损(Stop Loss)、止盈(Take Profit)以及智能资金管理功能。 M1 Quantum 包含专业的资金管理系统,通过专注于 连续盈利交易 ,帮助交易者更快地增长账户资金。 M1 Quantum 指标 的主要特点 专为 M1 时间周期 和所有 主要货币对 设计 所有交易均配备止损和止盈 内置 资金管理功能 ,并指导交易者轻松执行交易计划 高胜率,高比例的 连续盈利交易 无重绘,无延迟 适合各种类型的交易者,简单易懂 要使用 M
Divergence Bomber
Ihor Otkydach
4.9 (92)
我偶爾會親自使用這個系統進行交易。 請評估我在真實帳戶上進行的手動 BOMBER 交易—— LIVE SIGNAL 购买该指标的每位用户将额外免费获得以下内容: 原创工具“Bomber Utility”,该工具会自动跟踪每一笔交易,设置止损和止盈点,并根据策略规则自动平仓; 适用于不同交易品种的指标设置文件(Set 文件); 三种不同风险模式下的 Bomber Utility 设置文件:“最低风险”、“平衡风险” 和 “观望策略”; 一套详细的 视频操作手册,帮助您快速完成安装、配置并开始使用本交易系统。 注意: 要获取以上所有赠品,请通过 MQL5 的私人消息系统联系卖家。 我为您介绍原创的自定义指标 “Divergence Bomber”(背离轰炸机),它是一套基于 MACD 背离交易策略 的“全功能”交易系统。 该技术指标的主要任务是识别 价格与 MACD 指标之间的背离,并发出交易信号(包括推送通知),指示未来价格可能的运动方向。平均而言,这些信号的准确率超过 98%。有关该指标如何工作的详细说明,请观看本页面上的视频演示。 该系统使用 止损订单 和 动态回撤平仓机制 来管理
Neuro Poseidon MT5
Daria Rezueva
4.73 (55)
Neuro Poseidon is a new indicator by Daria Rezueva. It combines precise trading signals with adaptive TP/SL levels - creating best possible trades as a result! Message me and get  Neuro Poseidon Assistant  as a gift to automize your trading process! What makes it stand out? 1. Proven profitability on all assets and timeframes 2. Only confirmed BUY and SELL signals present on the chart 3. Adaptive TP & SL levels generated by the software for each trade 4. Easy to understand - suitable for al
Gann Made Easy MT5
Oleg Rodin
5 (8)
Gann Made Easy   是一个专业且易于使用的外汇交易系统,它基于使用先生理论的最佳交易原则。 W.D.江恩。该指标提供准确的买入和卖出信号,包括止损和获利水平。您甚至可以使用推送通知在旅途中进行交易。 购买后请联系我,即可免费获得交易指导和超棒的额外指标! 您可能已经多次听说过江恩交易方法。通常 Gann 的理论不仅对于新手交易者而且对于那些已经有一定交易经验的人来说都是非常复杂的东西。这是因为江恩的交易方法在理论上并不那么容易应用。我花了几年时间来完善这些知识,并将最好的原则应用到我的外汇指标中。 该指标非常易于应用。您所需要的只是将其附加到您的图表并遵循简单的交易建议。该指标不断进行市场分析工作并寻找交易机会。当它检测到一个好的入口点时,它会为您提供一个箭头信号。该指标还显示止损和获利水平。 换句话说,当您像先生一样进行交易时,该指标会为您提供最佳江恩建议。江恩亲自告诉你此时此刻该做什么。但最好的部分是您不需要了解任何有关江恩交易原则的知识,因为该指标会为您完成整个市场分析工作。
GoldenX Entry MT5
Kareem Abbas
5 (15)
GoldenX Entry 是一款用于 MT5 的指标,包含自适应 Smart Entry Trend 算法、信号评分系统、市场状态识别器以及波动率过滤器。每个信号都包含计算得出的入场位、三个止盈位(TP1、TP2、TP3)以及止损位。它基于多个分析层构建,旨在适应不同市场条件,将多层分析系统与内置优化器及统计跟踪系统相结合。该指标基于风险收益比(RR)指标和历史交易行为提供量化分析。 开始使用非常简单——在所选时间周期上运行优化器,然后在图表上开始使用该指标。 核心功能 GoldenX Entry 将信号引擎与内置交易管理及历史统计跟踪整合在同一图表中: - 内置优化器: 优化器可在图表上单击运行。它通过两阶段搜索流程测试200种参数组合——先进行探索,再进行优化——并在完成后自动应用选定配置。结果会按时间周期缓存,因此当返回已优化的周期时,会立即恢复相同设置。 - 黄金品种自动周期识别: 将指标加载到任何 XAUUSD 图表(M1 到月线)。系统会自动识别当前周期并加载对应预设。共包含9个时间周期配置文件,专为黄金在标准周期上优化设计。切换周期时,参数会自动调整。 - 资金参考面
Atomic Analyst MT5
Issam Kassas
4.38 (47)
本产品已针对 2026 年市场进行更新,并针对最新 MT5 版本进行了优化。 价格更新通知: Atomic Analyst 目前价格为 $99 。 接下来的 30 次购买 后,价格将上涨至 $199 。 特别优惠: 购买 Atomic Analyst 后,请发送私信给我,即可免费领取 Smart Universal EA ,并将您的 Atomic Analyst 信号转换为自动交易。 Atomic Analyst 是一款不重绘、不回绘、不延迟的 Price Action 交易指标,专为手动交易、清晰信号和 EA 自动化而设计。 User manual: settings, inputs and strategy.   &   User Manual PDF . 它分析价格行为、强度、动能、多周期方向和高级过滤器,帮助交易者减少噪音,避免弱势交易机会,并做出更有结构的交易决策。 该指标将复杂的市场计算转换为简单的视觉信号、彩色K线、趋势读数、止损水平和多个止盈区域,使交易者能够快速理解并应用于真实市场环境。 主要交易用途: 剥头皮和日内交易: 专为快速决策、清晰箭头、提醒、K线颜色和
ARICoins
Temirlan Kdyrkhan
ARICoin is a powerful trading companion designed to generate high-probability entry signals with dynamic TP/SL/DP levels based on volatility. Built-in performance tracking shows win/loss stats, PP1/PP2 hits, and success rates all updated live. Key Features: Buy/Sell signals with adaptive volatility bands Real-time TP/SL/DP levels based on ATR Built-in MA Filter with optional ATR/StdDev volatility Performance stats panel (Success, Profit/Loss, PP1/PP2) Alerts via popup, sound, push, or email Cust
Zoryk Gold
Reda El Koutbane
5 (4)
折扣将在 24 小时后结束——下一价格为 69 美元 ZORYK — MetaTrader 5 专用高级 XAUUSD 黄金信号系统 你一定熟悉这种感觉。 你花了很多时间分析黄金,等待合适的入场机会。终于开仓后,价格却立刻朝相反方向移动。你过早平仓、移动止损,或者只犹豫了几秒钟。随后,市场却在没有你的情况下到达了你原本预期的目标。 问题并不总是方向判断错误。 真正的问题是缺乏确定性。 你不知道准确的入场位置在哪里。 你不知道什么时候交易逻辑已经失效。 你不知道应该先锁定较近的利润,还是继续等待更大的行情。 你也不知道当前信号是否足够强,还是自己只是在强行寻找交易机会。 黄金市场变化非常快。一个没有明确计划的好想法,可能在几秒钟内变成错误的交易决定。 ZORYK 正是为了解决这个问题而开发。 什么是 ZORYK ZORYK 是一套完整的 XAUUSD 黄金信号与交易计划系统,专门为 MetaTrader 5  和 M5 时间周期 开发。 它不是一个只显示 BUY 或 SELL 箭头,然后让你独自决定其余所有内容的简单指标。 每个确认后的信号都可以在图表上显示完整的可视化交易计划,包
Crystal Heikin Ashi Signals
Muhammad Jawad Shabir
5 (2)
Crystal Heikin Ashi Signals - Professional Trend & Signal Detection Indicator Advanced Heikin Ashi Visualization with Intelligent Signal System for Manual & Automated Trading Final Price: $149 ---------> Price goes up $10 after every 10 sales . Limited slots available — act fast . Overview Crystal Heikin Ashi Signals is a professional-grade MetaTrader 5 indicator that combines pure Heikin Ashi candle visualization with an advanced momentum-shift detection system. Designed for both manual traders
Power Candles MT5
Daniel Stein
5 (9)
Power Candles V3 - 自我优化的强度指标 Power Candles V3 把货币与品种的强度直接转化为图表上可执行的交易方案。指标不再仅根据强度给K线着色,而是在后台持续运行实时自动优化,为您正面对的品种给出最佳 Stop Loss、Take Profit 与信号阈值。一键采用,Entry、Stop Loss、Take Profit 线就以精确价格绘制在图表上,提醒消息中直接包含方向。 本工具是 Stein Investments 生态系统的一部分 - 18+ 款工具,加上 Max,您的一对一 AI 交易导师。  随时在线,深入了解每一款指标,在您需要梳理思路的那一刻就在那里。  立即认识他: https://stein.investments 每根收盘K线运行 3,000+ 次交易模拟。9 种强度状态。2 种策略并行测试。一键采用最优配置。 为什么需要这个 大多数强度指标只给您一个数值,然后留下三个问题:相信哪个阈值、用哪个 Stop Loss、走哪个交易方向。Power Candles V3 在每根收盘K线上自动回答这些问题。结果就是一个完整的交易方案 -
ARIPoint
Temirlan Kdyrkhan
1 (1)
ARIPoint is a powerful trading companion designed to generate high-probability entry signals with dynamic TP/SL/DP levels based on volatility. Built-in performance tracking shows win/loss stats, PP1/PP2 hits, and success rates all updated live. Key Features: Buy/Sell signals with adaptive volatility bands Real-time TP/SL/DP levels based on ATR Built-in MA Filter with optional ATR/StdDev volatility Performance stats panel (Success, Profit/Loss, PP1/PP2) Alerts via popup, sound, push, or email Cu
Gem SIGNAL
Shengzu Zhong
5 (1)
GEM Signal Pro GEM Signal Pro 是一款適用於 MetaTrader 5 的趨勢跟隨指標,專為希望在圖表上獲得更清晰訊號、更有結構的交易設定,以及更實用風險管理的交易者而設計。 它不僅僅顯示一個簡單的箭頭,GEM Signal Pro 還能以更清晰、更易讀的方式呈現完整的交易思路。當條件確認完成後,指標可在圖表上顯示進場價、止損價與止盈目標,幫助交易者更有效率地評估交易設定。 運作方式 該指標首先根據其內部邏輯識別有效的初始訊號。 當確認條件滿足後,GEM Signal Pro 會在圖表上顯示完整的交易設定。這讓交易者可以更清楚地看到交易結構,並減少手動分析與計算的工作量。 圖表上的交易價位 對於已確認的訊號,GEM Signal Pro 可顯示: 進場價 止損價 止盈 1 止盈 2 止盈 3 風險報酬比 這讓交易設定更容易理解,也有助於讓圖表分析更有條理。 內建風險管理 風險管理是此指標設計的重要部分。 止損位基於近期市場結構,結合附近的擺動高低點與可選的 ATR 緩衝距離。這能讓交易價位更貼近當前市場條件,而不只是依賴固定距離。 圖表資訊面板 GEM Si
Azimuth Pro
Ottaviano De Cicco
5 (7)
Azimuth Pro V2:MT5合成分形结构分析与确认入场 概述 Azimuth Pro 是 Merkava Labs 推出的多层级波段结构指标。四层嵌套波段层级、锚定波段的VWAP、ABC形态识别、三时间框架结构过滤以及收盘确认入场——一个图表,一个从微观波段到宏观周期的完整工作流程。 这不是盲目的信号产品。它是一个以结构为先的工作流程,专为重视位置、背景和时机的交易者打造。 ️ 夏季促销 — 庆祝夏至与 The Oracle Pro 上市:Azimuth Pro 七折优惠,现价 279 美元(原价 399 美元)。限时夏季优惠。 1. V2的变化 合成多时间框架引擎 高时间框架分析从零开始重建,采用与Meridian Pro相同的专有合成架构。更清晰的HTF背景、稳定的实时行为、无经典MTF同步问题。合成引擎还解锁了 固定比率时间框架级联 (x2、x3、x4、x6)——不再在经纪商的固定时间框架之间任意跳转,您可以按图表时间框架的固定倍数分析结构,在每个尺度上保持相同的分形关系。 确认入场箭头 作为稳定且可恢复的执行层而设计的收盘确认箭头。当ABC设置形成且自适应确认逻辑
UZFX {SSS} 超短线智能信号 v4.0 MT5 是一款无重绘的高性能交易指标,专为在快速波动的市场中需要精准、实时信号的超短线交易者、日内交易者和波段交易者设计。该指标由 (UZFX-LABS) 开发,融合了价格行为分析、趋势确认和智能过滤技术,可在所有货币对和时间周期内生成高概率的买卖信号、预警信号以及趋势延续机会。 别再对交易犹豫不决了,开始遵循这一专为追求清晰、精准和纪律性市场执行的交易者设计的结构化信号系统吧。 我的建议* 最佳时间周期:15分钟及以上。 {H1} 是我的最爱。而且效果令人惊叹……!! 更新后的主要功能 • 自动买入和卖出信号检测 • 先进的反转识别逻辑 • 潜在市场反转前的早期预警信号 • 趋势延续确认信号 • 内置风险管理功能,包含入场点、止损点、TP1、TP2和TP3水平 • 完全可自定义的风险回报比 • 实时警报、声音提醒和移动端推送通知 • 带交易建议的专业信息面板 • 适用于所有MT5交易品种和时间周期 • 界面简洁、轻量且用户友好 为什么交易者选择 UZFX SSS? 大多数交易者亏损的原因在于入场过晚、平仓过早,或者缺乏明确的交
M1 Sniper MT5
Oleg Rodin
5 (4)
M1 SNIPER   是一款易于使用的交易指标系统。它是一个专为 M1 时间框架设计的箭头指标。该指标可以作为独立的系统在 M1 时间框架下进行剥头皮交易,也可以作为您现有交易系统的一部分使用。虽然该交易系统专为 M1 时间框架交易而设计,但它也可以用于其他时间框架。我最初设计此方法是为了交易 XAUUSD 和 BTCUSD。但我发现这种方法在其他市场交易中也同样有用。 指标信号既可以顺势交易,也可以逆势交易。我教授一种特殊的交易技巧,帮助您利用指标信号进行双向交易。该方法基于使用特殊的动态支撑位和阻力位区域。 购买后,您可以立即下载 M1 SNIPER 箭头指标。此外,我还为所有 M1 SNIPER 工具用户免费提供下方屏幕截图所示的 Apollo Dynamic SR 指标!这两个指标的组合可以帮助您更轻松、更准确地利用 M1 时间框架进行交易。 购买后请联系我,免费获取交易提示和奖励指标! 祝您交易成功!
RelicusRoad Pro MT5
Relicus LLC
4.96 (24)
RelicusRoad Pro: 量化市场操作系统 终身访问限时 70% 折扣 - 加入 2,000+ 交易员社区 为什么大多数交易者即使拥有“完美”指标也会失败? 因为他们在真空中交易 单一概念 。没有背景的信号是赌博。要持续获胜,您需要 共振 (CONFLUENCE) 。 RelicusRoad Pro 不是一个简单的箭头指标。它是一个完整的 量化市场生态系统 。它描绘价格运行的“公允价值之路”,区分市场噪音和真实的结构性突破。 停止猜测。开始用机构级“路”逻辑进行交易。 核心引擎:“Road” (路) 算法 系统的核心是 Road Algo ,一个实时适应市场条件的动态波动率通道。它投射出 安全线 (平衡) 和价格可能反转的 扩展水平 。 Simple Road: 典型市场的标准结构映射。 Smooth Road: 针对震荡盘整的降噪计算。 Breakout Road: 专为识别波动率扩张和爆发性走势而调整。 1. 算法动量与确认 我们的“剥头皮箭头”不只是简单的交叉。它们利用 高阶多项式逻辑 过滤噪音,确保信号与主周期一致。我们检测动量、价格行为和 Road 结构汇聚的精确入场
Axiom Matrix
Issam Kassas
5 (5)
AXIOM MATRIX MT5 首发价格:$99 Axiom Matrix 现以 $99 的首发价格提供。 前 30 次购买完成后,价格将上涨至 $199。 购买后,请直接私信我,以获取使用说明并领取您的专属赠品奖励。 Axiom Matrix 是一款适用于 MetaTrader 5 的专业多品种、多时间周期市场扫描器和决策仪表板。 它会扫描您的 Market Watch,分析多个时间周期,读取多个证据引擎,比较最强的交易机会,并在一个清晰的矩阵仪表板中显示最佳 BUY、SELL、WAIT 或被阻止的状态。 我开发 Axiom Matrix,是因为我想要一个可以替我完成繁重市场扫描工作的工具。 我不想只单独检查 RSI。 然后单独检查 MACD。 然后检查移动平均线。 然后检查成交量。 然后检查波动率。 然后检查支撑和阻力。 然后还要手动在不同品种和时间周期之间切换,只为了建立一个交易思路。 我想要一个仪表板,可以扫描市场、比较证据、排序最佳机会,并告诉我现在最强的交易设置在哪里。 这就是 Axiom Matrix 背后的核心理念。 AXIOM MATRIX 的功能 Axiom Ma
SkyHammer Signal Pro
Shengzu Zhong
5 (4)
SkyHammer Signal Pro Professional No-Repaint Trend Signal Indicator with Locked Entry, SL and TP Levels SkyHammer Signal Pro is a structured trend and momentum signal indicator designed for traders who want clear, fixed, and verifiable trading signals. It works best on lower timeframes such as M1 and M5 . The indicator does not try to predict tops or bottoms. Instead, it waits for confirmed market structure, trend direction, momentum strength, volatility quality, and target space before generati
Smc Pro ToolKit
Talal N Z Aljarusha
5 (3)
SMC Pro ToolKit  is a professional chart-based Smart Money Concepts indicator for MetaTrader 5. It helps traders read market structure, identify key liquidity areas, organize trade context, and plan setups directly from the chart. This is not a simple buy/sell arrow indicator. It is a complete visual trading toolkit that combines Smart Money Concepts, multi-timeframe analysis, session context, setup planning, risk assistance, and professional dashboard tools in one clean workspace. Watch setup
货币强度向导是一个非常强大的指标,为您提供成功交易的一体化解决方案。该指标使用多个时间范围内所有货币的数据来计算这个或那个外汇对的力量。此数据以易于使用的货币指数和货币电力线的形式表示,您可以使用它们来查看这种或那种货币的力量。 您所需要的只是将指标附加到您要交易的图表上,该指标将向您显示您交易的货币的真实强度。该指标还向您显示买卖量压力的极值,您可以在顺势交易时利用这些压力。该指标还显示了基于斐波那契的可能目标。该指标可用于各种交易时间范围。该指标支持各种货币对的交易。   该指标为您提供所有类型的警报,包括推送通知。 购买后请联系我。我将与您分享我的交易技巧,并免费为您提供丰厚的红利指标! 祝您交易愉快,获利丰厚!
The Oracle Pro
Ottaviano De Cicco
5 (1)
The Oracle Pro:用于 MT5 的合成多周期偏向引擎 ️ 夏季上市优惠 — 早期买家可以 199 USD 获得 The Oracle Pro。价格将随关注度上升;最终价格 399 USD。 The Oracle Pro 是一款面向高要求与专业交易者的 MetaTrader 5 高级多周期 偏向引擎 。它以纪律回答一个问题:当前每个周期的方向偏向是什么、强度如何、各周期之间的一致程度如何?一切仅在已收盘的 K 线上计算——绝不重绘。 The Oracle Pro 是一套多因子共识系统。它将专有指标与优化算法整合为单一而精密的共识向量,并在单个指标实例内,跨当前周期与更高周期的堆栈进行读取——而不是在多个图表上堆叠互不相关的工具。 它是 Oracle 共识方法的专业进化版:完整重建为高级操作控制台,面向希望在一个纪律化工作流中获得深度、多周期背景与背离洞察的交易者。 是偏向引擎,而非信号生成器 The Oracle Pro 明确自身定位。它是一款提供纪律化方向背景的 多周期多因子偏向指标 。它 不是 信号生成器:不承诺入场、出场或盈利。偏向是背景——你在其方向上交易自己的设置
Atbot
Zaha Feiz
4.69 (55)
AtBot: 它是如何工作的以及如何使用它 ### 它是如何工作的 “AtBot”指标用于MT5平台,通过结合技术分析工具生成买入和卖出信号。它集成了简单移动平均线(SMA)、指数移动平均线(EMA)和平均真实波幅(ATR)指标,以识别交易机会。此外,它还可以利用Heikin Ashi蜡烛来增强信号的准确性。 购买后留下评论,您将获得特别的奖励礼物。 ### 主要特点: - 不重绘: 信号在绘制后不会改变。 - 不变动: 信号保持一致,不会被更改。 - 无延迟: 提供及时的信号,没有延迟。 - 多种时间框架: 可在任何时间框架上使用,以适应您的交易策略。 ### 操作步骤: #### 输入和设置: - firstkey (TrendValue): 调整趋势检测的灵敏度。 - Secondkey (SignalValue): 定义买入/卖出信号生成的灵敏度。 - masterkey (ExitValue): 控制信号的退出策略。 - h: 切换是否根据Heikin Ashi蜡烛生成信号(真/假)。 - notifications: 启用或禁用信号提醒。 #### ATR计算: ATR测
Btmm state engine pro
Garry James Goodchild
5 (4)
BTMM State Engine Pro is a MetaTrader 5 indicator for traders who use the Beat The Market Maker approach: Asian session context, kill zone timing, level progression, peak formation detection, and a multi-pair scanner from a single chart. It combines cycle state logic with a built-in scanner dashboard so you do not need the same tool on many charts at once. What it does Draws the Asian session range; session times can follow broker server offset or be set in inputs. Tracks level progression (L
Quantum TrendPulse
Bogdan Ion Puscasu
5 (25)
介绍 Quantum TrendPulse   ,这是一款终极交易工具,它将 SuperTrend   、   RSI 和 Stochastic 的强大功能整合到一个综合指标中,以最大限度地发挥您的交易潜力。该指标专为追求精准和效率的交易者而设计,可帮助您自信地识别市场趋势、动量变化以及最佳进入和退出点。 主要特点: 超级趋势整合: 轻松跟随当前的市场趋势并乘上盈利浪潮。 RSI 精度: 检测超买和超卖水平,非常适合把握市场逆转时机,可用作 SuperTrend 的过滤器 随机精度: 利用随机振荡在波动的市场中寻找隐藏的机会, 用作超级趋势的过滤器 多时间范围分析: 从 M5 到 H1 或 H4,在不同时间范围内关注市场动态。 可定制的警报: 当您的自定义交易条件得到满足时收到通知,这样您就不会错过任何交易。 无论您是新手还是经验丰富的交易员,   Quantum TrendPulse 都能为您提供所需的优势,帮助您增强策略并自信地进行交易。借助这一强大的指标,将洞察力转化为利润 — 掌控您的交易! ***购买 Quantum TrendPulse,即可免费获得 Quantum Tr
作者的更多信息
MACD Divergence and TFR for MT5
Krzysztof Janusz Stankiewic
5 (2)
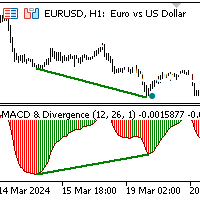
该指标通过分析连接价格和MACD直方图峰值或谷值的线的斜率来识别背离。 看涨背离(趋同):   当连接MACD谷值的线与连接相应价格谷值的线具有相反的斜率并趋同时发生。 看跌背离:   当连接MACD峰值的线与连接相应价格峰值的线具有相反的斜率并发散时发生。 当检测到背离信号时,指标会在对应信号的价格水平和时间上在图表中标注点。 额外功能: 该指标集成了 Darek Dargo的交易系统 中的信号,称为 TFR(The First Red) 。如果背离和TFR信号同时发生,指标会在图表中显示方向箭头,突显强化信号。 MACD直方图: 为了更清晰地显示,直方图采用不同颜色: 红色柱状 表示值高于前一根柱子。 绿色柱状 表示值低于前一根柱子。 当直方图在零线以下从红色变为绿色时,表明可能存在买入机会。相应地,当直方图在零线以上从绿色变为红色时,表明可能存在卖出机会。 背离和TFR信号作为过滤器,增强了这些信号的可靠性。 技术细节: MACD直方图计算为12周期和26周期指数移动平均线的差值。信号线未参与背离模式,以确保专注于直方图的动态。
Supply Demand FVG Zones
Krzysztof Janusz Stankiewic
5 (1)
Supply or demand zones refer to price areas where a significant amount of supply or demand had previously entered the market, causing prices to either fall or rise. If the price returns to the demand or supply zone, it is likely to bounce off due to the large number of orders previously placed within the zone. These orders will be defended in these areas. The Fair Value Gap (FVG) is a concept used to identify imbalances in the equilibrium of buying and selling. Fair Value Gaps are formed in a t
MT5 Macd Divergence Scanner
Krzysztof Janusz Stankiewic
This indicator helps you monitor multiple currency pairs and timeframes all at once. It displays the occurrence of divergences between price and the MACD indicator in a clear and easy-to-read table. Monitoring multiple timeframes and currency pairs in one place helps traders identify a divergence without needing to switch between charts. Divergences can be bullish or bearish. For example, if the price forms a higher high while the MACD forms a lower high, this indicates bearish divergence. On th
Integrated Dashboard Scanner
Krzysztof Janusz Stankiewic
5 (1)
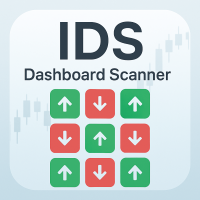
集成仪表盘扫描器 – 您的市场指挥中心 (v2.0) 简短描述: 不要再浪费时间手动切换数十个图表了。 集成仪表盘扫描器 是一款功能强大的多品种、多时间周期扫描工具,让您能从单一面板监控您选择的所有交易品种。 经过重大的架构改革,2.0版本比以往任何时候都更快、更稳定、更强大。   您可以即时收到价格形态、背离和趋势信号的视觉警报,然后一键跳转到相关图表。 主要特点 节省时间:   一个面板覆盖整个市场——不再需要手动切换图表。 全面分析:   四个完全可配置的扫描模块, 现已包含MACD趋同分析。 即时反应:   一键即可将目标图表切换到正确的交易品种和时间周期。 完全自定义:   调整交易品种、指标参数、面板样式和警报通道。 坚如磐石的稳定性:   每个仪表盘实例现在都以唯一的ID运行,消除了在同一终端上使用多个扫描器时的冲突。 无阻塞UI与实时状态:   即使有大量交易品种,面板加载时也不会冻结您的终端。一个新的状态标签能让您随时了解其操作(同步、扫描、监控)。 智能化性能:   扫描器采用异步、逐一品种的数据初始化方式。如果某个品种的数据加载缓慢,不会阻塞其他品种。 经过大规模
Supply Demand Ranger
Krzysztof Janusz Stankiewic
5 (4)
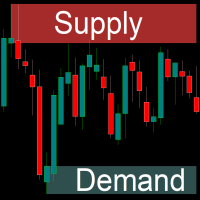
The indicator draws supply and demand zones. The zone timeframe can be set independently of the chart timeframe. For instance, it is possible to set M5 zones on an H4 chart. The importance of zones can be adjusted using the zone strength parameter. Demand zones are displayed if at least one candle in the range of the zone is entirely above the zone. Similarly, supply zones are displayed if at least one candle within the zone is entirely below the zone.
Purpose of the Inside Bar and Outside Bar Breakout Scanner Indicator: The Inside Bar & Outside Bar Breakout Scanner  is an advanced dashboard designed to scan multiple instruments and timeframes simultaneously. Its primary function is to identify two powerful candlestick patterns—the  Inside Bar (IB)  and the  Outside Bar (OB) —and then to detect and classify breakouts from these formations. The indicator presents its findings in a clean, organized table, signaling potential trend continuation o
Symbol
Krzysztof Janusz Stankiewic
For those who monitor charts from afar, this utility is essential. It displays the chart symbol, time frame, and bid price as text. Users can adjust the text position, color, and font size. It’s also a useful tool for forex video publishers. There will be no more complaints about which symbol and time frame are displayed on the screen, even if the content is viewed on a phone. Symbol prefixes such as “_ecn” or “_stp” can be removed from the displayed symbol.
FREE
Supply Demand FVG
Krzysztof Janusz Stankiewic
3 (2)
The indicator offers a comprehensive suite of features for identifying key market areas, including: Supply Zones Demand Zones Fair Value Gaps (FVG) and provides alerts whenever price reaches a supply or demand zone. Key Features: Historical Zones: In addition to active zones, the indicator now includes historical supply, demand, and FVG zones, allowing for a deeper analysis of past price behavior. Flexible Zone Timeframes: Zones can be plotted independently of the chart's timeframe, enabling sce
MACD Divergence and TFR for MT4
Krzysztof Janusz Stankiewic
5 (1)
The indicator identifies divergence by analyzing the slopes of lines connecting price and MACD histogram peaks or troughs. Bullish Divergence (Convergence): Occurs when the lines connecting MACD troughs and corresponding price troughs have opposite slopes and are converging. Bearish Divergence: Occurs when the lines connecting MACD peaks and corresponding price peaks have opposite slopes and are diverging. When a divergence signal is detected, the indicator marks the chart with dots at the pric
MT4 Macd Divergence Scanner
Krzysztof Janusz Stankiewic
该指标提供了一种高效的方法,可同时监控多个货币对和不同周期。通过在清晰易读的表格中直观展示价格与MACD之间的背离,它使交易者无需频繁切换图表即可发现潜在的市场转折点。 背离可能表示多头或空头动能的变化。例如,当价格创出新高但MACD未能相应创出更高的高点时,就出现看跌背离。相反,当价格创出更低的低点而MACD却形成更高的低点时,就出现看涨背离。 在指标的表格中,每个品种(如EURUSD、GBPUSD)垂直列于左侧,所选周期(如M5、H1、D1)水平排列在顶部。一个简单的点表示未检测到背离;当出现“UP”或“DN”(下)的标记时,就突显了一个潜在的交易信号。绿色的“UP”意味着可能的买入机会,而红色的“DN”意味着可能的卖出机会。发现信号后,指标还可根据您的设置,通过弹窗、邮件或推送通知进行提醒。与往常一样,建议结合更高周期分析、移动平均线及关键支撑和阻力位等方法来确认交易信号。 该工具提供两种扫描模式:一种只关注当前图表的品种,另一种扫描您自定义的品种列表。如果您需要同时扫描多个品种,只需在设置中用逗号(不加空格)分隔输入每个品种名称。在这种情况下,将表格放置在单独的图表窗口中,可能
The First Red MT4
Krzysztof Janusz Stankiewic
基于达里乌什·达戈(Dariusz Dargo)创建的策略,“The First Red”指标旨在识别并标记图表上符合“The First Red”策略及其扩展条件的蜡烛图,例如“Second Red”、“First Green”和“Second Green”。该策略主要分析局部极值和MACD振荡器的信号。 第一根红色蜡烛(First Red Candle):   当蜡烛形成局部最高点且MACD直方图转向看跌时,将其标记为“First Red”。 图表符号:红色向下箭头位于蜡烛上方。 第二根红色蜡烛(Second Red Candle):   紧随“First Red”之后的第二根看跌蜡烛,确认趋势方向的改变。 图表符号:红色数字“2”位于蜡烛上方。 第一根绿色蜡烛(First Green Candle):   当蜡烛形成局部最低点且MACD直方图转向看涨时,将其标记为“First Green”。 图表符号:绿色向上箭头位于蜡烛下方。 第二根绿色蜡烛(Second Green Candle):   紧随“First Green”之后的第二根看涨蜡烛,确认趋势方向的改变。 图表符号:绿色
筛选:
无评论
回复评论