Indicadores técnicos para MetaTrader 5 - 41

El Asesor Experto para este indicador se puede encontrar aquí: https: //www.mql5.com/en/market/product/115564 El indicador de ruptura de contracción/expansión para MetaTrader 5 (MT5) es una potente herramienta diseñada para identificar y señalar la ruptura de formaciones alcistas y bajistas de contracción o expansión en los mercados financieros. Utilizando cálculos algorítmicos avanzados, este indicador ayuda a los operadores a detectar movimientos de precios significativos que a menudo acompañ
FREE

Indicador de scalping de mapa de calor del XAUUSD . Perfecto para scalping 1M, 3M, 5M, 15M en Oro (XAUUSD) Lleva tu scalping al siguiente nivel con este exclusivo indicador Heat Map , diseñado y optimizado específicamente para XAUUSD . Esta herramienta es un potente asistente visual que le ayuda a identificar al instante la fortaleza del mercado, las zonas de presión y los posibles puntos de entrada en tiempo real. Características principales: Optimizado para Fast Scalping : Funciona me

Awesome Oscillator de Bill Williams con la capacidad de afinar y reemplazar los algoritmos de promediación del indicador, lo que amplía significativamente las posibilidades de uso de este oscilador en el trading algorítmico y lo acerca en sus propiedades a un indicador como el MACD. Para reducir el ruido del precio, el indicador final se procesa con un promediado Smooth adicional. El indicador tiene la capacidad de dar alertas, enviar mensajes de correo y señales push cuando la dirección del mo

Cómo funciona Momentum Flow para usted: Momentum Flow emplea un sofisticado proceso de múltiples etapas para entregar sus señales: Detección del Cambio de Momento: Primero identifica los impulsos significativos del precio utilizando niveles de ruptura dinámicos basados en el Average True Range (ATR). Un periodo de enfriamiento incorporado y un filtro de alternancia de direcciones ayudan a descartar los movimientos más débiles y menos fiables. Análisis adaptativo de tendencias: La dirección de l
FREE

El indicador estándar de las Bandas de Bollinger se ha mejorado integrando indicaciones adicionales del indicador de Desviación Estándar (StdDev), que proporciona un filtro adicional para confirmar las señales de negociación. Además, el color de las líneas del indicador muestra el inicio de una tendencia, su desarrollo y agotamiento. Este indicador dispone de un bloque de señales que notifica al operador el inicio de la tendencia en cualquier marco temporal al que esté vinculado.
Ajustes Tipo d
FREE
Descripción del producto: Puntos Swing y Liquidez (MT5) Lo que hace:
Este indicador identifica automáticamente "Swing Highs" y "Swing Lows" (Fractales) significativos en su gráfico. Asume que estos puntos representan Liquidez ( donde descansan los Stop Loss y los Stop de Compra/Venta) o Zonas de Oferta y Demanda . Cuando se forma un Swing High, proyecta una Caja/Línea Roja a la derecha (Oferta/Resistencia). Cuando se forma un Swing Low, proyecta una Caja/Línea Verde a la derecha (Demanda/Soport

Presentamos el "Super Trend Filter Oscillator", su mejor compañero de trading diseñado para mejorar su análisis técnico y ayudarle a tomar decisiones informadas en los mercados financieros. Este innovador oscilador está diseñado para proporcionar información valiosa sobre las tendencias del mercado y los movimientos de los precios, ayudando a los operadores como usted a identificar posibles puntos de entrada y salida. Características: Identificación de tendencias: El Super Trend Filter Oscillato
FREE

El indicador está diseñado para mostrar los siguientes niveles de precios en el gráfico: Máximo y mínimo del día anterior. Máximo y mínimo de la semana anterior. Máximo y mínimo del mes anterior. Cada uno de los tipos de niveles es personalizable. En la configuración del indicador, puede establecer el estilo de la línea, el color de la línea, activar o desactivar los niveles separados.
Configuraciones ----Day------------------------------------------------- DayLevels - activar/desactivar los ni
FREE

Descripción General Candle Countdown es un indicador visual para MetaTrader 5 que muestra el tiempo restante hasta el cierre de la vela actual en tiempo real. El indicador presenta paneles de información adjuntos a las líneas de Oferta y Demanda, mostrando temporizadores de cuenta atrás, tipo de vela actual y otra información útil. Características principales 1. Visualización del tiempo de la vela Cuenta atrás : Tiempo hasta el cierre de la vela en formato MM:SS Tiempo transcurrido : Tiempo desd
FREE

This indicator works by plotting fractals on the chart as arrows that can be used as buy or sell signals. It is a great tool for both new and experienced traders as it provides a clear visual representation of the market and helps traders identify fractals. Although it repaints, it can be used quite effectively in conjunction with other tools to filter trading strategies.
We use this indicator in this way in our Royal Fractals EA, which you can purchase on the MQL5 Market: https://www.mql5.com
FREE

Account and Trading Dashboard Indicator
El **Account and Trading Dashboard** es un indicador personalizado de MetaTrader 5 (MT5) diseñado para proporcionar a los operadores una visión completa y en tiempo real de las métricas de su cuenta, estadísticas de negociación e indicadores técnicos directamente en el gráfico. Muestra datos financieros y de rendimiento esenciales en un panel que se puede arrastrar, minimizar y cerrar, mejorando la usabilidad sin saturar el espacio de trabajo. El indicado
FREE

El indicador Trail Stops Point muestra la desviación del precio actual en una distancia determinada. Ha sido desarrollado como un indicador adicional para Trail Stops por Custom Indicator , para proporcionar un simple seguimiento de una posición stop loss a una distancia especificada en puntos.
Parámetros del indicador Distancia - distancia del trailing stop en puntos. Números de tope: 0 - Soporte, 1 - Resistencia.
FREE

Este indicador ha sido diseñado a base del indicador Heiken Ashi. Ayuda al usuario elegir la dirección de la operación. Esta utilidad también tiene incorporada la función del aviso sonoro cuando aparece una nueva señal. Aparte, está disponible la función de avisos vía e-mail. Su dirección del e-mail, así como los parámetros del servidor SMTP tienen que estar indicados en los ajustes del terminal MetaTrader 5 (la pestaña "Correo electrónico"). Flecha azul arriba = Compra. Flecha roja abajo = Vent
FREE
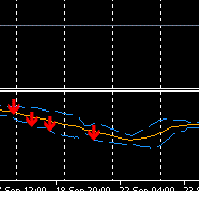
Cómo funciona la señal de venta 1. Condición de la banda de Bollinger La vela actual debe cerrar en o por encima de la banda superior de Bollinger . Esto indica posibles condiciones de sobrecompra . 2. Confirmación OBV (On Balance Volume) OBV debe estar cayendo → OBV_now < OBV_prev . Confirmación más fuerte: OBV decreciente durante 2-3 barras consecutivas. Esto muestra que la presión compradora se está debilitando . 3. Filtro ATR (Average True Range) El ATR actual debe estar por debajo de su med
FREE
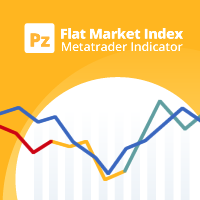
Este indicador calcula cuánto se ha movido un símbolo en términos relativos para encontrar mercados de tendencia o planos. Muestra qué porcentaje del último rango de precios es direccional. [ Guía de instalación | Guía de actualización | Solución de problemas | FAQ | Todos los productos ] Un valor de cero significa que el mercado es absolutamente plano Un valor de 100 significa que el mercado está en tendencia total La línea azul significa que el rango de precios es saludable. La línea roja sig
FREE

Visión general Harmonic Patterns MT5 es un indicador de análisis técnico diseñado para la plataforma MetaTrader 5. Identifica y muestra patrones de precios armónicos, como Butterfly, Cypher, Crab, Bat, Shark y Gartley, tanto en direcciones alcistas como bajistas. El indicador calcula los niveles de precios clave, incluidos los niveles de entrada, stop loss y tres niveles de toma de beneficios, para ayudar a los operadores a analizar los movimientos del mercado. Los elementos visuales y las alert

Forex 17 – Bollinger Bands Pure Sound Alert No Plots emite alertas sonoros cuando el precio supera la banda superior o inferior de las Bollinger Bands. Se generan sonidos distintos para rompimientos alcistas y bajistas, ayudando a identificar condiciones potencialmente sobrecompradas o sobrevendidas. Esta versión sin gráficos no dibuja ningún elemento visual en el gráfico. Los parámetros configurables incluyen el período de las bandas, la desviación y los intervalos entre alertas. El enfoque exc
FREE

El indicador "Matrix Series" es una herramienta de análisis técnico diseñada para identificar posibles zonas de soporte y resistencia mediante la visualización de las condiciones de sobrecompra/sobreventa y la dirección de la tendencia utilizando una combinación de datos de precios y parámetros personalizables, incorporando el Commodity Channel Index (CCI) para resaltar posibles puntos de reversión dentro del mercado.
Principales características del indicador Matrix Series: Zonas dinámicas : Ca
FREE

Indicador OBV altamente configurable.
Funciones: Funciones de alerta altamente personalizables (en niveles, cruces, cambios de dirección vía email, push, sonido, popup). Capacidad multi timeframe Personalización del color (en niveles, cruces, cambios de dirección) Opciones de interpolación lineal y modo de histograma Funciona en el probador de estrategias en modo multi timeframe (también en fin de semana sin ticks) Niveles ajustables Parámetros:
OBV Timeframe : Puede establecer los timeframes
FREE

Busca fuertes movimientos de precios y dibuja niveles al finalizarlos.
Usted mismo determina la fuerza del movimiento especificando en los ajustes el número de puntos y el número de velas del mismo color seguidas en una dirección.
Hay 2 tipos de construcción en la configuración: extrenum - alto / bajo close - precio de cierre También puede ajustar el número de niveles mostrados y el número de velas para los cálculos.
Por defecto, los ajustes indican 5 niveles para 360 velas.
Es decir, se ca
FREE

El indicador DailyWeeklyMarkers ayuda a los operadores a visualizar las semanas de negociación marcando claramente el inicio de cada día y semana en el gráfico. Traza líneas verticales de separación para cada día (incluidos los fines de semana si está activado) y destaca el comienzo de las nuevas semanas de negociación con líneas dobles para mayor claridad. Esto facilita el análisis de la acción del precio en contextos diarios y semanales. ¿Para quién es este indicador? Swing Traders - Ayuda a i
FREE

Este indicador de ticks dibuja barras sintéticas que contienen un número determinado de ticks. Parámetros: Precio de la opción - precio de la opción. Puede ser Bid, Ask o (Ask+Bid)/2. número de ticks a identificar Barra - número de ticks que forman OHLC. recuento de niveles de precios - número de niveles de precios mostrados (no se muestran niveles si se establece en 0 o en un valor inferior). Barra calculada - número de barras en el gráfico. Índices del buffer: 0 - OPEN, 1 - HIGH, 2 - LOW, 3 -
FREE
El indicador Trendline Automatic es una herramienta avanzada de análisis técnico diseñada específicamente para ayudar a los operadores a identificar niveles críticos en los mercados financieros mediante el trazado automático de líneas de tendencia de soporte y resistencia en los gráficos de precios. Gracias a sus funciones automáticas, este indicador ahorra tiempo y esfuerzo a los operadores a la hora de analizar los movimientos de los precios, lo que les permite centrarse en tomar mejores decis
FREE

El indicador "Pure View " está diseñado para mostrar y ocultar rápidamente indicadores en el gráfico. Descripción
1. Actualmente Pure View funciona con los indicadores Estocástico, MACD, RSI 2. La visualización y ocultación de indicadores se produce mediante teclas de acceso rápido 3. La combinación de teclas Shift + C mostrará u ocultará el indicador "Estocástico" en el gráfico 4. La combinación de teclas Shift + V mostrará u ocultará el indicador "RSI" en el gráfico 5. La combinación de teclas
FREE

El indicador ShowSessions para MT5 muestra hasta dos intervalos de tiempo, auto-seleccionados, para un número libremente elegido de días pasados y algunos días futuros. Los fines de semana se marcan con una línea vertical roja adicional. El indicador facilita el backtesting de estrategias, pero también se puede utilizar para el trading diario. Tenga en cuenta que la hora del servidor no siempre se corresponde con la hora real.
FREE

El indicador imprime la línea de la media larga cuando las medias media y corta están confinadas dentro de 1 ATR (average tru range) de la media larga. Tras periodos de congestión, los precios se mueven con fuerza en una dirección. Este indicador no proporciona puntos de entrada, sólo muestra que las medias están bastante próximas. Parámetros: Periodmalongo: Periodo de la media larga. Periodmamedio: Periodo de la segunda media. Periodmamedio2: Periodo de la tercera media. Periodmacurto: Periodo
FREE
Este es un indicador para ayudar a un operador en la detección de tendencias de cualquier mercado. Este indicador se compone de una mezcla de medias móviles para la detección de tendencias. Sé que ningún indicador es 100% exacto, pero esto podría ayudarle. Lo estoy dando de forma gratuita y también, hay ajustes importantes en la última captura de pantalla. Este indicador debe estar en una ventana separada después de configurarlo en el gráfico.
FREE

OrderFlow WMA v2.0 - Indicador de tendencia ponderada por flujo OrderFlow WMA v2.0 es una media móvil ponderada por flujo de nueva generación diseñada para ir más allá de la lógica tradicional EMA/WMA integrando la presión del volumen, la intención de las velas y la aceleración del impulso en una única línea de tendencia adaptable. A diferencia de las medias móviles estándar que tratan todas las velas por igual, OrderFlow WMA ajusta dinámicamente su ponderación utilizando: Normalización Tick-Vol
FREE

Desbloquee el poder del análisis de tendencias con el indicador Candle Trend Bars, su herramienta de referencia para identificar y comprender las tendencias del mercado como nunca antes. Este innovador indicador transforma los tradicionales gráficos de velas en una representación dinámica y visualmente intuitiva de las tendencias del mercado. Características principales: Claridad de tendencias: Obtenga una visión clara y concisa de las tendencias del mercado con barras codificadas por colores qu
FREE

VR ATR Pro es un indicador técnico diseñado para determinar niveles objetivo basados en el análisis estadístico de períodos comerciales anteriores. Se fundamenta en el cálculo matemático del movimiento promedio del precio durante un período de tiempo seleccionado. Principio de funcionamiento del indicador, basado en estadísticas El funcionamiento del indicador se basa en observar el comportamiento diario del precio: cada período comercial se caracteriza por una cierta amplitud de movimiento — el

Pivote eXtreme El Pivote es un nivel de referencia que sirve para que el inversor memorice el potencial de soporte y resistencia intradía en cualquier momento.
En este sistema, el nivel pivote se compone de P (Punto Pivote utama) , R1-R13 (Resistencia) , y S1-S13 (Soporte) . Punto Pivote (P) El punto de pivote más alto, calculado a partir del rango de precios (Máximo + Mínimo + Cierre) / 3 . Se utiliza para calcular el precio : Si el precio de cierre es P → tren alcista. Si el precio en la zona
FREE

El indicador realiza cálculos basados en los datos obtenidos de una de las siete (7) medias móviles y colorea el gráfico.
Las medias móviles simples son aquellas que sólo tienen un parámetro de cálculo importante: el periodo.
El desplazamiento del indicador no se utiliza.
Existe un truco de desplazamiento que se utiliza para suavizar el resultado de los cálculos. Puede ver los cambios si reduce este parámetro a 1 (valor mínimo).
truco de desplazamiento debe ser siempre menor que el valor de
FREE

El indicador Previous High Low Levels muestra el máximo y el mínimo de la vela anterior de un marco temporal superior seleccionado. Esto ayuda a los operadores a identificar zonas clave de soporte y resistencia mientras operan en marcos temporales inferiores. Características:
Traza el máximo y mínimo anterior de un marco temporal superior
Funciona en todos los marcos temporales e instrumentos
Ayuda a identificar fuertes niveles de soporte y resistencia
Ligero y no se vuelve a pintar
FREE

## FutureSight CCI - Ver más allá, operar por delante
### Qué es FutureSight CCI es un oscilador de nueva generación que actualiza el clásico CCI. Combina la detección de tendencias, señales cruzadas, Bandas de Bollinger, alertas y registros en una poderosa herramienta.
Combinado con el **generador de gráficos de segundos**, le ofrece un control total del mercado a muy corto plazo. Perfecto para scalping y opciones binarias donde la velocidad y la precisión son lo más importante.
---
###
FREE

El indicador Matriz de correlaciones muestra la correlación real entre los instrumentos seleccionados. La configuración por defecto es de 28 pares de divisas, oro y plata, pero el indicador puede comparar cualquier otro símbolo.
Interpretación del indicador Correlación positiva (la correlación es superior al 80 %). Correlación negativa (la correlación es inferior al -80 %). Correlación débil o nula (correlación entre -80 % y 80 %).
Características principales El indicador muestra la correlació

El filtro de señales definitivo. Obtenga flechas claras y sin repintado solo cuando la tendencia en los marcos temporales M1, M5, M15 y H1 esté totalmente alineada, confirmando un fuerte impulso para scalping u operaciones a corto plazo. Descripción completa del producto Flechas sin repintado: Construido utilizando datos precisos de precios de cierre ( rates_total - 1 y iBarShift ), asegurando que las señales son definitivas y nunca cambian o desaparecen después del cierre de la barra. Lo que ve
FREE
El indicador Trend Duration Forecast MT5 está diseñado para estimar la duración probable de una tendencia alcista o bajista. Utilizando una Media Móvil Hull (HMA) para detectar cambios direccionales, rastrea la duración de cada tendencia histórica y calcula un promedio para pronosticar cuánto tiempo es estadísticamente probable que continúe la tendencia actual. Esto permite a los operadores visualizar tanto la fuerza de la tendencia en tiempo real como las posibles zonas de agotamiento con una

Uno de los conceptos más poderosos e importantes de las TIC es el Poder de 3. Explica las fases del IPDA (Algoritmo de Entrega de Precios Interbancarios). PO3 significa simplemente que hay 3 cosas que el algoritmo del creador de mercado hace con el precio:
Acumulación, Manipulación y Distribución
ICT nos dice cómo es importante identificar la expansión de la vela semanal y luego tratar de entrar por encima o por debajo de la apertura diaria, en la dirección de la expansión semanal.
Este práct

CandleAvg Pro: Indicador avanzado MT5 para un trading más inteligente Visualice medias móviles dinámicas directamente superpuestas en los candeleros con precisión. Características principales: Periodos de MA personalizables (SMA/EMA) para detectar tendencias. Señales codificadas por colores: Verde para cruces alcistas, rojo para cruces bajistas. Alertas en tiempo real de rupturas y retrocesos. Compatible con todos los plazos y pares. Aumente su ventaja - detecte entradas/salidas más rápido. ¡Sól
FREE
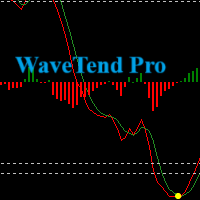
Necesita revisar la descripción de su producto para cumplir las políticas publicitarias que prohíben garantizar o insinuar beneficios. La descripción actual utiliza frases que podrían interpretarse como promesas de ganancias financieras, lo que infringe estas normas. Indicador Wave Trend Oscillator para MetaTrader 5 Descubra el indicador Wave Trend Oscillator , una sofisticada herramienta de análisis técnico para MetaTrader 5. Este indicador está diseñado para ayudar a los operadores a comprend

Libere el poder del análisis de mercado con precisión ¿Está preparado para llevar sus operaciones al siguiente nivel? El indicador "Perfil de Volumen Institucional" está aquí para potenciar sus decisiones de negociación como nunca antes. Características principales: Perfiles de volumen personalizados : Trace perfiles de volumen sin esfuerzo, simplemente añadiendo líneas horizontales o herramientas de Fibonacci en su gráfico de MetaTrader 5. No hay límite en el número de perfiles que puede crear.

El indicador estocástico doble RSI es un indicador de impulso basado en el oscilador estocástico y el índice de fuerza relativa (RSI). Se utiliza para ayudar a los operadores a identificar los mercados sobrecomprados y sobrevendidos, así como sus posibles señales de inversión. Este indicador es un indicador técnico de tipo oscilador que traza una línea que oscila dentro del rango de cero a 100. También tiene marcadores en los niveles 20 y 80 representados por una línea discontinua. El área por

Metatrader 5 tiene una joya oculta llamada Objeto Gráfico, casi desconocida para el común de los usuarios y escondida en un submenú dentro de la plataforma. Llamado Mini Chart, este objeto es una instancia en miniatura de un gráfico grande/normal que puede ser añadido/adjuntado a cualquier gráfico normal, de esta forma el Mini Chart estará ligado al Gráfico principal de una forma muy minimalista ahorrando una preciosa cantidad de estado real en su pantalla. Si no conoce el Mini Gráfico, pruébelo
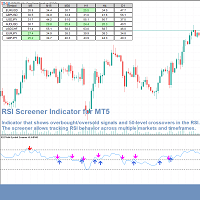
RSI Screener para MT5 es un indicador tipo tablero que muestra los valores del oscilador RSI (Índice de Fuerza Relativa) en diferentes instrumentos y marcos de tiempo seleccionados por el usuario. Además, el trader puede configurarlo para mostrar señales cuando el RSI está en condición de sobrecompra/sobreventa, cuando cruza estos niveles o cuando cruza el nivel 50, lo cual es importante en algunas estrategias. Es un indicador simple y fácil de configurar. Por sí solo, no debe utilizarse como un

Este indicador muestra el diferencial con opciones adicionales Simple y fácil de usar y totalmente personalizable: Visualización como Pipos o Pipetas El símbolo del gráfico puede ocultarse Se puede cambiar la visualización del texto Cambiar el color y el estilo del texto Añadir u ocultar un punto decimal Opciones de espaciado entre entradas Posiciones de pantalla por defecto Entradas de posición de pantalla
La versión Pro incluye : Cuadro de arrastrar y soltar en la pantalla Alerta cuando la s
FREE
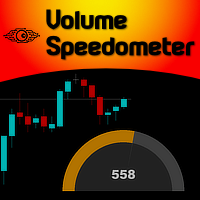
Imagínese la posibilidad de que la velocidad del volumen le sea presentada segundo a segundo en forma de velocímetro... Pues no imagines más... Bienvenido a la nueva creación de Minions Labs : Volumen Velocímetro . Volume Speedometer es una idea de Minions Labs que nació intentando mostrar en tiempo real lo que está ocurriendo con el Flujo de Volumen de las órdenes (o Ticks, si no tienes eso) durante el día. Este indicador fue creado para ser utilizado en operaciones Intradía y el objetivo es da

Arrow Trends - Señales de entrada claras para MetaTrader 5 Arrow Trends es un indicador de flecha profesional para MetaTrader 5 diseñado para proporcionar señales de entrada en la dirección de la tendencia predominante. Si usted está scalping, day trading, o swing trading, Arrow Trends le ayuda a identificar oportunidades fuertes. Características principales: Señales sin repintado: Una vez que aparece una flecha, nunca desaparece. Entradas centradas en la tendencia: Las señales se alinean con la

Ukeita Spike detector para Todos los Índices de Ganancia y Dolor
Ukeita Spike Detector es un indicador sensible a la tendencia especialmente diseñado para Índices de Ganancia y Dolor
Los índices sintéticos de Ganancia y Dolor están disponibles 24/7 en Weltrade , similar a los índices sintéticos (Boom y Crash) ofrecidos por Deriv Broker .
Esta potente herramienta ayuda a detectar picos entrantes para los índices Gain y Pain con gran precisión, por lo que es un gran complemento para cualquier e

Para aquellos que aprecian el enfoque de Richard Wyckoff para leer los mercados, en Minions Labs diseñamos una herramienta derivada - sí, derivada, pusimos nuestra propia visión y salsa en este indicador - que llamamos Waves PRO . Este indicador proporciona un ZigZag controlado por la volatilidad del mercado (ATR) para construir sus tramos, Y en cada tramo del ZigZag, presentamos las estadísticas de datos vitales sobre el mismo. Simple y objetivo. Este indicador también se deriva del gran libro
Indicador Slope Channel para MetaTrader
¿Buscas una herramienta para analizar tendencias del mercado que se adapte a cualquier estilo de trading? Slope Channel – ¡Tu asistente confiable para identificar movimientos de precios y niveles clave del mercado! ¿Qué es Slope Channel? Slope Channel es un indicador innovador que construye un canal inclinado en el gráfico, calculando automáticamente sus parámetros basados en extremos locales. Esta herramienta destaca la opción óptima del canal, pe
FREE

Los TRES DRAGONES es un indicador técnico que representa tres dragones chinos místicos volando a través del gráfico de precios:
1. El Dragón Verde (SeaGreen): - El más ágil y rápido de los tres - Reacciona rápidamente a los cambios de dirección del mercado - Suele liderar los movimientos
2. El Dragón Rojo (Tomate): - Se mueve con equilibrio entre velocidad y cautela - Confirma los movimientos iniciados por el Dragón Verde - Sus interacciones con el Dragón Verde pueden indicar oportunidades
3
FREE

Con este indicador el usuario puede determinar no sólo pivote como puntos de inflexión. El usuario puede detectar los límites de los rangos de negociación y los niveles de soporte-resistencia. En una fuerte tendencia de las señales inversas también nos da excelentes puntos de entrada. Configuración recomendada para el usuario: En el volumen de Attis: mirar hacia atrás período : 1 o (3) MA_Lenght 99. ( por supuesto se puede jugar con la configuración y obtener señales a medida ... como usted nece
FREE

Promedio del Rango de Sesiones: Calcular y Promediar el Rango Alto-Bajo de Sesiones Horarias Específicas en Múltiples Días. El Rango Promedio de Sesión es una herramienta sofisticada y precisa diseñada para calcular la volatilidad de sesiones de tiempo específicas dentro del día de negociación. Analizando meticulosamente el rango entre los precios máximos y mínimos de una sesión de negociación definida a lo largo de múltiples días, esta herramienta proporciona a los operadores un rango medio cla
FREE

Interactive AVWAP Pro - Análisis de estilo TradingView Interactive AVWAP Pro es el indicador más conveniente de Anchored Volume-Weighted Average Price (AVWAP) para MetaTrader 5/4. Olvídese de las herramientas estándar y torpes. Hemos traído la funcionalidad intuitiva de arrastrar y soltar de TradingView directamente a su terminal MT5/4. La ventaja de una herramienta profesional Deje de abarrotar los gráficos con líneas verticales y de juguetear con ajustes incómodos. Interactive AVWAP Pro le of

Indicador Balance of Power (BOP) con soporte multi-temporalidad, señales visuales personalizables y sistema de alertas configurable.
¿Qué es BOP? Balance of Power (BOP) es un oscilador que mide la fuerza de los compradores versus los vendedores comparando el cambio en el precio con el rango de la barra. El indicador se calcula como (Close - Open) / (High - Low), luego suavizado con una Media Móvil Simple (SMA). Los valores de BOP varían entre -1 y +1. Los valores positivos indican que los comp
FREE

El Índice de Fuerza Relativa presentado al mundo en 1978 por J. Welles Wilder Jr. en su libro "New Concepts in Technical Trading Systems " es ampliamente utilizado en todo el mundo de varias maneras, no sólo con el enfoque tradicional de los estados de Sobrecompra y Sobreventa, que en varios casos y dependiendo de los activos y marcos de tiempo simplemente ya no funciona . PERO, este indicador tiene su valor cuando se usa, por ejemplo, buscando divergencias entre su sistema de medición y los Pre

Indicador Menora (Todo en Uno).
Este es el indicador avanzado y premium para el Magic Trend, un indicador gratuito. Tiene 3 señales de salida impulsadas por diferentes condiciones de mercado. Este indicador tiene una doble función de trabajar como indicador y utilidad al mismo tiempo.
Especificaciones
1] 3 señales de salida a) Media Móvil Lenta con cambio de color - La MA tiene un cambio de color no repintado, lo que la hace perfecta para señales de entrada. b) Media Móvil Rápida (la línea d
FREE

El indicador de volumen es una herramienta excelente para medir el volumen de los ticks o la actividad del volumen real. Ayuda de forma rápida y sencilla a los operadores a evaluar el tamaño actual del volumen. El indicador para la clasificación del tamaño del volumen utiliza la media móvil y sus múltiplos. En consecuencia, la zona en la que se encuentra el volumen (en relación con la media móvil) se etiqueta como ultrabaja, baja, media, alta, muy alta o ultraalta. Este indicador puede calcular

Indicador SuperTrend para MetaTrader 5 El indicador SuperTrend es una herramienta clásica de seguimiento de tendencias diseñada para ayudar a los operadores a identificar la dirección actual del mercado con claridad y precisión. Basado en el Average True Range (ATR), se adapta dinámicamente a la volatilidad de los precios para delinear posibles niveles de soporte o resistencia en los mercados tendenciales. Características principales Visualización de tendencias
Muestra líneas de tendencia codi
FREE

QuantumAlert RSI Navigator es un indicador gratuito disponible para las plataformas MT4/MT5, su trabajo consiste en proporcionar "alertas" cuando el mercado está dentro de las regiones de "sobrecompra y sobreventa" en forma de señales de "compra o venta". Este indicador viene con muchas opciones de personalización mencionadas en la sección de parámetros a continuación, el usuario puede personalizar estos parámetros según sea necesario. Únase a nuestro grupo MQL5 , donde compartimos noticias y ac
FREE

El indicador mide y muestra la diferencia en el número de cambios de precios "Bid" y "Ask" en forma de indicadores digitales, analógicos y gráficos. Diseñado para la investigación de mercado y para determinar los momentos de cierre de posiciones durante el comercio de scalping con H1 o menos marco de tiempo. El uso con un marco de tiempo mayor no está prohibido, pero no es informativo debido a un gran número de valores acumulados. Teoría
Los precios "Bid" y "Ask" no cambian simultáneamente para
FREE
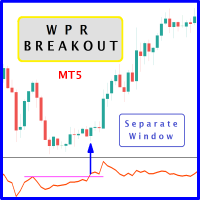
La probabilidad de un movimiento de precios más lejano aumenta cuando el oscilador Larry Williams Percentage Range "WPR" rompe a través de sus niveles históricos de resistencia en conjunción con la ruptura de los precios de los niveles de resistencia. Se recomienda encarecidamente confirmar la ruptura del precio con la ruptura del oscilador, ya que tienen efectos comparables a la ruptura del precio de los niveles de soporte y resistencia; una percepción similar se aplica a las operaciones cortas
FREE

Introducción al Planificador de Escenarios de Patrones Armónicos
El estado actual del mercado Forex puede pasar por muchos caminos de precios posibles diferentes para llegar a su destino futuro. El futuro es dinámico. Por lo tanto, la planificación de su comercio con el posible escenario futuro es un paso importante para su éxito. Para cumplir con un concepto tan poderoso, presentamos el Planificador de Escenarios de Patrones Armónicos, la primera herramienta predictiva de patrones armónicos en

Se trata de un indicador de propósito general que muestra líneas de color en intervalos de precios fijos y personalizables, introducidos como parámetros. Ofrece intervalos de precios universales, constantes y familiares que permiten un análisis de precios rápido y preciso de un par de divisas. Con los parámetros por defecto, este indicador implementa La Teoría de los Cuartos , como fue descrita originalmente por Ilian Yotov . [ Guía de instalación | Guía de actualización | Solución de problemas
FREE

Price Edge – Ve el precio antes de que se mueva el mercado En el trading, un solo segundo puede marcar la diferencia entre una operación rentable y una oportunidad perdida .
Con Price Edge en MetaTrader 5 (MT5) , nunca volverás a perder un tick. Price Edge no es solo un indicador, es tu ventaja en el trading.
Proporciona actualizaciones de precio en tiempo real , para que tus decisiones sean siempre precisas, rápidas y confiables. Por qué elegir Price Edge Live Price Indicator MT5 – ve el p
FREE

Este indicador calcula la diferencia entre la agresión de VENTA y la agresión de COMPRA ocurridas en cada Vela, graficando el saldo de cada una de ellas. Nota: Este indicador NO FUNCIONA para Brokers y/o Mercados SIN el tipo de agresión (COMPRA o VENTA).
No deje de probar nuestra versión Profesional con características configurables y alertas: Delta Agression Volume PRO
Configuración
Agresión por volumen (Volumen Real) o por número de operaciones (Tick Volumen) Inicio del cálculo del Delta de
FREE

The ONLY RSI Indicator You'll Ever Need - Works with ANY Broker, ANY Symbol! Finally, an RSI indicator that automatically adapts to YOUR broker's symbol naming conventions! Whether you trade Forex, Gold, Bitcoin, or Stock Indices - this universal indicator detects and monitors related symbols automatically. KEY FEATURES & BENEFITS UNIVERSAL COMPATIBILITY Auto-Detects Broker Patterns : Works with ANY broker suffix (.m, .pro, .raw, etc.) All Asset Classes : Forex, Metals (Gold/Silver), Crypto,
FREE
Indicador Supertrend con CCI para MQL5 - Descripción breve El indicador Supertrend con CCI es una potente herramienta de seguimiento de tendencias que combina Supertrend para la dirección de la tendencia y CCI para la confirmación del impulso. Esta combinación ayuda a reducir las señales falsas y mejora la precisión del comercio. Supertrend identifica las tendencias alcistas y bajistas basándose en la volatilidad.
El filtro CCI garantiza que las señales coincidan con el impulso del mercado.
FREE
El indicador VWAP, la forma abreviada de Volume Weighted Average Price, es similar a una media móvil pero tiene en cuenta el volumen de ticks de las velas. El indicador calcula la media móvil multiplicando el precio de cada vela por el volumen de ticks en la vela. Dicho cálculo pondera con mayor significación el precio donde se realizaron más transacciones.
Características: Estilo visual personalizable Periodo personalizable Facilidad de uso
FREE

Introducción del indicador:
El indicador dibuja la línea de tendencia y el histograma, tiene un pequeño retraso en el precio y no tiene funciones futuras, las señales no se desviarán. Cuando el mercado está bajo oscilaciones entre áreas, si el indicador aparece histograma rojo y verde, esta es una zona de precio bajo, si el indicador aparece histograma magenta y amarillo, esta es una zona de precio alto. También se puede utilizar para analizar la tendencia del mercado según la zona de precio a
FREE
Compruebe lo fácil y sencillo que es comprar un robot en la MetaTrader AppStore, la tienda de aplicaciones para la plataforma MetaTrader.
El Sistema de pago MQL5.community permite efectuar pagos con ayuda de PayPal, tarjeta bancaria y los sistemas de pago más populares. Además, le recomendamos encarecidamente testar el robot comercial antes de la compra, para así hacerse una idea más completa sobre él.
Está perdiendo oportunidades comerciales:
- Aplicaciones de trading gratuitas
- 8 000+ señales para copiar
- Noticias económicas para analizar los mercados financieros
Registro
Entrada
Si no tiene cuenta de usuario, regístrese
Para iniciar sesión y usar el sitio web MQL5.com es necesario permitir el uso de Сookies.
Por favor, active este ajuste en su navegador, de lo contrario, no podrá iniciar sesión.