Swing Trading ideas

Short opportunity on EURUSD
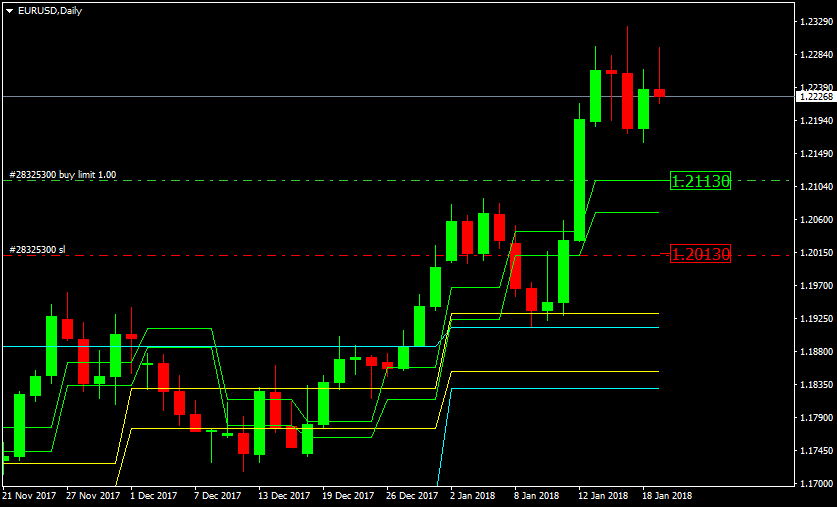
Long opportunity on EURUSD, the trend is your friend.
Long opportunity on EURUSD
if Weekly cluster hold it (Green),
else Wait for Monthly cluster (Yellow) or Quarter (Aqua), Below Yellow lines we are bearish
How do I put my chart image here from my MT5 Demo platform?
- Right-Click your chart.
- Select "Save As Picture..." from the context menu.
- Select "Active Chart (as is)" or "Active Chart" and select a size.
- Save the file as you see fit.
- On the forum post, select the "Image" icon; browse to where you saved the chart image and select it.
- Click on the "Insert" button, and you are done.
Thank you.
Long opportunity on EuroDollar.
1. Customized (not with the default parameters) Stochastic (i) running along the Top above Top Sell level plus (ii) above 89 plus (iii) new Trigger Up above 89 since initial Bottom BUY at 4.8 in early November.
2. 10 MA above 50 MA since mid November.
3. Customized (not with the default parameters) MACD (i) above Signal Line since 26 December plus (ii) Signal Line Trend reversed UP since 2nd January.
4. Price above 1.20120 Support level.
Stop Loss should be at 1.20500 - midway between 10 MA above and 50 MA below it - in this specific strong UP move.
Take Profit is impossible to estimate at the start trading the Daily chart and following the above customized indicators. Take Profit will be indicated in the future when the Stochastic crosses the Top Sell Level Down. For example: in mid April, 2017 the Stochastic and the 10 crossing 50 MAs plus the MACD (it went above Zero) gave a BUY signal at 1.07050. The Stochastic went to the TOP and stayed above the Top Sell level till the SELL when it crossed the Top Level Down on 22nd September at 1.19465 (UP 1241 Pips) - for five months. There is no indicator or calculation to estimate that at the time of the BUY. We have to simply trade the signals. That´s the only way for Take Profit on the Daily Chart and the above customized indicators.
I don´t trade the Daily Chart. I use it as a medium and longer term confirmation indicator.
- Free trading apps
- Over 8,000 signals for copying
- Economic news for exploring financial markets
You agree to website policy and terms of use
thread rules
only daily charts
any currency
must Sl and TP
try to explain trade reason
No bickering