Articles with examples of indicators developed in MQL5
The articles contain detailed explanation of the attached codes. Download and open them in MetaEditor and program together with the author while reading the article.
Add a new article

You are missing trading opportunities:
- Free trading apps
- Over 8,000 signals for copying
- Economic news for exploring financial markets
Registration
Log in
You agree to website policy and terms of use
If you do not have an account, please register

Price Action Analysis Toolkit Development (Part 17): TrendLoom EA Tool
As a price action observer and trader, I've noticed that when a trend is confirmed by multiple timeframes, it usually continues in that direction. What may vary is how long the trend lasts, and this depends on the type of trader you are, whether you hold positions for the long term or engage in scalping. The timeframes you choose for confirmation play a crucial role. Check out this article for a quick, automated system that helps you analyze the overall trend across different timeframes with just a button click or regular updates.

Introduction to MQL5 (Part 14): A Beginner's Guide to Building Custom Indicators (III)
Learn to build a Harmonic Pattern indicator in MQL5 using chart objects. Discover how to detect swing points, apply Fibonacci retracements, and automate pattern recognition.

Introduction to MQL5 (Part 4): Mastering Structures, Classes, and Time Functions
Unlock the secrets of MQL5 programming in our latest article! Delve into the essentials of structures, classes, and time functions, empowering your coding journey. Whether you're a beginner or an experienced developer, our guide simplifies complex concepts, providing valuable insights for mastering MQL5. Elevate your programming skills and stay ahead in the world of algorithmic trading!
Multiple indicators on one chart (Part 02): First experiments
In the previous article "Multiple indicators on one chart" I presented the concept and the basics of how to use multiple indicators on one chart. In this article, I will provide the source code and will explain it in detail.

William Gann methods (Part I): Creating Gann Angles indicator
What is the essence of Gann Theory? How are Gann angles constructed? We will create Gann Angles indicator for MetaTrader 5.

Implementing the Generalized Hurst Exponent and the Variance Ratio test in MQL5
In this article, we investigate how the Generalized Hurst Exponent and the Variance Ratio test can be utilized to analyze the behaviour of price series in MQL5.

Creating Custom Indicators in MQL5 (Part 6): Evolving RSI Calculations with Smoothing, Hue Shifts, and Multi-Timeframe Support
In this article, we build a versatile RSI indicator in MQL5 supporting multiple variants, data sources, and smoothing methods for improved analysis. We add hue shifts for color visuals, dynamic boundaries for overbought/oversold zones, and notifications for trend alerts. It includes multi-timeframe support with interpolation, offering us a customizable RSI tool for diverse strategies.

Creating an EMA Crossover Forward Simulation (Culmination): Interactive Synthetic Candles
This article finalizes the Forward Simulation Engine for MetaTrader 5 by calibrating synthetic candles to recent market volatility instead of using slope-only sizing. It samples average body, upper wick, and lower wick from closed bars, applies a sine-envelope with decay, proportional wicks, gaps between candles, and periodic counter-trend injections. The result is a live projection that advances one bar ahead, with code you can reuse for calibrated, anchor-based forward rendering and automatic cleanup.
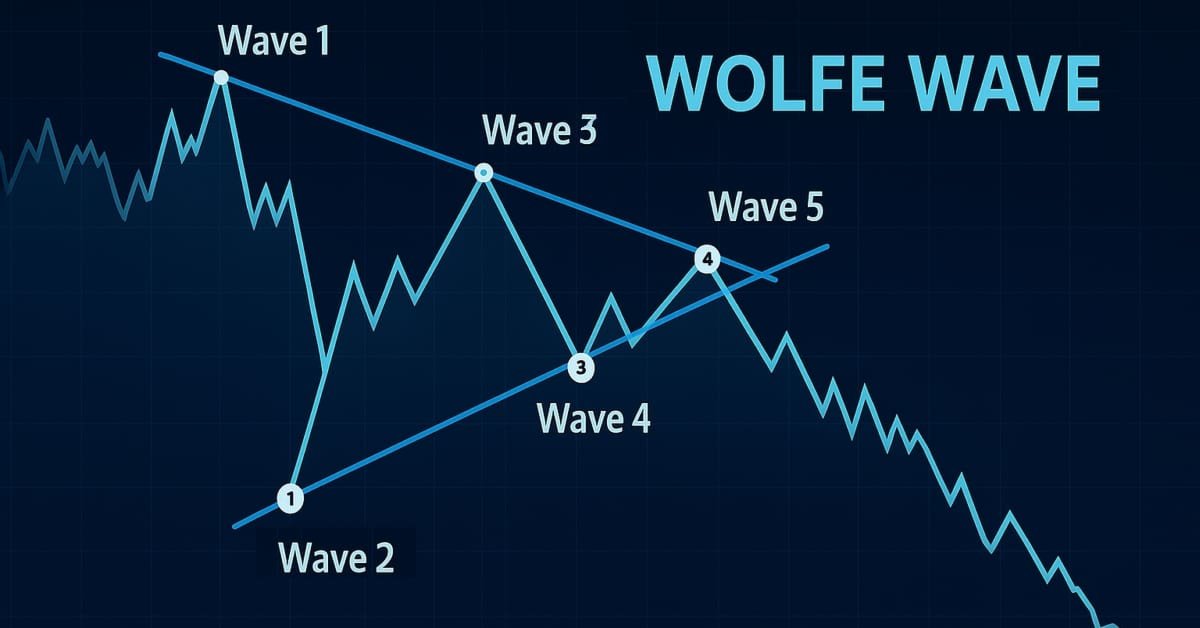
Introduction to MQL5 (Part 19): Automating Wolfe Wave Detection
This article shows how to programmatically identify bullish and bearish Wolfe Wave patterns and trade them using MQL5. We’ll explore how to identify Wolfe Wave structures programmatically and execute trades based on them using MQL5. This includes detecting key swing points, validating pattern rules, and preparing the EA to act on the signals it finds.

Price Action Analysis Toolkit Development (Part 73): Building a Weekend Gap Trading Signal System in MQL5
We extend the weekend gap toolkit with an indicator that turns gap structure into tradeable signals. When price confirms back into the gap, the indicator issues buy/sell arrows, sets TP at the opposite edge, and places SL using current-week extremes. It maintains non-repainting behavior, reconstructs historical signals, updates live, and provides EA-ready buffers for entry markers and TP/SL to support automation.

Larry Williams Market Secrets (Part 11): Detecting Smash Day Reversals with a Custom Indicator
We convert Larry Williams’ Smash Day reversal rules into a practical MQL5 indicator that flags confirmed setups with arrows. Step by step, the text shows buffer binding, plot properties, historical mapping, and real‑time updates inside OnCalculate. Adjustable lookback parameters and clean chart rendering help you detect valid reversals quickly while keeping final trade decisions discretionary and context‑driven.

Larry Williams Market Secrets (Part 14): Detecting Hidden Smash Day Reversals with a Custom Indicator
This article develops a practical MQL5 indicator that identifies Hidden Smash Day bars by strict numeric criteria and optional confirmation on the following session. We cover detection routines, buffer registration, and plot configuration to place arrows at valid bars. The approach delivers stable, non-repainting signals for historical testing and real-time monitoring.

Ready-made templates for including indicators to Expert Advisors (Part 2): Volume and Bill Williams indicators
In this article, we will look at standard indicators of the Volume and Bill Williams' indicators category. We will create ready-to-use templates for indicator use in EAs - declaring and setting parameters, indicator initialization and deinitialization, as well as receiving data and signals from indicator buffers in EAs.

Multiple indicators on one chart (Part 03): Developing definitions for users
Today we will update the functionality of the indicator system for the first time. In the previous article within the "Multiple indicators on one chart" we considered the basic code which allows using more than one indicator in a chart subwindow. But what was presented was just the starting base of a much larger system.

Price Action Analysis Toolkit Development (Part 66): Developing a Structured Head and Shoulders Scanner in MQL5
Head and Shoulders patterns are difficult to identify consistently in live market data due to noise and structural ambiguity. This article presents a structured, triangle-based MQL5 indicator that isolates pattern components, constructs the neckline, and validates formations using ATR, symmetry, and slope constraints. The system detects and draws standard and inverse patterns, assigns a quality score, and confirms breakouts with optional alerts, enabling consistent and rule-based chart analysis.

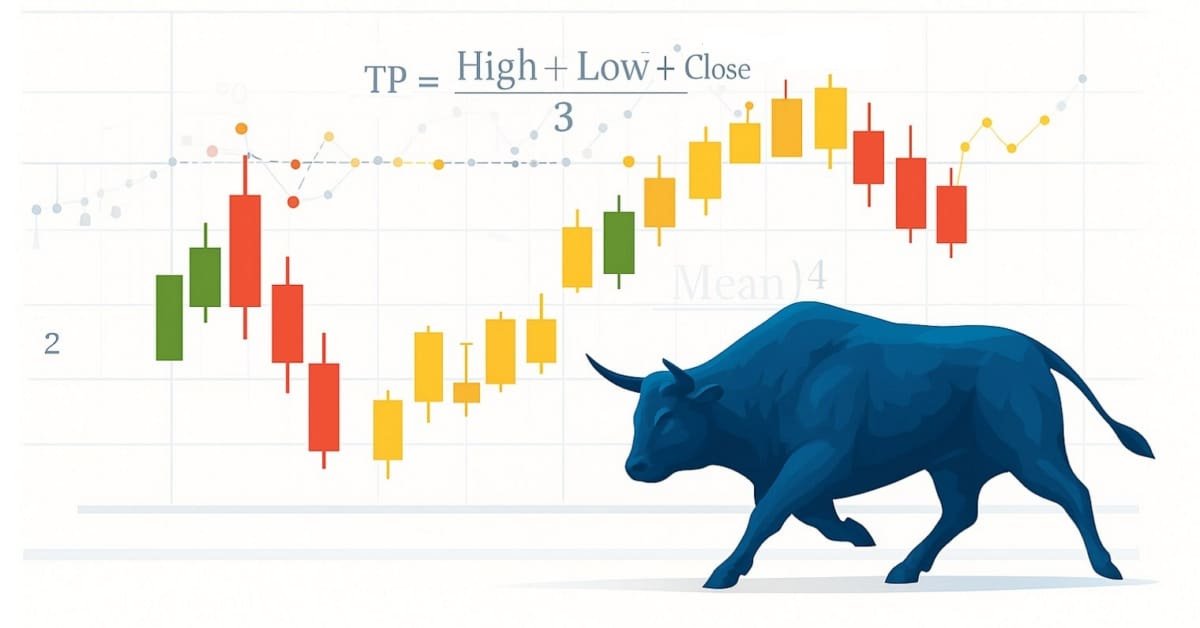
Price Action Analysis Toolkit Development (Part 10): External Flow (II) VWAP
Master the power of VWAP with our comprehensive guide! Learn how to integrate VWAP analysis into your trading strategy using MQL5 and Python. Maximize your market insights and improve your trading decisions today.
Price Action Analysis Toolkit Development (Part 41): Building a Statistical Price-Level EA in MQL5
Statistics has always been at the heart of financial analysis. By definition, statistics is the discipline that collects, analyzes, interprets, and presents data in meaningful ways. Now imagine applying that same framework to candlesticks—compressing raw price action into measurable insights. How helpful would it be to know, for a specific period of time, the central tendency, spread, and distribution of market behavior? In this article, we introduce exactly that approach, showing how statistical methods can transform candlestick data into clear, actionable signals.

From Novice to Expert: Automating Base-Candle Geometry for Liquidity Zones in MQL5
This article implements an MQL5 module that analyzes the lower‑timeframe bars inside each liquidity‑zone base candle. It detects swing points and applies objective rules to classify the internal structure as an ascending, descending, or symmetrical triangle; a rectangle; M; W; or undefined. The indicator displays geometry labels on the chart and adds the pattern to alerts, reducing manual lower‑timeframe inspection.

How to build and optimize a volatility-based trading system (Chaikin Volatility - CHV)
In this article, we will provide another volatility-based indicator named Chaikin Volatility. We will understand how to build a custom indicator after identifying how it can be used and constructed. We will share some simple strategies that can be used and then test them to understand which one can be better.

Encoding Candlestick Patterns (Part 1): An Alphabetical System for Signal Detection
We present a rule‑based alphabet for candlestick price action that maps measurable shape and direction to letter codes (A/a, H/h, E/e, G/g, D). The article shows an MQL5 implementation: classifying candles, building two‑bar sequences via permutations, and scanning charts with an indicator and alerts. Readers gain a practical template for objective pattern detection and systematic testing.
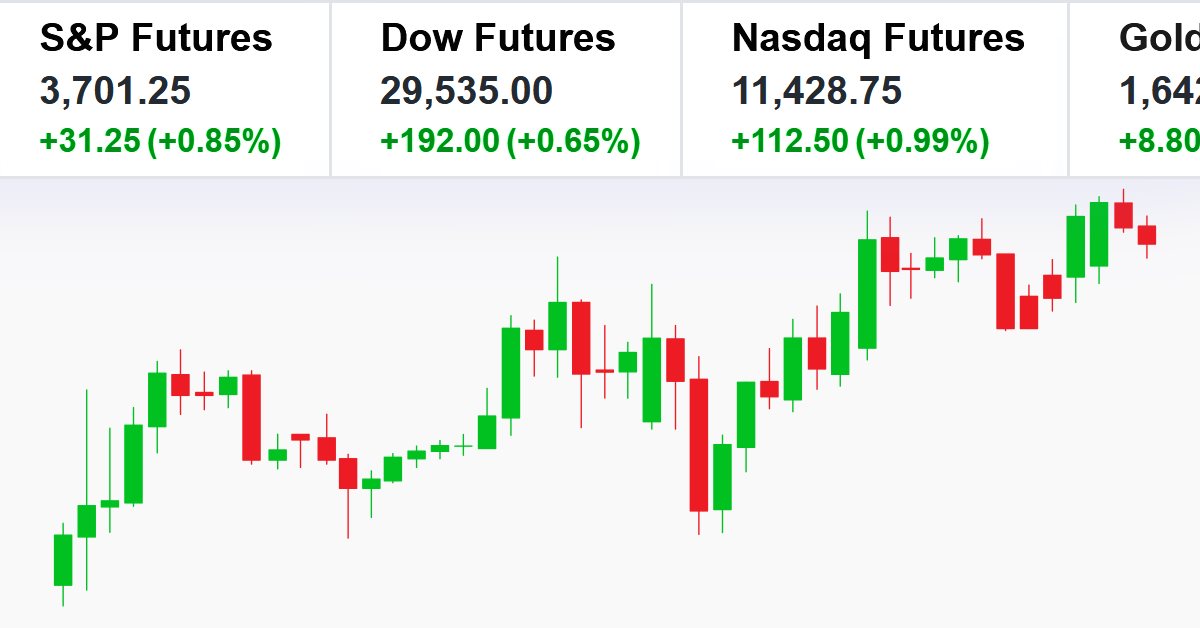
Creating a ticker tape panel: Basic version
Here I will show how to create screens with price tickers which are usually used to display quotes on the exchange. I will do it by only using MQL5, without using complex external programming.

Timeseries in DoEasy library (part 54): Descendant classes of abstract base indicator
The article considers creation of classes of descendant objects of base abstract indicator. Such objects will provide access to features of creating indicator EAs, collecting and getting data value statistics of various indicators and prices. Also, create indicator object collection from which getting access to properties and data of each indicator created in the program will be possible.

Developing a trading Expert Advisor from scratch (Part 9): A conceptual leap (II)
In this article, we will place Chart Trade in a floating window. In the previous part, we created a basic system which enables the use of templates within a floating window.

Price Action Analysis Toolkit Development (Part 21): Market Structure Flip Detector Tool
The Market Structure Flip Detector Expert Advisor (EA) acts as your vigilant partner, constantly observing shifts in market sentiment. By utilizing Average True Range (ATR)-based thresholds, it effectively detects structure flips and labels each Higher Low and Lower High with clear indicators. Thanks to MQL5’s swift execution and flexible API, this tool offers real-time analysis that adjusts the display for optimal readability and provides a live dashboard to monitor flip counts and timings. Furthermore, customizable sound and push notifications guarantee that you stay informed of critical signals, allowing you to see how straightforward inputs and helper routines can transform price movements into actionable strategies.

Creating Custom Indicators in MQL5 (Part 9): Order Flow Footprint Chart with Price Level Volume Tracking
This article builds an order-flow footprint indicator in MQL5 that aggregates tick-by-tick volume into quantized price levels and supports Bid vs Ask and Delta display modes. A canvas overlay renders color-scaled volume text aligned with the candles and updates on every tick. You will learn sorting of price levels, max-value normalization for color mapping, and responsive redraws on zoom, scroll, and resize to read volume distribution and aggressor dominance inside each bar.

Developing a trading Expert Advisor from scratch (Part 13): Time and Trade (II)
Today we will construct the second part of the Times & Trade system for market analysis. In the previous article "Times & Trade (I)" we discussed an alternative chart organization system, which would allow having an indicator for the quickest possible interpretation of deals executed in the market.

Timeseries in DoEasy library (part 48): Multi-period multi-symbol indicators on one buffer in a subwindow
The article considers an example of creating multi-symbol multi-period standard indicators using a single indicator buffer for construction and working in the indicator subwindow. I am going to prepare the library classes for working with standard indicators working in the program main window and having more than one buffer for displaying their data.

Cycles and Forex
Cycles are of great importance in our lives. Day and night, seasons, days of the week and many other cycles of different nature are present in the life of any person. In this article, we will consider cycles in financial markets.

Price Action Analysis Toolkit Development (Part 31): Python Candlestick Recognition Engine (I) — Manual Detection
Candlestick patterns are fundamental to price-action trading, offering valuable insights into potential market reversals or continuations. Envision a reliable tool that continuously monitors each new price bar, identifies key formations such as engulfing patterns, hammers, dojis, and stars, and promptly notifies you when a significant trading setup is detected. This is precisely the functionality we have developed. Whether you are new to trading or an experienced professional, this system provides real-time alerts for candlestick patterns, enabling you to focus on executing trades with greater confidence and efficiency. Continue reading to learn how it operates and how it can enhance your trading strategy.

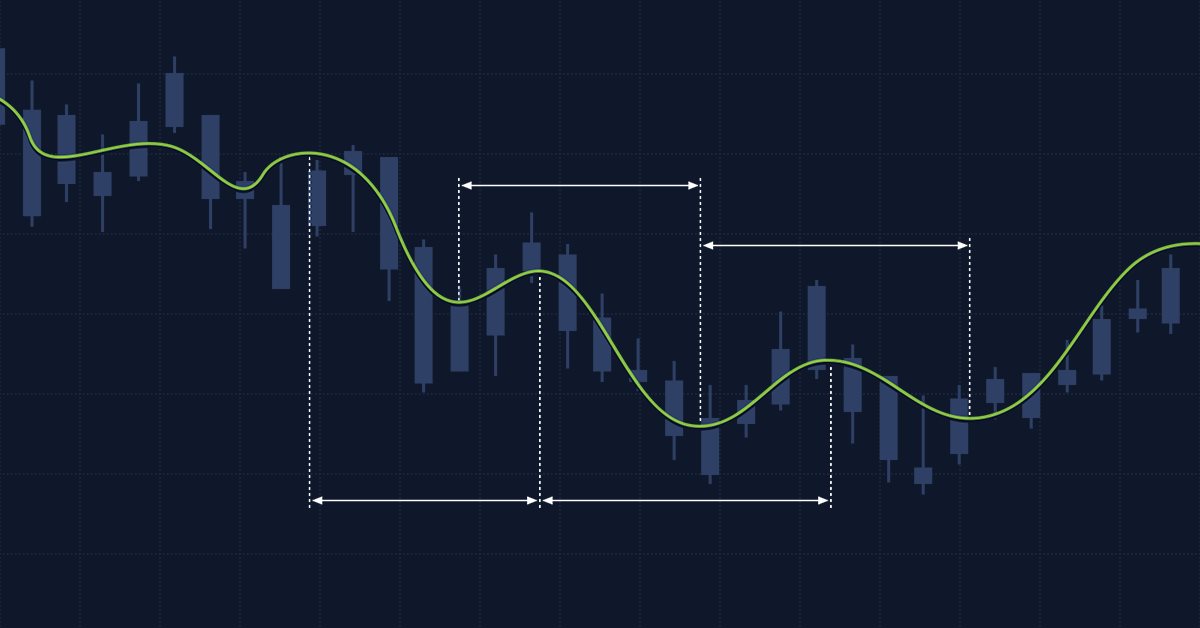
Swing Extremes and Pullbacks in MQL5 (Part 2): Automating the Strategy with an Expert Advisor
Built on lower-timeframe market structure, and then orchestrated on the higher-timeframe, this indicator detects swing extremes where price becomes statistically vulnerable to reversal. It visualizes overextension and pullback zones, offering early insight into mean-reversion behavior.

Color buffers in multi-symbol multi-period indicators
In this article, we will review the structure of the indicator buffer in multi-symbol, multi-period indicators and organize the display of colored buffers of these indicators on the chart.

Introduction to MQL5 (Part 3): Mastering the Core Elements of MQL5
Explore the fundamentals of MQL5 programming in this beginner-friendly article, where we demystify arrays, custom functions, preprocessors, and event handling, all explained with clarity making every line of code accessible. Join us in unlocking the power of MQL5 with a unique approach that ensures understanding at every step. This article sets the foundation for mastering MQL5, emphasizing the explanation of each line of code, and providing a distinct and enriching learning experience.

Price Action Analysis Toolkit Development (Part 23): Currency Strength Meter
Do you know what really drives a currency pair’s direction? It’s the strength of each individual currency. In this article, we’ll measure a currency’s strength by looping through every pair it appears in. That insight lets us predict how those pairs may move based on their relative strengths. Read on to learn more.
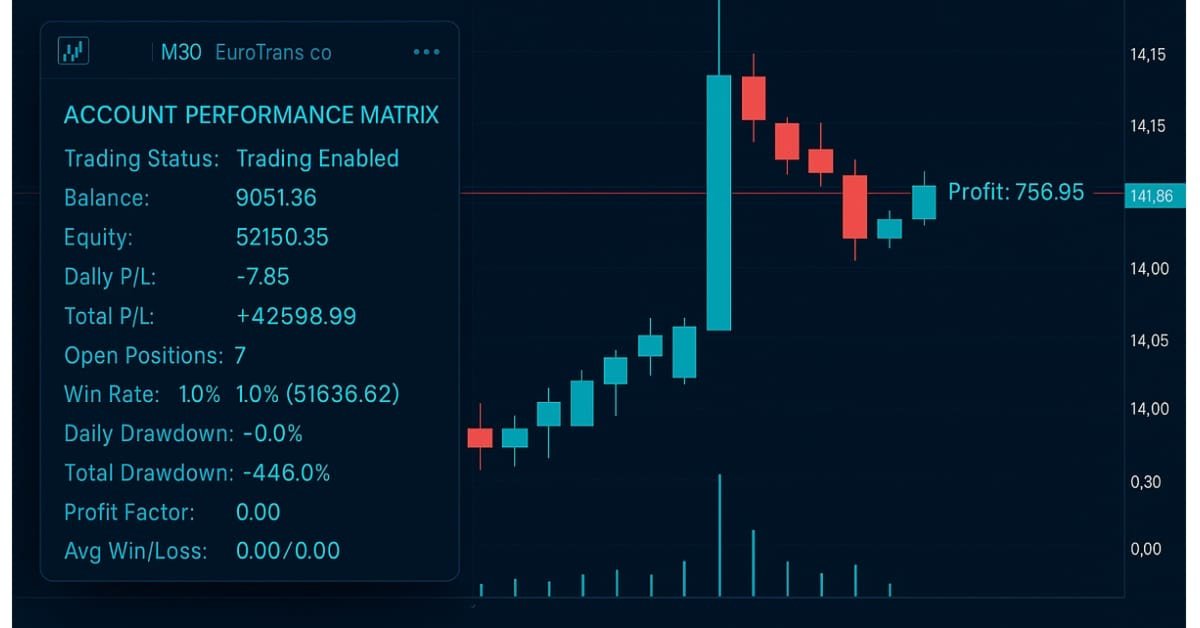
Developing A Custom Account Performance Matrix Indicator
This indicator acts as a discipline enforcer by tracking account equity, profit/loss, and drawdown in real-time while displaying a performance dashboard. It can help traders stay consistent, avoid overtrading, and comply with prop-firm challenge rules.

Implementing the Janus factor in MQL5
Gary Anderson developed a method of market analysis based on a theory he dubbed the Janus Factor. The theory describes a set of indicators that can be used to reveal trends and assess market risk. In this article we will implement these tools in mql5.
Timeseries in DoEasy library (part 47): Multi-period multi-symbol standard indicators
In this article, I will start developing the methods of working with standard indicators, which will ultimately allow creating multi-symbol multi-period standard indicators based on library classes. Besides, I will add the "Skipped bars" event to the timeseries classes and eliminate excessive load from the main program code by moving the library preparation functions to CEngine class.
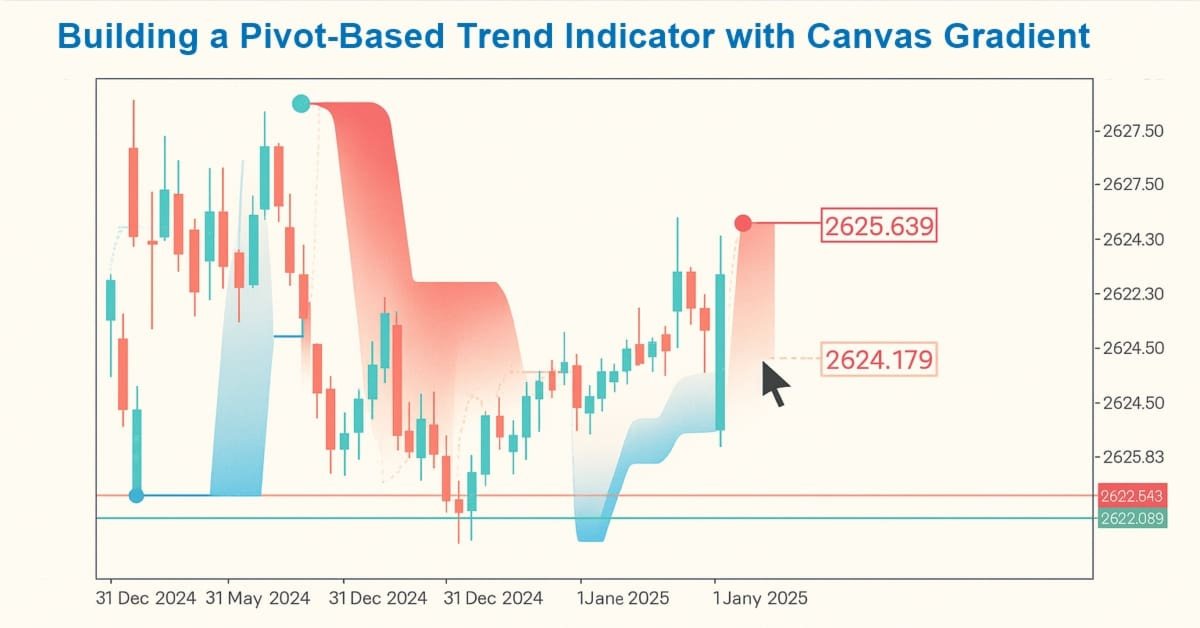
Creating Custom Indicators in MQL5 (Part 1): Building a Pivot-Based Trend Indicator with Canvas Gradient
In this article, we create a Pivot-Based Trend Indicator in MQL5 that calculates fast and slow pivot lines over user-defined periods, detects trend directions based on price relative to these lines, and signals trend starts with arrows while optionally extending lines beyond the current bar. The indicator supports dynamic visualization with separate up/down lines in customizable colors, dotted fast lines that change color on trend shifts, and optional gradient filling between lines, using a canvas object for enhanced trend-area highlighting.

From Novice to Expert: Auto-Geometric Analysis System
Geometric patterns offer traders a concise way to interpret price action. Many analysts draw trend lines, rectangles, and other shapes by hand, and then base trading decisions on the formations they see. In this article, we explore an automated alternative: harnessing MQL5 to detect and analyze the most popular geometric patterns. We’ll break down the methodology, discuss implementation details, and highlight how automated pattern recognition can sharpen a trader's market insights.

Developing a trading Expert Advisor from scratch (Part 14): Adding Volume At Price (II)
Today we will add some more resources to our EA. This interesting article can provide some new ideas and methods of presenting information. At the same time, it can assist in fixing minor flaws in your projects.

Example of new Indicator and Conditional LSTM
This article explores the development of an Expert Advisor (EA) for automated trading that combines technical analysis with deep learning predictions.