
Price Action Analysis Toolkit Development (Part 66): Developing a Structured Head and Shoulders Scanner in MQL5

Contents
Introduction
Recognizing a Head and Shoulders pattern by eye is straightforward; making that recognition consistent and automatable is not. In live markets, shoulders are rarely symmetrical, necklines are often sloped, and market noise makes the boundaries of the formation unclear. When translating this into code, the challenge becomes even more apparent: without strict rules—what defines a shoulder, how dominant the head must be, how much neckline tilt is acceptable, and what minimum size is valid relative to volatility—the detector either misses valid setups or produces excessive false signals.
This article addresses that problem by introducing a structured, triangle-based detection model. Instead of loosely interpreting price swings, the model isolates the left shoulder, head, and right shoulder inside bounded triangular regions and validates them using measurable criteria. These include geometric constraints, ATR-based size normalization, symmetry checks, neckline slope limits, and breakout confirmation.
By the end of this article, you will have a complete MQL5 indicator capable of detecting and visualizing Head and Shoulders patterns in real time.
Understanding the Head and Shoulders Patterns
The Head and Shoulders pattern is a classical price action formation that signals a potential reversal in market direction. It typically develops after a sustained trend and reflects a gradual transition in control—from buyers to sellers in a bearish scenario, or from sellers to buyers in its inverse form. While the pattern is widely recognized, consistently defining and validating it—especially in code—remains a significant challenge.
Structural Components
The pattern is composed of three primary price formations that must appear in sequence:
1. Left Shoulder
The structure begins with a peak formed during an active trend. At this stage, market conditions still support continuation, and the move appears consistent with the prevailing direction.
2. Head
The head forms as a higher peak that exceeds the left shoulder. This is the highest point in the pattern and a critical requirement for structural validity. A weak or indistinct head compromises the reliability of the entire formation.
3. Right Shoulder
The right shoulder develops as a lower peak relative to the head. This phase reflects a reduction in momentum, where the market fails to sustain the strength required to create a new high.
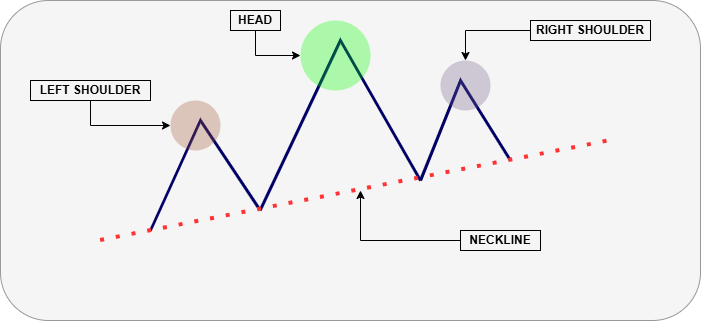
These three components define the main structure: a dominant central peak surrounded by two weaker formations, indicating a loss of trend strength.
The Neckline
The neckline is the structural boundary that connects the lowest points between the shoulders and the head. It serves as the reference level for confirmation and plays a central role in validating the pattern.
The neckline may appear in different forms:
- Horizontal
- Upward sloping
- Downward sloping
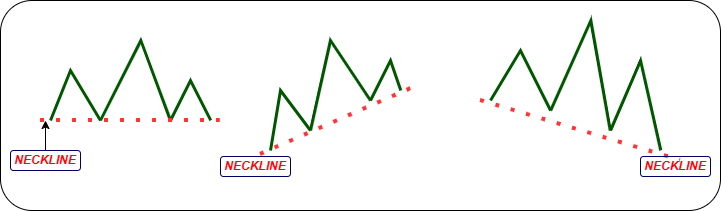
Each variation is technically valid. However, the slope can influence how price interacts with the level and how the breakout unfolds. Regardless of its orientation, the neckline defines the transition point between continuation and reversal.
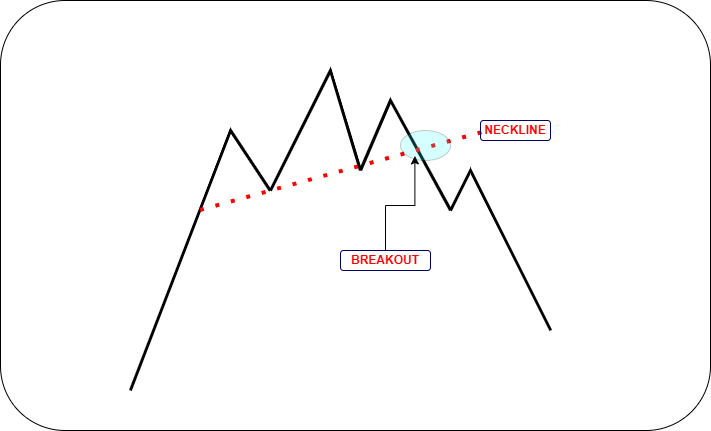
Confirmation and Market Transition
The pattern remains incomplete until price breaks the neckline. This breakout confirms that the underlying trend structure has weakened and that a reversal phase may be underway.
The progression toward this confirmation follows a clear sequence:
- The left shoulder forms under strong trend conditions
- The head reflects an attempt to continue the trend
- The right shoulder signals weakening participation
This sequence captures the shift in market dynamics, where dominant pressure begins to fade and opposing forces gain control.
Inverse Head and Shoulders

The inverse variation follows the same structural principles but typically forms after a downward trend. Instead of peaks, the pattern is composed of three consecutive valleys, where the middle valley (the head) is lower than the two surrounding valleys (the shoulders).
This formation is traditionally interpreted as a bullish reversal signal, indicating a potential shift from a bearish to a bullish market phase. The neckline is constructed by connecting the highs between the valleys, and confirmation occurs when the price breaks above this level.
However, in certain market conditions, particularly within a broader uptrend, the same structure can emerge during a corrective phase. In such cases, the inverse Head and Shoulders may act as a continuation pattern, signaling the resumption of the prevailing bullish trend rather than a full reversal.
Implications for Implementation
Although the pattern is straightforward in theory, translating it into a reliable detection system introduces complexity. The primary challenge lies in enforcing structure:
- Defining what qualifies as a valid shoulder
- Ensuring the head is clearly dominant
- Constructing the neckline consistently across varying market conditions
Without strict structural rules, detection becomes subjective and prone to error. This limitation is what motivates the structured approach introduced in the next section, where the pattern is defined and validated using a controlled, rule-based model in MQL5.
MQL5 Implementation
In this section, we will take a step-by-step approach to converting the theory discussed in the previous section into an MQL5 indicator. We will begin with a design overview to outline the core logic of the system, followed by the implementation steps where the concept is translated into code.
System Overview
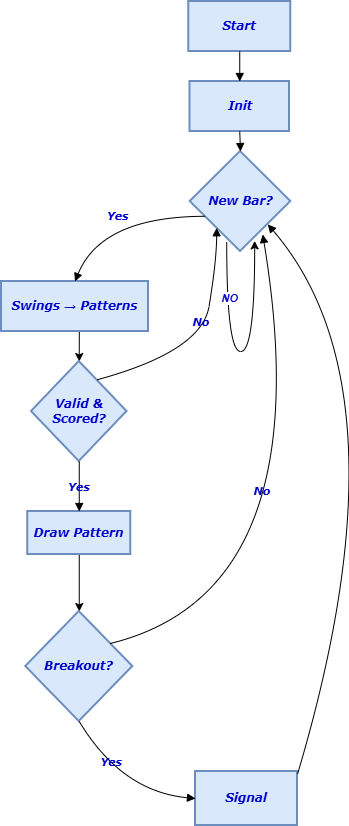
The indicator identifies swing highs and lows, validates candidate structures using geometric and ATR-based rules, and visualizes confirmed patterns using triangles and a neckline. When a breakout occurs, the system optionally displays a directional arrow and applies color-coded text labels to highlight the signal.
The indicator logic can be represented as a pipeline from swing detection to signal generation. The flowchart below illustrates how raw price data progresses through swing detection, pattern validation, scoring, and finally signal generation.
Properties and Basic Setup
First, define the indicator properties so MetaTrader 5 can apply the correct runtime behavior. Set #property indicator_chart_window to draw the indicator on the main chart. Set indicator_buffers 0 and indicator_plots 0 to disable traditional plots and buffers. Instead, the approach relies on graphical objects such as labels, trendlines, and arrows to visualize Head & Shoulders patterns. This setup allows for maximum flexibility, enabling the creation of a visually intuitive and customizable overlay that enhances pattern recognition.
#property copyright "Copyright 2026, MetaQuotes Ltd."
#property link      "https://www.mql5.com/en/users/lynnchris"
#property version   "1.00"
#property indicator_chart_window
#property indicator_buffers 0
#property indicator_plots   0
Structures Definition
Next, two essential data structures are introduced: SwingPoint and Pattern. The SwingPoint structure captures significant market reversals, storing information about swing highs or lows along with their bar index, price, and timestamp. These points are fundamental because pattern formation depends on identifying these critical turning points accurately.
//+------------------------------------------------------------------+
//| Structures Definition                                            |
//+------------------------------------------------------------------+
struct SwingPoint
  {
   int               barIndex;
   double            price;
   bool              isHigh;
   datetime          time;
  };

struct Pattern
  {
   int               id;
   bool              isBearish;
   int               lsIndex;
   int               headIndex;
   int               rsIndex;
   int               neck1Index;
   int               neck2Index;
   double            neckSlope;
   double            neckIntercept;
   double            headPrice;
   double            neckPriceAtHead;
   double            height;
   double            score;
   bool              signalGenerated;
   datetime          signalTime;
   int               signalBar;
   datetime          detectionTime;
  };
//+------------------------------------------------------------------+
The pattern structure encompasses all attributes of a detected Head & Shoulders or inverse pattern. It records the pattern's type (bearish or bullish), the indices of the swing points forming the pattern, the slope and intercept of the neckline, height, score, and flags for signal management. Organizing data in this way facilitates systematic analysis, precise visualization, and effective signal generation, ensuring that each pattern's geometric and temporal features are well-managed.
User Inputs (Parameters)
The indicator's flexibility is achieved through numerous input parameters, which can be adjusted according to specific trading strategies or market conditions. For instance, SwingStrength controls how many bars are examined on each side when detecting swings, balancing sensitivity against noise. ShoulderTolerance sets the permissible deviation in shoulder symmetry, affecting pattern strictness. The minimal pattern height in ATR units is controlled by MinPatternSizeATR, ensuring patterns are significant relative to current volatility.
//+------------------------------------------------------------------+
//| User Inputs                                                      |
//+------------------------------------------------------------------+
input int      SwingStrength       = 3;
input double   ShoulderTolerance   = 0.02;
input double   MinPatternSizeATR   = 1.5;
input double   MaxNecklineSlopeDeg = 30.0;
input bool     AllowDescendingNeck = true;
input int      MinTimeSymmetry     = 50;
input bool     ShowNeckline        = true;
input bool     ShowBreakoutArrow   = true;
input bool     AlertOnNewPattern   = true;
input int      MinSwingDistance    = 10;
input int      MinPatternDistance  = 50;
input double   MinScoreThreshold   = 60.0;
input color    PatternFillColor    = clrYellow;
input int      PatternOpacity      = 60;
//+------------------------------------------------------------------+
Additional parameters like MaxNecklineSlopeDeg restrict the allowable angle of the neckline, filtering out unrealistic formations. Boolean toggles such as AllowDescendingNeck, ShowNeckline, ShowBreakoutArrow, and AlertOnNewPattern provide control over the visual and alert features, allowing customization for different trading environments. These settings are designed to make the detection process adaptable, precise, and user-friendly.
Global Variables and Handles
Managing the indicator’s data and resources involves declaring global variables. An array g_swings stores all detected swing points, while g_patterns keeps track of the patterns identified during analysis. The handle g_atrHandle is used to retrieve ATR data, which measures market volatility—a key element for normalizing pattern sizes and filtering out insignificant formations.
//+------------------------------------------------------------------+
//| Global Variables                                                 |
//+------------------------------------------------------------------+
SwingPoint    g_swings[];
Pattern       g_patterns[];
int           g_atrHandle = INVALID_HANDLE;
string        g_prefix = "HS_";
int           g_nextPatternId = 1;
//+------------------------------------------------------------------+
A string prefix, such as g_prefix, helps organize all graphical objects created by the indicator, simplifying their management and deletion. The variable g_nextPatternId ensures each detected pattern receives a unique identifier, which is useful for visualization and signal management. Together, these variables support reliable, real-time analysis and visualization.
Helper Function: Get ATR
A dedicated function retrieves the current ATR value using CopyBuffer() with the ATR handle. This value is crucial because ATR provides a normalized measure of market volatility, allowing pattern detection to scale appropriately. If data retrieval fails, the function returns zero, preventing erroneous calculations. Incorporating ATR ensures that pattern significance is adaptive, filtering out formations that are too small or insignificant in volatile or quiet markets.
//+------------------------------------------------------------------+
//| Get ATR Value                                                    |
//+------------------------------------------------------------------+
double GetATR()
  {
   double atr[1];
   return (CopyBuffer(g_atrHandle, 0, 0, 1, atr) == 1) ? atr[0] : 0;
  }
//+------------------------------------------------------------------+
Helper Function: Find Lowest Swing
To identify the lowest swing point within a specified range, the indicator uses FindLowestSwing(). This function iterates through the stored swing points, ignoring swing highs, and compares their prices to find the minimum. Accurate identification of these lows is critical for drawing the neckline and validating the pattern's structure, ensuring visualizations and signals are based on reliable key points.
//+------------------------------------------------------------------+
//| Find Lowest Swing                                                |
//+------------------------------------------------------------------+
int FindLowestSwing(int startBar, int endBar)
  {
   int bestIdx = -1;
   double bestPrice = DBL_MAX;

   for(int i = 0; i < ArraySize(g_swings); i++)
     {
      if(g_swings[i].isHigh)
         continue;

      if(g_swings[i].barIndex >= startBar && g_swings[i].barIndex <= endBar)
        {
         if(g_swings[i].price < bestPrice)
           {
            bestPrice = g_swings[i].price;
            bestIdx = i;
           }
        }
     }

   return bestIdx;
  }
//+------------------------------------------------------------------+
Helper Function: Find Highest Swing
Similarly, FindHighestSwing() searches for the highest swing high within a given range. It skips swing lows and compares high prices to find the maximum. This is especially important for locating the head of a Head & Shoulders pattern, which features a prominent high. Precise detection of these peaks guarantees that pattern visualization and analysis are trustworthy.
//+------------------------------------------------------------------+
//| Find highest swing point within a range                          |
//+------------------------------------------------------------------+
int FindHighestSwing(int startBar, int endBar)
  {
   int bestIdx = -1;
   double bestPrice = -DBL_MAX;
   for(int i = 0; i < ArraySize(g_swings); i++)
     {
      if(!g_swings[i].isHigh)
         continue;
      if(g_swings[i].barIndex >= startBar && g_swings[i].barIndex <= endBar)
        {
         if(g_swings[i].price > bestPrice)
           {
            bestPrice = g_swings[i].price;
            bestIdx = i;
           }
        }
     }
   return bestIdx;
  }
//+------------------------------------------------------------------+
Helper Function: Calculate Line Price at Bar
The GetNecklinePrice() function calculates the expected price of the neckline at a specific bar index. This is based on the slope and intercept derived from swing points, enabling accurate plotting of the neckline line across the chart. Correct calculation of this line is essential for visual clarity and for detecting breakouts, as the breach of this level often signals a potential trend change.
//+------------------------------------------------------------------+
//| Get Neckline Price at Bar                                        |
//+------------------------------------------------------------------+
double GetNecklinePrice(const Pattern &pat, int barIndex)
  {
   return pat.neckSlope * barIndex + pat.neckIntercept;
  }
//+------------------------------------------------------------------+
Detect Swings in Price Data
The process begins with DetectSwings(), which scans high and low price data to identify significant reversals—local maxima and minima—by comparing each bar with its neighbors. Using the SwingStrength parameter, it filters out minor fluctuations, focusing only on meaningful reversals.
//+------------------------------------------------------------------+
//| Detect Swings                                                    |
//+------------------------------------------------------------------+
void DetectSwings(const datetime &time[],
                  const double &high[],
                  const double &low[],
                  int totalBars)
  {
   ArrayResize(g_swings, 0);

   int start = SwingStrength;
   int end = totalBars - SwingStrength - 1;

   if(end <= start)
      return;

   for(int i = start; i <= end; i++)
     {
      bool isHighSwing = true;
      bool isLowSwing = true;

      for(int j = i - SwingStrength; j <= i + SwingStrength; j++)
        {
         if(high[j] > high[i])
            isHighSwing = false;

         if(low[j] < low[i])
            isLowSwing = false;

         if(!isHighSwing && !isLowSwing)
            break;
        }

      if(isHighSwing)
        {
         SwingPoint sp = {i, high[i], true, time[i]};
         ArrayResize(g_swings, ArraySize(g_swings) + 1);
         g_swings[ArraySize(g_swings) - 1] = sp;
        }
      else if(isLowSwing)
        {
         SwingPoint sp = {i, low[i], false, time[i]};
         ArrayResize(g_swings, ArraySize(g_swings) + 1);
         g_swings[ArraySize(g_swings) - 1] = sp;
        }
     }
  }
//+------------------------------------------------------------------+
The identified swing points are stored in the g_swings array, providing the foundation for pattern recognition. This step ensures that subsequent analysis is based on reliable market turning points.
Compute Pattern Score
Once potential patterns are identified, their credibility is evaluated through ComputePatternScore(). This function assesses geometric symmetry, pattern height relative to ATR, neckline slope, and temporal symmetry, combining these factors into a total score from 0 to 100. Only patterns with a score exceeding the predefined threshold (MinScoreThreshold) are considered valid.
//+------------------------------------------------------------------+
//| Compute Pattern Score                                            |
//+------------------------------------------------------------------+
double ComputePatternScore(const Pattern &p,
                           const double &high[],
                           const double &low[],
                           double atr)
  {
   double score = 0.0;

   double leftPrice = (p.isBearish ? high[p.lsIndex] : low[p.lsIndex]);
   double rightPrice = (p.isBearish ? high[p.rsIndex] : low[p.rsIndex]);
   double headPrice = p.headPrice;

   double priceDiff = MathAbs(leftPrice - rightPrice) / headPrice;
   double priceSym = MathMax(0.0, 1.0 - priceDiff / ShoulderTolerance);

   score += priceSym * 30.0;

   if(MinTimeSymmetry > 0)
     {
      int leftDist = p.headIndex - p.lsIndex;
      int rightDist = p.rsIndex - p.headIndex;

      double timeRatio =
         (leftDist > 0 && rightDist > 0)
         ? (double)MathMin(leftDist, rightDist) / MathMax(leftDist, rightDist)
         : 0;

      score += timeRatio * (double)MinTimeSymmetry / 100.0 * 20.0;
     }
   else
      score += 20.0;

   double slopeDeg = MathArctan(p.neckSlope) * 180.0 / M_PI;

   if(MathAbs(slopeDeg) <= MaxNecklineSlopeDeg)
      score += 20.0 * (1.0 - MathAbs(slopeDeg) / MaxNecklineSlopeDeg);

   double sizeRatio = p.height / atr;
   double sizeScore = MathMin(30.0, (sizeRatio / MinPatternSizeATR) * 30.0);

   score += sizeScore;

   return MathMin(100.0, score);
  }
//+------------------------------------------------------------------+
This scoring system helps prioritize the most reliable formations, reducing false signals and increasing confidence in the detected patterns.
Detect Patterns: The Core Logic
At the heart of the system is DetectPatterns(), which analyzes swing points to identify formations that match Head & Shoulders or inverse Head & Shoulders patterns. It searches for specific sequences—three peaks or troughs aligned with expected geometric relationships—and validates them against criteria such as pattern height, shoulder symmetry, and neckline slope. Patterns that meet all conditions are scored with ComputePatternScore() and stored if they surpass the threshold.
//+------------------------------------------------------------------+
//| Detect Patterns                                                  |
//+------------------------------------------------------------------+
void DetectPatterns(const datetime &time[],
                    const double &high[],
                    const double &low[],
                    const double &close[],
                    int totalBars)
  {
   if(ArraySize(g_swings) < 5)
      return;

   double atr = GetATR();

   if(atr <= 0)
      return;

   Pattern candidates[];
   ArrayResize(candidates, 0);

   for(int i = 0; i < ArraySize(g_swings) - 4; i++)
     {
      //--- Bearish pattern: High, Low, High, Low, High
      if(g_swings[i].isHigh && !g_swings[i+1].isHigh &&
         g_swings[i+2].isHigh && !g_swings[i+3].isHigh &&
         g_swings[i+4].isHigh)
        {
         int ls = i;
         int n1 = i + 1;
         int head = i + 2;
         int n2 = i + 3;
         int rs = i + 4;

         if(g_swings[rs].barIndex - g_swings[ls].barIndex < MinSwingDistance)
            continue;

         if(g_swings[head].price <= g_swings[ls].price)
            continue;

         if(g_swings[rs].price >= g_swings[head].price)
            continue;

         double shoulderDiff =
            MathAbs(g_swings[ls].price - g_swings[rs].price) /
            g_swings[head].price;

         if(shoulderDiff > ShoulderTolerance)
            continue;

         double x1 = (double)g_swings[n1].barIndex;
         double y1 = g_swings[n1].price;
         double x2 = (double)g_swings[n2].barIndex;
         double y2 = g_swings[n2].price;

         double slope = (y2 - y1) / (x2 - x1);
         double intercept = y1 - slope * x1;

         double neckAtHead = slope * g_swings[head].barIndex + intercept;
         double height = g_swings[head].price - neckAtHead;

         if(height < MinPatternSizeATR * atr)
            continue;

         if(!AllowDescendingNeck && slope < 0)
            continue;

         Pattern pat;

         pat.id = g_nextPatternId++;
         pat.isBearish = true;
         pat.lsIndex = g_swings[ls].barIndex;
         pat.headIndex = g_swings[head].barIndex;
         pat.rsIndex = g_swings[rs].barIndex;
         pat.neck1Index = g_swings[n1].barIndex;
         pat.neck2Index = g_swings[n2].barIndex;
         pat.neckSlope = slope;
         pat.neckIntercept = intercept;
         pat.headPrice = g_swings[head].price;
         pat.neckPriceAtHead = neckAtHead;
         pat.height = height;
         pat.signalGenerated = false;
         pat.detectionTime = time[0];

         pat.score = ComputePatternScore(pat, high, low, atr);

         if(pat.score >= MinScoreThreshold)
           {
            ArrayResize(candidates, ArraySize(candidates) + 1);
            candidates[ArraySize(candidates) - 1] = pat;
           }
        }

      //--- Bullish inverse pattern
      else if(!g_swings[i].isHigh && g_swings[i+1].isHigh &&
              !g_swings[i+2].isHigh && g_swings[i+3].isHigh &&
              !g_swings[i+4].isHigh)
        {
         int ls = i;
         int n1 = i + 1;
         int head = i + 2;
         int n2 = i + 3;
         int rs = i + 4;

         if(g_swings[rs].barIndex - g_swings[ls].barIndex < MinSwingDistance)
            continue;

         if(g_swings[head].price >= g_swings[ls].price)
            continue;

         if(g_swings[rs].price <= g_swings[head].price)
            continue;

         double shoulderDiff =
            MathAbs(g_swings[ls].price - g_swings[rs].price) /
            MathAbs(g_swings[head].price);

         if(shoulderDiff > ShoulderTolerance)
            continue;

         double x1 = (double)g_swings[n1].barIndex;
         double y1 = g_swings[n1].price;
         double x2 = (double)g_swings[n2].barIndex;
         double y2 = g_swings[n2].price;

         double slope = (y2 - y1) / (x2 - x1);
         double intercept = y1 - slope * x1;

         double neckAtHead = slope * g_swings[head].barIndex + intercept;
         double height = neckAtHead - g_swings[head].price;

         if(height < MinPatternSizeATR * atr)
            continue;

         if(!AllowDescendingNeck && slope < 0)
            continue;

         Pattern pat;

         pat.id = g_nextPatternId++;
         pat.isBearish = false;
         pat.lsIndex = g_swings[ls].barIndex;
         pat.headIndex = g_swings[head].barIndex;
         pat.rsIndex = g_swings[rs].barIndex;
         pat.neck1Index = g_swings[n1].barIndex;
         pat.neck2Index = g_swings[n2].barIndex;
         pat.neckSlope = slope;
         pat.neckIntercept = intercept;
         pat.headPrice = g_swings[head].price;
         pat.neckPriceAtHead = neckAtHead;
         pat.height = height;
         pat.signalGenerated = false;
         pat.detectionTime = time[0];

         pat.score = ComputePatternScore(pat, high, low, atr);

         if(pat.score >= MinScoreThreshold)
           {
            ArrayResize(candidates, ArraySize(candidates) + 1);
            candidates[ArraySize(candidates) - 1] = pat;
           }
        }
     }

   //--- Deduplication
   for(int i = 0; i < ArraySize(candidates) - 1; i++)
     {
      for(int j = i + 1; j < ArraySize(candidates); j++)
        {
         if(MathAbs(candidates[i].headIndex - candidates[j].headIndex) < MinPatternDistance)
           {
            if(candidates[i].score < candidates[j].score)
               candidates[i].score = -1;
            else
               candidates[j].score = -1;
           }
        }
     }

   int newSize = 0;

   for(int i = 0; i < ArraySize(candidates); i++)
     {
      if(candidates[i].score >= MinScoreThreshold)
        {
         if(i != newSize)
            candidates[newSize] = candidates[i];

         newSize++;
        }
     }

   ArrayResize(candidates, newSize);

   int existingCount = ArraySize(g_patterns);

   for(int i = 0; i < ArraySize(candidates); i++)
     {
      bool exists = false;

      for(int j = 0; j < existingCount; j++)
        {
         if(g_patterns[j].lsIndex == candidates[i].lsIndex &&
            g_patterns[j].headIndex == candidates[i].headIndex &&
            g_patterns[j].rsIndex == candidates[i].rsIndex)
           {
            exists = true;
            break;
           }
        }

      if(!exists)
        {
         ArrayResize(g_patterns, existingCount + 1);
         g_patterns[existingCount] = candidates[i];
         existingCount++;

         DrawPatternTriangles(candidates[i], time, high, low);
         DrawNeckline(candidates[i], time);

         if(AlertOnNewPattern)
            Alert("New ",
                  (candidates[i].isBearish ? "Bearish" : "Bullish"),
                  " pattern on ",
                  _Symbol);
        }
     }
  }
//+------------------------------------------------------------------+
This process transforms raw swing data into meaningful, actionable patterns, forming the basis for visualization and trading signals.
Draw Pattern Triangles
After confirming a pattern, the indicator visualizes it by drawing triangles connecting the key swing points—left shoulder, head, and right shoulder—using OBJ_TRIANGLE. The function determines the extremities of swing points and extends the pattern visually across the chart. Filled with semi-transparent colors, these triangles make the pattern structure immediately apparent, aiding quick recognition and analysis.
//+------------------------------------------------------------------+
//| Draw Pattern Triangles                                           |
//+------------------------------------------------------------------+
void DrawPatternTriangles(const Pattern &pat,
                          const datetime &time[],
                          const double &high[],
                          const double &low[])
  {
   string base = g_prefix + "TRI_" + IntegerToString(pat.id);
   uint argbColor = ColorToARGB(PatternFillColor, (uchar)PatternOpacity);

   ObjectCreate(0, base+"_LS", OBJ_TRIANGLE, 0,
                time[pat.lsIndex],
                pat.isBearish ? high[pat.lsIndex] : low[pat.lsIndex],
                time[pat.headIndex],
                pat.isBearish ? high[pat.headIndex] : low[pat.headIndex],
                time[pat.neck1Index],
                GetNecklinePrice(pat, pat.neck1Index));

   ObjectSetInteger(0, base+"_LS", OBJPROP_FILL, true);
   ObjectSetInteger(0, base+"_LS", OBJPROP_BGCOLOR, argbColor);
  }
//+------------------------------------------------------------------+
Draw Neckline
The DrawNeckline() function emphasizes the support or resistance level that defines the pattern. It calculates the neckline line by connecting the relevant swing points and extends it across the chart, styled with a dashed line for clarity. Labels near the neckline can also be added to identify the pattern type. An accurately drawn neckline is critical because its breach often confirms the pattern and signals a potential trend reversal.
//+------------------------------------------------------------------+
//| Draw Neckline                                                    |
//+------------------------------------------------------------------+
void DrawNeckline(const Pattern &pat,
                  const datetime &time[])
  {
   if(!ShowNeckline)
      return;

   string name = g_prefix + "NECK_" + IntegerToString(pat.id);

   double price1 = GetNecklinePrice(pat, pat.neck1Index);
   double price2 = GetNecklinePrice(pat, pat.neck2Index);

   ObjectCreate(0, name, OBJ_TREND, 0,
                time[pat.neck1Index], price1,
                time[pat.neck2Index], price2);

   ObjectSetInteger(0, name, OBJPROP_COLOR, clrMagenta);
   ObjectSetInteger(0, name, OBJPROP_STYLE, STYLE_DASH);
  }
//+------------------------------------------------------------------+
Draw Breakout Arrow
When the pattern's neckline is broken, DrawBreakoutArrow() is invoked to indicate the event visually. It draws an arrow pointing downward for bearish breakouts or upward for bullish ones, using color coding for instant recognition.
//+------------------------------------------------------------------+
//| Draw Breakout Arrow                                              |
//+------------------------------------------------------------------+
void DrawBreakoutArrow(const Pattern &pat,
                       const datetime &time[],
                       int bar,
                       double price)
  {
   if(!ShowBreakoutArrow)
      return;

   string name = g_prefix + "SIG_" + IntegerToString(pat.id);

   if(pat.isBearish)
     {
      ObjectCreate(0, name, OBJ_ARROW_DOWN, 0, time[bar], price);
      ObjectSetInteger(0, name, OBJPROP_COLOR, clrRed);
     }
   else
     {
      ObjectCreate(0, name, OBJ_ARROW_UP, 0, time[bar], price);
      ObjectSetInteger(0, name, OBJPROP_COLOR, clrLime);
     }
  }
//+------------------------------------------------------------------+
Positioned at the breakout point, these arrows provide a clear, visual confirmation that the pattern has been validated, alerting traders to potential entry opportunities.
Check Breakouts
The indicator continuously monitors the current market price relative to the neckline level. CheckBreakouts() compares the latest close price with the neckline, and if a decisive movement occurs—such as a close below the neckline in a bearish pattern—the indicator flags the pattern as confirmed, draws the corresponding arrow, and raises an alert.
//+------------------------------------------------------------------+
//| Check Breakouts                                                  |
//+------------------------------------------------------------------+
void CheckBreakouts(const datetime &time[],
                    const double &close[],
                    int currentBar)
  {
   for(int i = 0; i < ArraySize(g_patterns); i++)
     {
      if(g_patterns[i].signalGenerated)
         continue;

      double neck = GetNecklinePrice(g_patterns[i], currentBar);

      bool breakout =
         g_patterns[i].isBearish
         ? (close[currentBar] < neck)
         : (close[currentBar] > neck);

      if(breakout)
        {
         g_patterns[i].signalGenerated = true;
         g_patterns[i].signalTime = time[currentBar];
         g_patterns[i].signalBar = currentBar;

         DrawBreakoutArrow(g_patterns[i], time, currentBar, close[currentBar]);
        }
     }
  }
//+------------------------------------------------------------------+
This real-time assessment ensures timely notification of pattern completion, enabling traders to act promptly on these signals.
Main Calculation (OnCalculate())
The core function, OnCalculate(), orchestrates the entire detection process. It runs every time new market data arrives, starting by checking if the current bar has been processed to avoid redundant computations. It then sequentially calls functions to detect swing points (DetectSwings()), identify valid patterns (DetectPatterns()), and monitor for breakouts (CheckBreakouts()). This structured flow guarantees that all analysis steps are performed efficiently and accurately, providing continuously updated visual cues and alerts.
//+------------------------------------------------------------------+
//| OnCalculate                                                      |
//+------------------------------------------------------------------+
int OnCalculate(const int rates_total,
                const int prev_calculated,
                const datetime &time[],
                const double &open[],
                const double &high[],
                const double &low[],
                const double &close[],
                const long &tick_volume[],
                const long &volume[],
                const int &spread[])
  {
   static datetime lastTime = 0;

   if(time[0] == lastTime)
      return rates_total;

   lastTime = time[0];

   DetectSwings(time, high, low, rates_total);
   DetectPatterns(time, high, low, close, rates_total);
   CheckBreakouts(time, close, 0);

   return rates_total;
  }
//+------------------------------------------------------------------+
The indicator thus automates the entire pattern recognition process, supporting timely decision-making.
Initialization and Cleanup
//+------------------------------------------------------------------+
//| OnInit                                                           |
//+------------------------------------------------------------------+
int OnInit()
  {
   g_atrHandle = iATR(_Symbol, PERIOD_CURRENT, 14);

   if(g_atrHandle == INVALID_HANDLE)
      return INIT_FAILED;

   ObjectsDeleteAll(0, g_prefix);

   return INIT_SUCCEEDED;
  }
//+------------------------------------------------------------------+
During initialization, OnInit() creates the ATR indicator handle, which is essential for normalizing pattern sizes and filtering out insignificant formations. It also clears previous graphical objects to start fresh. When the indicator is removed, OnDeinit() releases the ATR handle and deletes all objects created during operation, ensuring no residual data remains on the chart. This resource management maintains a clean, efficient trading environment and prevents potential performance issues.
//+------------------------------------------------------------------+
//| OnDeinit                                                         |
//+------------------------------------------------------------------+
void OnDeinit(const int reason)
  {
   if(g_atrHandle != INVALID_HANDLE)
      IndicatorRelease(g_atrHandle);

   ObjectsDeleteAll(0, g_prefix);
   Comment("");
  }
//+------------------------------------------------------------------+
Outcomes
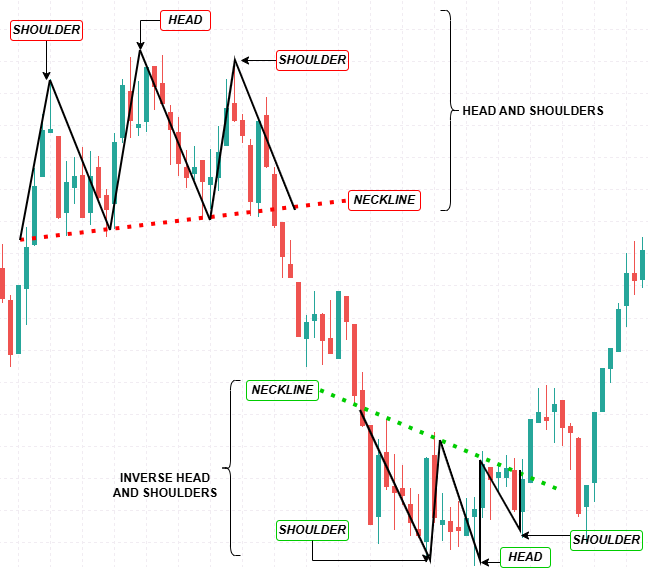
The indicator was tested under live market conditions to evaluate its ability to detect and visualize Head and Shoulders structures in real time. The diagram below shows results on Step Index (M30), where multiple valid patterns are identified and clearly structured on the chart.

Each detected pattern is rendered using triangular regions and a corresponding neckline, making the structure immediately visible. The system also assigns a score to each candidate and filters out weak formations, reducing noise and improving reliability. Breakout confirmation is monitored continuously, and when price closes beyond the neckline, the indicator marks the event with a directional arrow and can trigger an alert. The latest inverse Head and Shoulders example is detected correctly and may be difficult to identify visually, demonstrating the advantage of rule-based detection over manual analysis.
Overall, the indicator consistently identifies Head and Shoulders and inverse patterns with clear visualization and structurally consistent rules. The combination of automated detection, scoring, and confirmation provides a practical framework that can be tested, tuned, and adapted across different symbols and timeframes.
Conclusion
This article presents a complete, rule-based Head and Shoulders detection system for MetaTrader 5. The indicator transforms visual pattern recognition into a structured and reproducible process by combining swing detection, geometric validation, ATR-based size normalization, symmetry checks, and neckline breakout confirmation.
The system detects both standard and inverse patterns, draws triangular structures and necklines, assigns quality scores, and highlights confirmed breakouts with visual markers and alerts. This approach reduces subjectivity and improves consistency in pattern analysis.
The result is a practical indicator designed for visualization and signal generation rather than automated trading. With the provided source code, the system can be compiled, tested, and customized to suit different market conditions and trading styles. The structured pipeline—from swing detection to confirmation—also provides a solid foundation for further enhancements or integration into broader trading systems.
Warning: All rights to these materials are reserved by MetaQuotes Ltd. Copying or reprinting of these materials in whole or in part is prohibited.
This article was written by a user of the site and reflects their personal views. MetaQuotes Ltd is not responsible for the accuracy of the information presented, nor for any consequences resulting from the use of the solutions, strategies or recommendations described.

- Free trading apps
- Over 8,000 signals for copying
- Economic news for exploring financial markets
You agree to website policy and terms of use