Articles with examples of indicators developed in MQL5
The articles contain detailed explanation of the attached codes. Download and open them in MetaEditor and program together with the author while reading the article.
Add a new article

You are missing trading opportunities:
- Free trading apps
- Over 8,000 signals for copying
- Economic news for exploring financial markets
Registration
Log in
You agree to website policy and terms of use
If you do not have an account, please register


Universal Oscillator with a GUI
The article describes the process of creation of a universal indicator based on all oscillators available in the terminal, with its own graphical interface. The GUI allows users to quickly and easily change settings of each oscillator straight from the chart window (without having to open its properties), as well as to compare their values and to select an optimal option for a specific task.

Using MATLAB 2018 computational capabilities in MetaTrader 5
After the upgrade of the MATLAB package in 2015, it is necessary to consider a modern way of creating DLL libraries. The article uses a sample predictive indicator to illustrate the peculiarities of linking MetaTrader 5 and MATLAB using modern 64-bit versions of the platforms, which are utilized nowadays. With the entire sequence of connecting MATLAB considered, MQL5 developers will be able to create applications with advanced computational capabilities much faster, avoiding «pitfalls».

Graphical Interfaces III: Groups of Simple and Multi-Functional Buttons (Chapter 2)
The first chapter of the series was about simple and multi-functional buttons. The second article will be dedicated to groups of interconnected buttons that will allow the creation of elements in an application when a user can select one of the option out of a set (group).

Graphical Interfaces X: Updates for Easy And Fast Library (Build 2)
Since the publication of the previous article in the series, Easy And Fast library has received some new features. The library structure and code have been partially optimized slightly reducing CPU load. Some recurring methods in many control classes have been moved to the CElement base class.

Custom indicators and infographics in CCanvas
The article considers new types of indicators with more complex structural implementation. It also describes the development of pseudo-3D indicator types and dynamic infographics.

Price Action Analysis Toolkit Development (Part 28): Opening Range Breakout Tool
At the start of each trading session, the market’s directional bias often becomes clear only after price moves beyond the opening range. In this article, we explore how to build an MQL5 Expert Advisor that automatically detects and analyzes Opening Range Breakouts, providing you with timely, data‑driven signals for confident intraday entries.
Rope Indicator by Erik Nayman
The article reveals how the "Rope" indicator is created based on "The Small Encyclopedia of Trader" by Erik L. Nayman. This indicator shows the direction of the trend using the calculated values of bulls and bears over a specified period of time. The article also contains principles of creating and calculating indicators along with the examples of codes. Other subjects covered include building an Expert Advisor based on the indicator, and the optimization of external parameters.
Manual charting and trading toolkit (Part II). Chart graphics drawing tools
This is the next article within the series, in which I show how I created a convenient library for manual application of chart graphics by utilizing keyboard shortcuts. The tools used include straight lines and their combinations. In this part, we will view how the drawing tools are applied using the functions described in the first part. The library can be connected to any Expert Advisor or indicator which will greatly simplify the charting tasks. This solution DOES NOT use external dlls, while all the commands are implemented using built-in MQL tools.

Graphical Interfaces X: Text Edit box, Picture Slider and simple controls (build 5)
This article will consider new controls: Text Edit box, Picture Slider, as well as additional simple controls: Text label and Picture. The library continues to grow, and in addition to introduction of new controls, the previously created ones are also being improved.
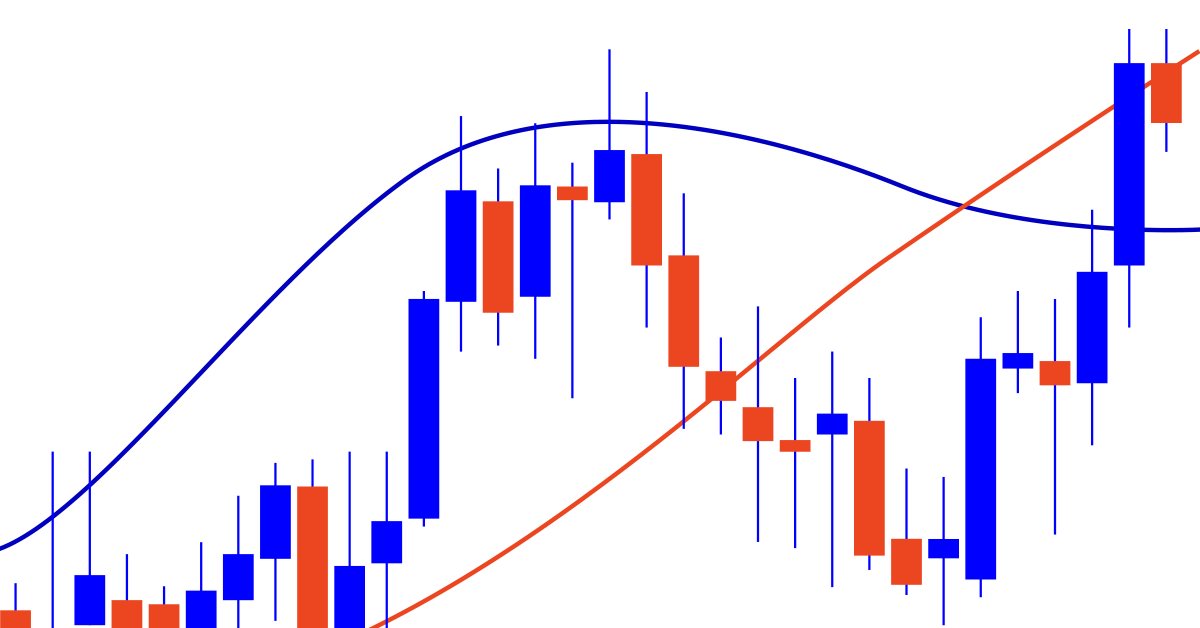
What you can do with Moving Averages
The article considers several methods of applying the Moving Average indicator. Each method involving a curve analysis is accompanied by indicators visualizing the idea. In most cases, the ideas shown here belong to their respected authors. My sole task was to bring them together to let you see the main approaches and, hopefully, make more reasonable trading decisions. MQL5 proficiency level — basic.

Manual charting and trading toolkit (Part III). Optimization and new tools
In this article, we will further develop the idea of drawing graphical objects on charts using keyboard shortcuts. New tools have been added to the library, including a straight line plotted through arbitrary vertices, and a set of rectangles that enable the evaluation of the reversal time and level. Also, the article shows the possibility to optimize code for improved performance. The implementation example has been rewritten, allowing the use of Shortcuts alongside other trading programs. Required code knowledge level: slightly higher than a beginner.
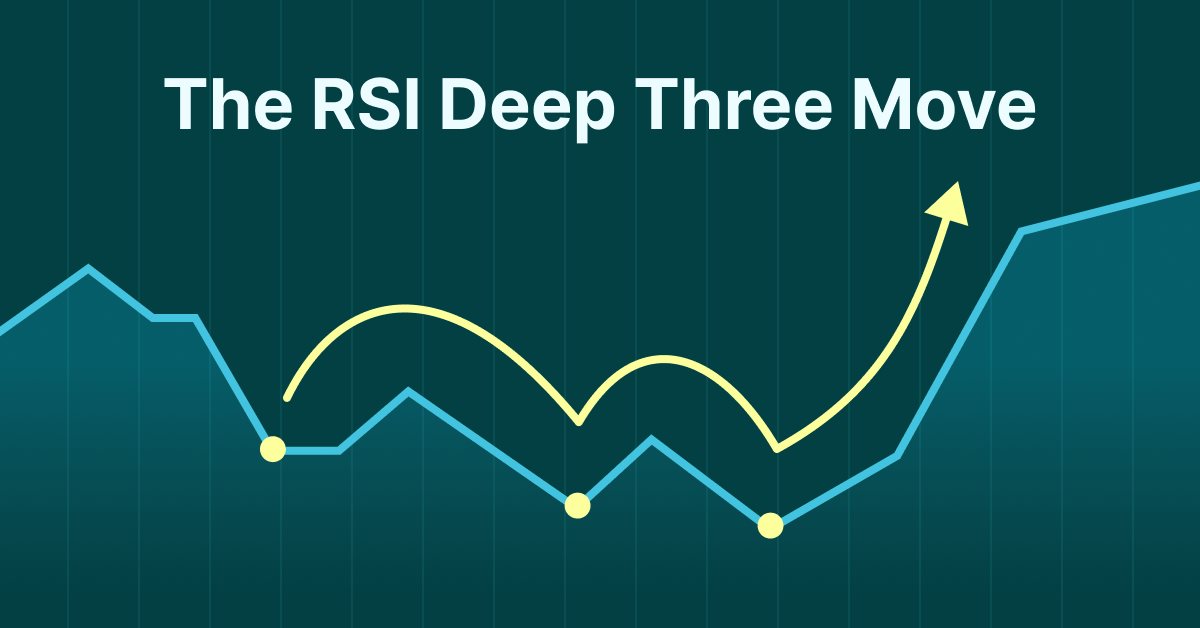
The RSI Deep Three Move Trading Technique
Presenting the RSI Deep Three Move Trading Technique in MetaTrader 5. This article is based on a new series of studies that showcase a few trading techniques based on the RSI, a technical analysis indicator used to measure the strength and momentum of a security, such as a stock, currency, or commodity.

Exploring options for creating multicolored candlesticks
In this article I will address the possibilities of creating customized indicators with candlesticks, pointing out their advantages and disadvantages.

Price Action Analysis Toolkit Development (Part 63): Automating Rising and Falling Wedge Detection in MQL5
In this part of the Price Action Analysis Toolkit Development series, we develop an MQL5 indicator that automatically detects rising and falling wedge patterns in real time. The system confirms pivot structures, validates boundary convergence mathematically, prevents overlapping formations, and monitors breakout and failure conditions with precise visual feedback. Built using a clean object-oriented architecture, this implementation converts subjective wedge recognition into a structured, state-aware analytical component designed to strengthen disciplined price action analysis.
Graphical Interfaces VII: the Tables Controls (Chapter 1)
The seventh part of the series on MetaTrader graphical interfaces deals with three table types: text label, edit box and rendered one. Another important and frequently used controls are tabs allowing you to show/hide groups of other controls and develop space effective interfaces in your MQL applications.
Graphical Interfaces V: The Combobox Control (Chapter 3)
In the first two chapters of the fifth part of the series, we developed classes for creating a scrollbar and a view list. In this chapter, we will speak about creating a class for the combobox control. This is also a compound control containing, among others, elements considered in the previous chapters of the fifth part.
MQL5 Cookbook: Developing a Multi-Symbol Volatility Indicator in MQL5
In this article, we will consider the development of a multi-symbol volatility indicator. The development of multi-symbol indicators may present some difficulties for novice MQL5 developers which this article helps to clarify. The major issues arising in the course of development of a multi-symbol indicator have to do with the synchronization of other symbols' data with respect to the current symbol, the lack of some indicator data and the identification of the beginning of 'true' bars of a given time frame. All of these issues will be closely considered in the article.

MQL5-RPC. Remote Procedure Calls from MQL5: Web Service Access and XML-RPC ATC Analyzer for Fun and Profit
This article describes MQL5-RPC framework that enables Remote Procedure Calls from MQL5. It starts with XML-RPC basics, MQL5 implementation and follows with two real usage examples. First example is using external web service and the second one is a client to simple XML-RPC ATC 2011 Analyzer service. If you are interested on how to implement and analyze different statistics from ATC 2011 in real time, this article is just for you.

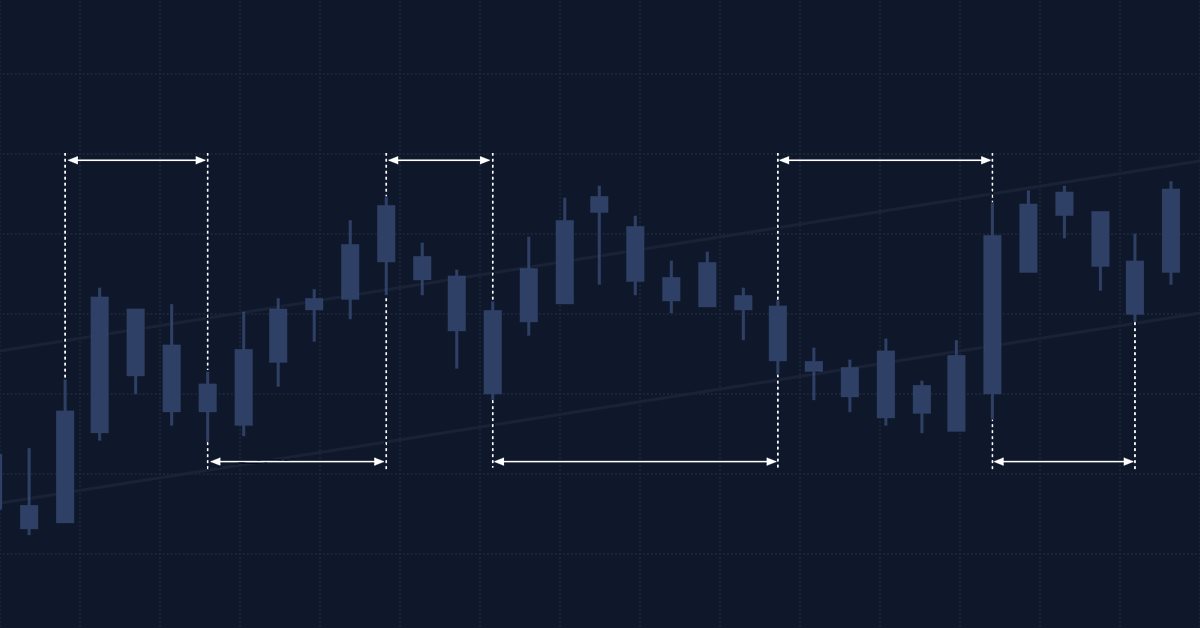
Liquid Chart
Would you like to see an hourly chart with bars opening from the second and the fifth minute of the hour? What does a redrawn chart look like when the opening time of bars is changing every minute? What advantages does trading on such charts have? You will find answers to these questions in this article.
Multiple indicators on one chart (Part 01): Understanding the concepts
Today we will learn how to add multiple indicators running simultaneously on one chart, but without occupying a separate area on it. Many traders feel more confident if they monitor multiple indicators at a time (for example, RSI, STOCASTIC, MACD, ADX and some others), or in some cases even at different assets which an index is made of.

Create your own Market Watch using the Standard Library Classes
The new MetaTrader 5 client terminal and the MQL5 Language provides new opportunities for presenting visual information to the trader. In this article, we propose a universal and extensible set of classes, which handles all the work of organizing displaying of the arbitrary text information on the chart. The example of Market Watch indicator is presented.
MQL5 Cookbook: Development of a Multi-Symbol Indicator to Analyze Price Divergence
In this article, we will consider the development of a multi-symbol indicator to analyze price divergence in a specified period of time. The core topics have been already discussed in the previous article on the programming of multi-currency indicators "MQL5 Cookbook: Developing a Multi-Symbol Volatility Indicator in MQL5". So this time we will dwell only on those new features and functions that have been changed dramatically. If you are new to the programming of multi-currency indicators, I recommend you to first read the previous article.

LifeHack for Traders: Indicators of Balance, Drawdown, Load and Ticks during Testing
How to make the testing process more visual? The answer is simple: you need to use one or more indicators in the Strategy Tester, including a tick indicator, an indicator of balance and equity, an indicator of drawdown and deposit load. This solution will help you visually track the nature of ticks, balance and equity changes, as well as drawdown and deposit load.
How to create a custom indicator (Heiken Ashi) using MQL5
In this article, we will learn how to create a custom indicator using MQL5 based on our preferences, to be used in MetaTrader 5 to help us read charts or to be used in automated Expert Advisors.

Object-Oriented Approach to Building Multi-Timeframe and Multi-Currency Panels
This article describes how object-oriented programming can be used for creating multi-timeframe and multi-currency panels for MetaTrader 5. The main goal is to build a universal panel, which can be used for displaying many different kinds of data, such as prices, price changes, indicator values or custom buy/sell conditions without the need to modify the code of the panel itself.
Using Layouts and Containers for GUI Controls: The CBox Class
This article presents an alternative method of GUI creation based on layouts and containers, using one layout manager — the CBox class. The CBox class is an auxiliary control that acts as a container for essential controls in a GUI panel. It can make designing graphical panels easier, and in some cases, reduce coding time.

Introduction to MQL5 (Part 1): A Beginner's Guide into Algorithmic Trading
Dive into the fascinating realm of algorithmic trading with our beginner-friendly guide to MQL5 programming. Discover the essentials of MQL5, the language powering MetaTrader 5, as we demystify the world of automated trading. From understanding the basics to taking your first steps in coding, this article is your key to unlocking the potential of algorithmic trading even without a programming background. Join us on a journey where simplicity meets sophistication in the exciting universe of MQL5.
Graphical Interfaces X: Text selection in the Multiline Text box (build 13)
This article will implement the ability to select text using various key combinations and deletion of the selected text, similar to the way it is done in any other text editor. In addition, we will continue to optimize the code and prepare the classes to move on to the final process of the second stage of the library's evolution, where all controls will be rendered as separate images (canvases).

Graphical Interfaces II: the Menu Item Element (Chapter 1)
In the second part of the series, we will show in detail the development of such interface elements as main menu and context menu. We will also mention drawing elements and create a special class for it. We will discuss in depth such question as managing program events including custom ones.
Making a dashboard to display data in indicators and EAs
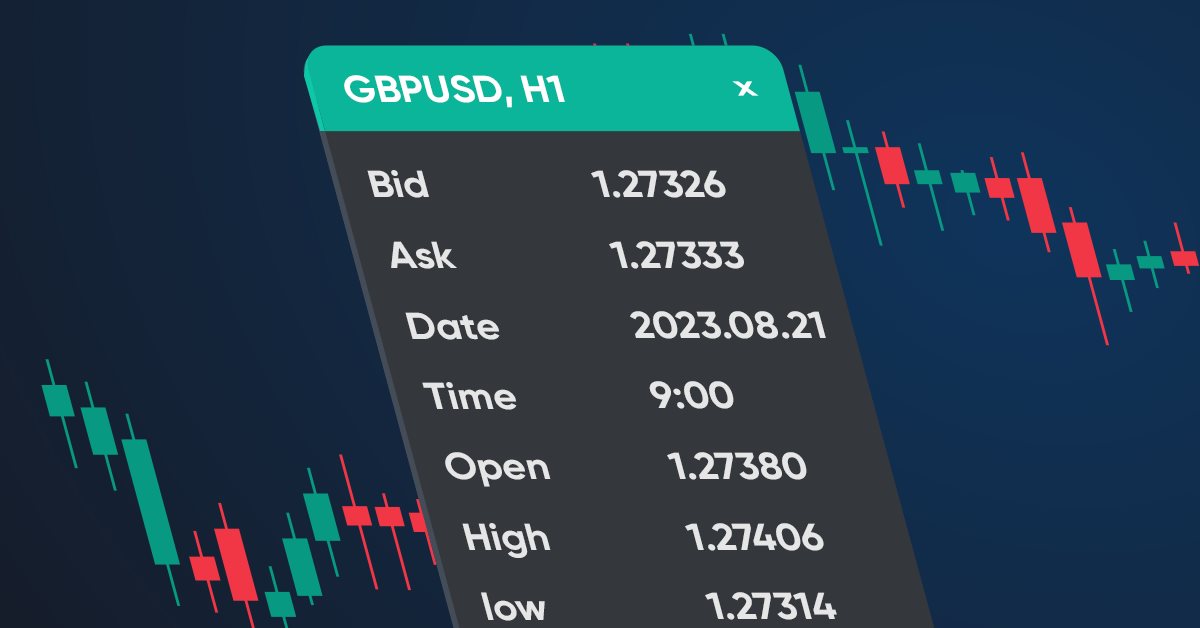
In this article, we will create a dashboard class to be used in indicators and EAs. This is an introductory article in a small series of articles with templates for including and using standard indicators in Expert Advisors. I will start by creating a panel similar to the MetaTrader 5 data window.

Graphical Interfaces VI: the Checkbox Control, the Edit Control and their Mixed Types (Chapter 1)
This article is the beginning of the sixth part of the series dedicated to the development of the library for creating graphical interfaces in the MetaTrader terminals. In the first chapter, we are going to discuss the checkbox control, the edit control and their mixed types.

Graphical Interfaces VI: the Slider and the Dual Slider Controls (Chapter 2)
In the previous article, we have enriched our library with four controls frequently used in graphical interfaces: checkbox, edit, edit with checkbox and check combobox. The second chapter of the sixth part will be dedicated to the slider and the dual slider controls.

An Analysis of Why Expert Advisors Fail
This article presents an analysis of currency data to better understand why expert advisors can have good performance in some regions of time and poor performance in other regions of time.

Graphical interfaces X: Advanced management of lists and tables. Code optimization (build 7)
The library code needs to be optimized: it should be more regularized, which is — more readable and comprehensible for studying. In addition, we will continue to develop the controls created previously: lists, tables and scrollbars.

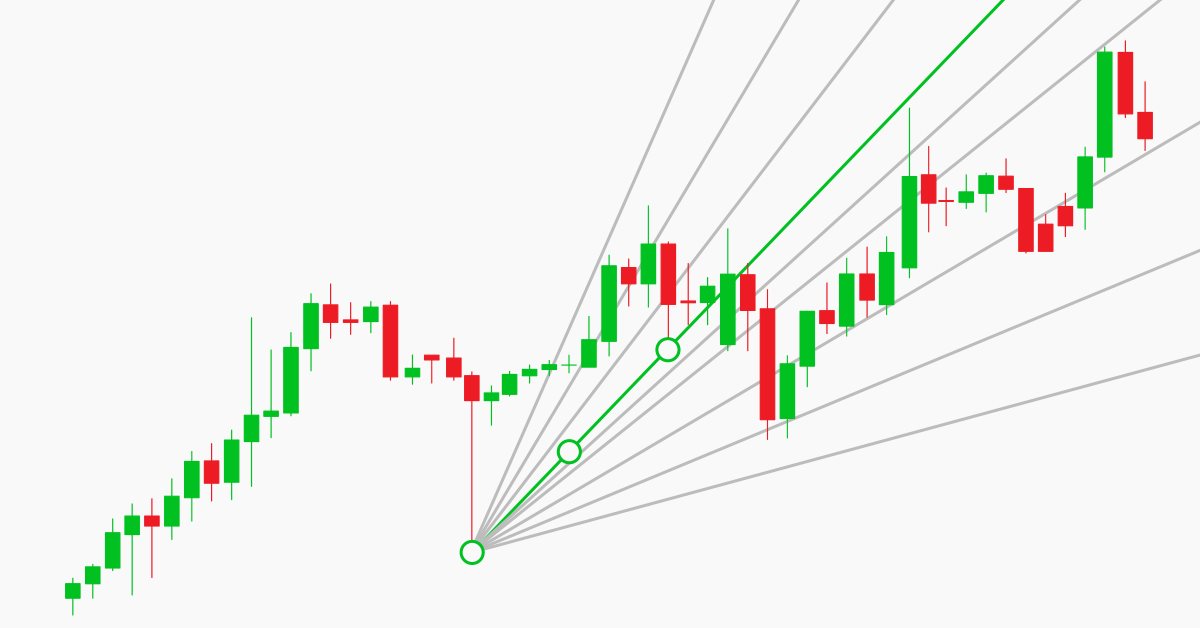
Drawing Channels - Inside and Outside View
I guess it won't be an exaggeration, if I say the channels are the most popular tool for the analysis of market and making trade decisions after the moving averages. Without diving deeply into the mass of trade strategies that use channels and their components, we are going to discuss the mathematical basis and the practical implementation of an indicator, which draws a channel determined by three extremums on the screen of the client terminal.

From Novice to Expert: Higher Probability Signals
In high-probability support and resistance zones, valid entry confirmation signals are always present once the zone has been correctly identified. In this discussion, we build an intelligent MQL5 program that automatically detects entry conditions within these zones. We leverage well-known candlestick patterns alongside native confirmation indicators to validate trade decisions. Click to read further.
Graphical Interfaces VII: The Tabs Control (Chapter 2)
The first chapter of seventh part introduced three classes of controls for creating tables: text label table (CLabelsTable), edit box table (CTable) and rendered table (CCanvasTable). In this article (chapter two) we are going to consider the Tabs control.
Market Profile indicator
In this article, we will consider Market Profile indicator. We will find out what lies behind this name, try to understand its operation principles and have a look at its terminal version (MarketProfile).

Creating an Indicator with Graphical Control Options
Those who are familiar with market sentiments, know the MACD indicator (its full name is Moving Average Convergence/Divergence) - the powerful tool for analyzing the price movement, used by traders from the very first moments of appearance of the computer analysis methods. In this article we'll consider possible modifications of MACD and implement them in one indicator with the possibility to graphically switch between the modifications.

Graphical Interfaces X: Time control, List of checkboxes control and table sorting (build 6)
Development of the library for creating graphical interfaces continues. The Time and List of checkboxes controls will be covered this time. In addition, the CTable class now provides the ability to sort data in ascending or descending order.