
Price Action Analysis Toolkit Development (Part 73): Building a Weekend Gap Trading Signal System in MQL5

Contents
Introduction
In part 71 of the Price Action Analysis Toolkit Development series, we introduced weekend gaps as a price-action pattern and built a tool to detect and display them on the chart. However, traders and developers need more than visual marking. They need a clear, automatable signal model that defines the entry condition, stop-loss and take-profit rules, the lifetime of each setup, and EA-readable output that can be tested consistently in history and in real time. This article formalizes the weekend-gap trading logic and implements it as an MQL5 indicator.
The indicator uses Friday close and Monday open as the gap boundaries, applies a minimum tradable gap size, and generates signals only after candle-close confirmation with an optional price offset. The target is placed at the opposite gap boundary, while the stop-loss is based on the current week’s extreme with an optional buffer. Confirmed signals are non-repainting and are published through six buffers so an Expert Advisor can read them with CopyBuffer().
Understanding the Strategy
Recap from Previous Article
In the previous article of this series, we introduced a gap-fill strategy that generated signals only after the weekend gap had been fully closed. The indicator waited for price to move across the entire gap and reach the prior Friday close before confirming the setup. Once the gap was filled, the strategy anticipated a potential reversal from that level. A gap-down scenario was therefore treated as a potential bearish reversal after the fill was completed, while a gap-up scenario was treated as a potential bullish reversal after the fill was completed.
However, the gap-filling process itself can also be viewed as a trading opportunity. Rather than waiting for the gap to be fully closed before taking action, traders may seek to participate in the expected movement toward the fill. Under this interpretation, weekend gaps can be traded in two ways:
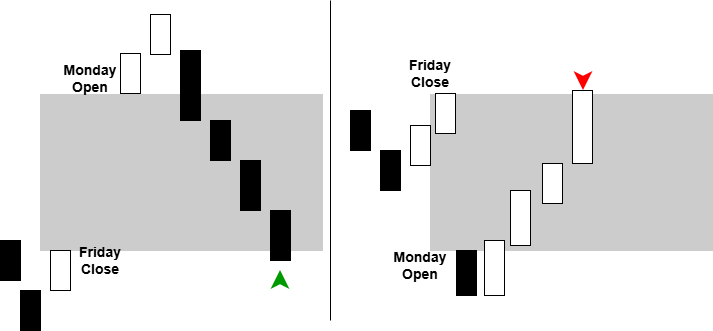
- Bullish Gap Trade—If Monday opens below the previous Friday close, creating a gap down, the expectation is that price will move upward toward the Friday close to fill the gap.
- Bearish Gap Trade—If Monday opens above the previous Friday close, creating a gap up, the expectation is that price will move downward toward the Friday close to fill the gap.
Trading Logic
The indicator developed in this article generates bullish and bearish trading signals together with corresponding stop-loss and take-profit levels. Since weekend gap detection and visualization were covered extensively in Part 71, the focus here is on how trading signals are derived from the gap structure itself.
The strategy uses the two boundaries that define the weekend gap. These boundaries are formed by the Friday closing price and the Monday opening price. Depending on whether Monday opens above or below Friday close, the upper and lower gap levels are assigned accordingly.
Bullish Setup
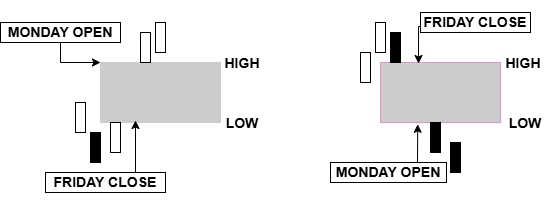
A bullish setup occurs when Monday opens below the previous Friday close, creating a gap down. In this case, the Monday open becomes the lower boundary of the gap, while the Friday close becomes the upper boundary.
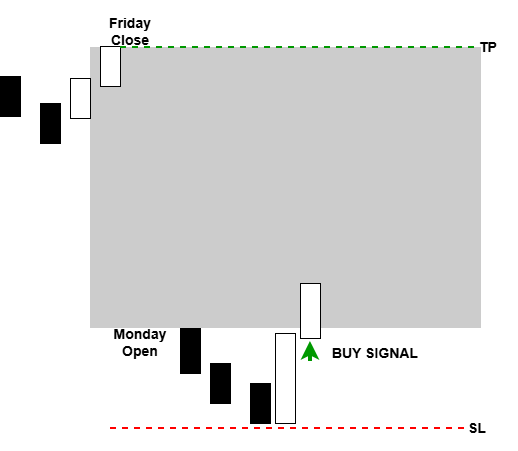
The assumption is that price may attempt to fill the gap by moving upward toward the Friday close. To identify a potential entry, the indicator monitors price action around the lower gap boundary. When a bullish candle closes above the gap low, this is interpreted as evidence that buyers are beginning to push price back into the gap. At that point, the indicator generates a bullish signal and displays an upward arrow.
The stop-loss level is placed at the most recently established swing low within the current trading week. This allows the trade enough room to develop while maintaining a logical invalidation point. The take-profit target is set at the upper gap boundary, which corresponds to the previous Friday close and represents the expected gap-fill destination.
Bearish Setup
A bearish setup occurs when Monday opens above the previous Friday close, creating a gap up. In this situation, the Monday open becomes the upper boundary of the gap, while the Friday close becomes the lower boundary.
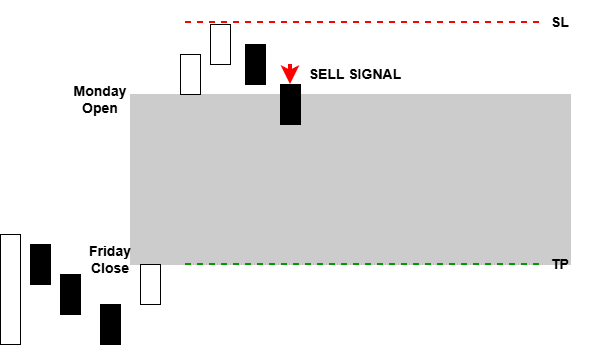
The expectation is that the price may move downward through the gap in an attempt to fill the untraded area. The indicator therefore monitors price action around the upper gap boundary. When a bearish candle closes below the gap high, the move is interpreted as a potential rejection of higher prices and a possible start of the gap-filling process. The indicator then generates a bearish signal and displays a downward arrow.
The stop-loss level is placed at the most recently established swing high within the current trading week, providing a natural risk boundary above the entry. The take-profit target is set at the lower gap boundary, which corresponds to the previous Friday close and serves as the anticipated gap-fill objective.
Signal Framework
The resulting framework transforms weekend gaps from simple chart annotations into actionable trading setups. Each signal consists of four components:
- Trade direction (buy or sell)
- Entry signal location
- Dynamic stop-loss level based on recent market structure
- Take-profit level based on the opposite gap boundary
Connecting Trading Rules to Indicator Logic
| Trading rule | Implementation |
|---|---|
| Weekend gap detection | Friday close and Monday open are compared in DetectAllGaps() |
| Signal validity window | The gap is processed only before the next Monday in ProcessBarForGap() |
| Entry confirmation | Candle-close confirmation is checked in ProcessBarForGap() |
| Stop-loss rule | SL is calculated from the week’s extreme in PublishSignal() |
| Take-profit rule | TP is set at the opposite gap boundary in PublishSignal() |
| Non-repainting behavior | Signals are rebuilt from closed bars in ScanHistoricalSignals() and CheckLiveSignals() |
| EA output | Signal price and TP/SL are written into the six buffers in RenderSignalBuffers() |
MQL5 Implementation
In this section, we build the indicator using a structured pipeline approach. The implementation is organized into clear stages that move from initialization to signal generation and finally to output handling.
This structure ensures that each part of the system is developed in a logical order, making it easier to understand how data flows from raw price input to final trading signals.
The overall architecture is summarized in the flowchart below.
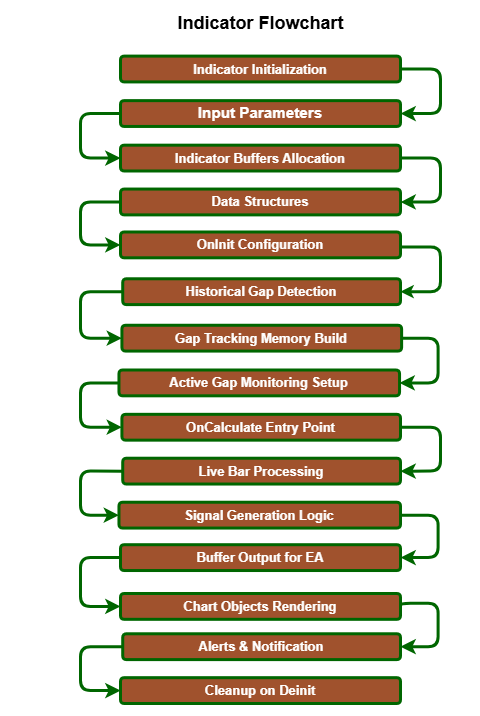
Each block in this flow represents a core stage of the implementation, starting from the initial setup and ending with real-time signal delivery and cleanup. The following subsections will walk through each stage in the same order shown in the diagram, mapping directly to the corresponding functions in the codebase.
Indicator Properties and Input Parameters
We begin with the standard #property directives that define how the indicator behaves on the chart. The indicator is attached to the main chart window because the weekend gap zones, arrows, and trade levels must appear directly over price action. We also declare six buffers in total, since the indicator needs two visible signal plots and four additional buffers for trade-level information.
These six buffers also serve as the interface between the indicator and any Expert Advisor that consumes its signals. BufferBuyArrow and BufferSellArrow store the signal price for buy and sell setups. BufferBuyTP and BufferBuySL store the corresponding take-profit and stop-loss values for buy signals, while BufferSellTP and BufferSellSL store the corresponding values for sell signals. A non-empty arrow buffer marks a confirmed signal bar, and the associated TP and SL buffers provide the trade levels that an EA can use for filtering or execution.
//+------------------------------------------------------------------+
//|                                        WeekendGapMultiSignal.mq5 |
//|                              Copyright 2026, Christian Benjamin. |
//|                           https://www.mql5.com/en/users/lynchris |
//+------------------------------------------------------------------+
#property copyright "Copyright 2026, Christian Benjamin."
#property link      "https://www.mql5.com/en/users/lynchris"
#property version   "1.0"
#property indicator_chart_window
#property indicator_buffers 6
#property indicator_plots   2

//--- visual properties for buy/sell arrows
#property indicator_label1  "Buy"
#property indicator_type1   DRAW_ARROW
#property indicator_color1  clrBlue
#property indicator_width1  2

#property indicator_label2  "Sell"
#property indicator_type2   DRAW_ARROW
#property indicator_color2  clrOrange
#property indicator_width2  2

//--- arrow symbols (wingdings)
#define ARROW_UP   233
#define ARROW_DOWN 234
The first two plots are used for the buy and sell arrows. These plots are configured with the Wingdings arrow codes 233 and 234, which give clear upward and downward markers. That makes the signal output easy to recognize visually, even when the chart contains several active gaps at the same time.
//+------------------------------------------------------------------+
//| Input parameters                                                 |
//+------------------------------------------------------------------+
input bool   ShowHistoricalGaps      = true;      // Show historical gap zones
input int    MaxHistoricalWeeks      = 26;       // Max weeks to scan backwards
input double MinGapPips              = 0.5;      // Minimum gap size to consider
input double MinTradableGapPips      = 1.0;      // Minimum gap size for signals
input bool   ShowDetailedLabels      = true;     // Show extra labels on gaps
input bool   ShowTradeLevels         = true;     // Draw TP/SL lines for signals
input double ConfirmationOffsetPips  = 0.0;      // Pips offset for signal confirmation
input double StopBufferPips          = 0.0;      // Extra pips beyond weekly high/low for SL
input color  ActiveFillColor         = clrGainsboro;  // Fill color for active gaps
input color  ActiveOutlineColor      = clrDimGray;    // Outline color for active gaps
input int    ActiveFillOpacity       = 45;            // Fill opacity (0-100)
input color  BuyArrowColor           = clrBlue;       // Buy arrow color
input color  SellArrowColor          = clrOrange;     // Sell arrow color
input color  TPLineColor             = clrBlue;       // Take profit line color
input color  SLLineColor             = clrTomato;     // Stop loss line color
input color  WeekSeparatorColor      = clrGray;       // Vertical line color
input int    WeekSeparatorStyle      = STYLE_DASH;    // Line style for week separators
input int    LineWidth               = 2;             // Rectangle border width
input int    FontSize                = 8;             // Label font size
input int    ArrowSize               = 2;             // Arrow symbol size
input bool   InvertSignals           = false;         // Invert generated signals (buy<->sell)
input bool   DrawWeekSeparators      = true;          // Draw vertical lines at week boundaries
input bool   EnableAlerts            = true;          // Show popup alerts
input bool   EnableSound             = false;         // Play sound on new signal
input string SoundFile               = "alert.wav";   // Sound file name
input bool   EnableNotification      = false;         // Send mobile notification
input bool   EnableEmail             = false;         // Send email on signal
Next, we define the input parameters. They control whether historical gaps are drawn, how far back the scan goes, minimum gap sizes (general and tradable), label and trade-level display, and the confirmation distance required to accept a signal. We also expose the settings for stop-loss buffering, rectangle colors, fill opacity, arrow colors, TP and SL colors, week separator style, line width, font size, arrow size, and all alert options.
EA-Compatible Buffer Architecture
We then define the indicator buffers that will carry the signal data. This part is important because the indicator is not only meant for chart visualization; it also needs to communicate with Expert Advisors through CopyBuffer().
BufferBuyArrow and BufferSellArrow store the actual plotted signal prices. When a valid buy or sell signal is confirmed, the matching buffer receives the price value at the bar where the signal occurred. This allows an EA to detect the exact signal bar without relying on chart objects.
//+------------------------------------------------------------------+
//| Indicator buffers                                                |
//+------------------------------------------------------------------+
double BufferBuyArrow[];   // Buy arrow prices
double BufferSellArrow[];  // Sell arrow prices
double BufferBuyTP[];      // Buy take profit levels (for information)
double BufferBuySL[];      // Buy stop loss levels
double BufferSellTP[];     // Sell take profit levels
double BufferSellSL[];     // Sell stop loss levels
The remaining buffers, BufferBuyTP, BufferBuySL, BufferSellTP, and BufferSellSL, store the take-profit and stop-loss values for the corresponding signals. These buffers provide extra trade context that an EA can use for filtering, risk management, or order placement.
This buffer layout keeps the design clean. The chart objects remain for human interpretation, while the buffers carry the machine-readable information. Since the buffers are written only after a candle is closed and a condition is confirmed, the indicator remains stable and non-repainting.
Core Data Structures
To manage the gap logic properly, we use two structured records.
The first is SignalRecord. We introduce this structure to store one confirmed signal in a compact and organized form. It keeps the signal time, the signal price, the take-profit value, the stop-loss value, and the direction of the signal. This gives every signal a full identity that can be reused later when the indicator renders arrows, draws trade levels, or rebuilds the buffer output.
//+------------------------------------------------------------------+
//| Structure: one trade signal                                      |
//+------------------------------------------------------------------+
struct SignalRecord
  {
   datetime          signalTime;     // Bar opening time of signal
   double            signalPrice;    // Price where arrow is drawn
   double            signalTP;       // Take profit level
   double            signalSL;       // Stop loss level
   bool              signalIsBuy;    // true = buy, false = sell
  };
The second structure is GapInfo. This record stores the complete state of one weekend gap. It contains the Monday opening time, the upper and lower gap boundaries, whether the gap is a gap down, whether the gap has been filled, the current weekly high and low, the last signal time, and an array of all signals generated from that gap.
//+------------------------------------------------------------------+
//| Structure: weekly gap information                                |
//+------------------------------------------------------------------+
struct GapInfo
  {
   datetime          monOpenTime;      // Monday 00:00 of this gap week
   double            gapHigh;          // Upper edge of gap (max of Fri close / Mon open)
   double            gapLow;           // Lower edge of gap
   bool              isGapDown;        // true if gap down (Fri close > Mon open)
   bool              gapFilled;        // Has price touched the opposite edge?
   int               scanStartIndex;   // Bar index where this week starts (for historical scan)
   double            weekLow;          // Lowest price seen so far this week
   double            weekHigh;         // Highest price seen so far this week
   datetime          lastSignalBarTime;// Last bar that generated a signal (avoid duplicates)
   SignalRecord      signals[];        // All signals recorded for this gap
  };
This structure is the heart of the indicator’s internal memory. Instead of treating a gap as a one-time event, the code keeps the gap alive for the whole week and allows it to produce more than one signal. That is why the signals[] array exists inside the gap record. It lets the indicator support true multi-signal behavior while still keeping every event linked to the same gap context.
Helper Utilities
Before moving into the main logic, we define a set of helper functions that support the rest of the code.
We begin with PipSize(), which returns the correct pip value depending on the current symbol digits. This is necessary because not every symbol is priced the same way. Forex pairs, indices, and commodities may have different precision formats, so the indicator must calculate pips correctly every time.
//+------------------------------------------------------------------+
//| Helper: return pip size for current symbol                       |
//+------------------------------------------------------------------+
double PipSize()
  {
   return (_Digits == 3 || _Digits == 5) ? (_Point * 10.0) : _Point;
  }
Next, we use PipOffset() to convert a pip value into a price offset. This is used in the confirmation logic and also for placing arrows slightly away from the candle body or wick so the chart remains easy to read.
//+------------------------------------------------------------------+
//| Helper: convert pips to price offset                             |
//+------------------------------------------------------------------+
double PipOffset(double pips)
  {
   return pips * PipSize();
  }
ColorSetAlpha() is another important helper. It applies transparency to colors so the rectangle fills can appear semi-transparent. This makes the gap zones visible without hiding the candles behind them.
//+------------------------------------------------------------------+
//| Helper: apply alpha transparency to a color                      |
//+------------------------------------------------------------------+
color ColorSetAlpha(color clr, uchar alpha)
  {
   return (color)((clr & 0x00FFFFFF) | ((uint)alpha << 24));
  }
We also define GetNextMondayOpen() to calculate the next weekly boundary. This is used when drawing the rectangle and trade levels across the full life span of a gap. PrefixForIndex() generates unique object names for each gap, which prevents name collisions when several gaps are drawn on the same chart.
//+------------------------------------------------------------------+
//| Helper: return next Monday 00:00 after given Monday              |
//+------------------------------------------------------------------+
datetime GetNextMondayOpen(datetime monday)
  {
   return monday + 7 * 86400;
  }

//+------------------------------------------------------------------+
//| Helper: generate unique prefix string for a gap index            |
//+------------------------------------------------------------------+
string PrefixForIndex(int idx)
  {
   return "WG_" + IntegerToString(idx);
  }
CandleTouchesLevel() checks whether a candle range touches a specific price level. This helper is used during fill detection. GapPips() returns the size of a gap in pips, while IsTradableGap() compares that size against the minimum tradable threshold.
//+------------------------------------------------------------------+
//| Helper: check if candle's high/low range contains a level        |
//+------------------------------------------------------------------+
bool CandleTouchesLevel(double hi, double lo, double lvl)
  {
   return (hi >= lvl && lo <= lvl);
  }

//+------------------------------------------------------------------+
//| Helper: return gap size in pips for given gap index              |
//+------------------------------------------------------------------+
double GapPips(int gapIdx)
  {
   if(gapIdx < 0 || gapIdx >= ArraySize(g_gaps))
      return 0.0;
   return MathAbs(g_gaps[gapIdx].gapHigh - g_gaps[gapIdx].gapLow) / PipSize();
  }

//+------------------------------------------------------------------+
//| Helper: check if gap meets the tradable size threshold           |
//+------------------------------------------------------------------+
bool IsTradableGap(int gapIdx)
  {
   return (GapPips(gapIdx) >= MinTradableGapPips);
  }
Finally, we implement DoAlert() for alert delivery and DeleteWGObjects() for cleanup. These helpers keep the main functions focused and make the code easier to maintain.
//+------------------------------------------------------------------+
//| Alert dispatcher: popup, sound, push, email                      |
//+------------------------------------------------------------------+
void DoAlert(string msg, bool sound, bool push, bool mail)
  {
   if(!EnableAlerts)
      return;
   Alert(msg);
   if(sound)
      PlaySound(SoundFile);
   if(push)
      SendNotification(msg);
   if(mail)
      SendMail("Weekend Gap Signal", msg);
  }

//+------------------------------------------------------------------+
//| Delete all chart objects prefixed with "WG_"                     |
//+------------------------------------------------------------------+
void DeleteWGObjects()
  {
   const long chart_id = 0;
   int total = ObjectsTotal(chart_id, 0, -1);
   for(int i = total - 1; i >= 0; --i)
     {
      string name = ObjectName(chart_id, i, 0, -1);
      if(StringFind(name, "WG_") == 0)
         ObjectDelete(chart_id, name);
     }
  }
Initialization and Cleanup
The OnInit() function prepares the indicator for operation. We begin by deleting any old chart objects that belong to the indicator, so the chart starts from a clean state. After that, we bind the six buffers using SetIndexBuffer(). The first two buffers are attached as visible signal buffers, and the remaining four are attached as calculation buffers.
//+------------------------------------------------------------------+
//| Indicator initialization function                                 |
//+------------------------------------------------------------------+
int OnInit()
  {
//--- remove old objects
   DeleteWGObjects();

//--- set indicator buffers
   SetIndexBuffer(0, BufferBuyArrow, INDICATOR_DATA);
   SetIndexBuffer(1, BufferSellArrow, INDICATOR_DATA);
   SetIndexBuffer(2, BufferBuyTP, INDICATOR_CALCULATIONS);
   SetIndexBuffer(3, BufferBuySL, INDICATOR_CALCULATIONS);
   SetIndexBuffer(4, BufferSellTP, INDICATOR_CALCULATIONS);
   SetIndexBuffer(5, BufferSellSL, INDICATOR_CALCULATIONS);

//--- configure arrow plots
   PlotIndexSetInteger(0, PLOT_ARROW, ARROW_UP);
   PlotIndexSetInteger(1, PLOT_ARROW, ARROW_DOWN);
   PlotIndexSetInteger(0, PLOT_LINE_WIDTH, ArrowSize);
   PlotIndexSetInteger(1, PLOT_LINE_WIDTH, ArrowSize);
   PlotIndexSetInteger(0, PLOT_LINE_COLOR, 0, BuyArrowColor);
   PlotIndexSetInteger(1, PLOT_LINE_COLOR, 0, SellArrowColor);

//--- series orientation for easy indexing
   ArraySetAsSeries(BufferBuyArrow, true);
   ArraySetAsSeries(BufferSellArrow, true);
   ArraySetAsSeries(BufferBuyTP, true);
   ArraySetAsSeries(BufferBuySL, true);
   ArraySetAsSeries(BufferSellTP, true);
   ArraySetAsSeries(BufferSellSL, true);

//--- initialise buffers with empty values
   ArrayInitialize(BufferBuyArrow, EMPTY_VALUE);
   ArrayInitialize(BufferSellArrow, EMPTY_VALUE);
   ArrayInitialize(BufferBuyTP, EMPTY_VALUE);
   ArrayInitialize(BufferBuySL, EMPTY_VALUE);
   ArrayInitialize(BufferSellTP, EMPTY_VALUE);
   ArrayInitialize(BufferSellSL, EMPTY_VALUE);

//--- set short name for the indicator (as it appears in the chart)
   IndicatorSetString(INDICATOR_SHORTNAME, "Weekend Gap Multi-Signal");

   g_firstRun = true;
   g_lastBarTime = 0;
   return INIT_SUCCEEDED;
  }
Once the buffers are registered, we configure the arrow plots with the correct Wingdings codes, line widths, and colors. Then we set the buffers into series mode so the newest bar is always at index 0. This matches the indexing style used by the price arrays in the rest of the indicator.
After the buffers are configured, we initialize them to EMPTY_VALUE. That step is important because it prevents old or invalid values from appearing on the chart before any signal has been confirmed. We also set the indicator short name and reset the first-run flags so the main calculation loop knows that it must perform a complete historical scan the first time it runs.
//+------------------------------------------------------------------+
//| Indicator deinitialization function                               |
//+------------------------------------------------------------------+
void OnDeinit(const int reason)
  {
   DeleteWGObjects();
   ArrayFree(g_gaps);
  }
The cleanup side is handled by OnDeinit(). Here we remove all chart objects created by the indicator and free the global gap array. This matters because the indicator creates multiple objects per gap: rectangles, labels, separators, arrows, and trade levels. A proper cleanup routine keeps the chart tidy and prevents leftover objects from remaining after the indicator is removed.
Detecting Weekend Gaps
The first major analytical function is DetectAllGaps(). We implement this function to scan the historical bars and find the time break that usually appears between Friday close and Monday open. A gap is recognized when the time difference between two consecutive bars is at least 172800 seconds, which corresponds to two full days.
Once such a break is found, the function reads the Monday open and the previous Friday close. It then calculates the gap size in pips using PipSize(). If the size meets the minimum threshold defined by MinGapPips, the function creates a new GapInfo record and adds it to the global gap array.
//+------------------------------------------------------------------+
//| Scan entire history to detect all weekly gaps                    |
//+------------------------------------------------------------------+
void DetectAllGaps()
  {
   ArrayResize(g_gaps, 0);
   int bars = Bars(_Symbol, _Period);
   if(bars < 3)
      return;

//--- load historical price data
   datetime timeArr[];
   double openArr[], closeArr[];
   ArraySetAsSeries(timeArr, true);
   ArraySetAsSeries(openArr, true);
   ArraySetAsSeries(closeArr, true);
   if(CopyTime(_Symbol, _Period, 0, bars, timeArr) <= 0)
      return;
   if(CopyOpen(_Symbol, _Period, 0, bars, openArr) <= 0)
      return;
   if(CopyClose(_Symbol, _Period, 0, bars, closeArr) <= 0)
      return;

   double pip = PipSize();
   int barsPerWeek = (int)((7 * 86400) / PeriodSeconds(_Period));
   if(barsPerWeek < 1)
      barsPerWeek = 1;
   int limit = MathMin(bars - 2, MaxHistoricalWeeks * barsPerWeek);
   if(limit < 1)
      return;

//--- iterate bars to find weekend gaps
   for(int i = 0; i < limit; i++)
     {
      double diff = (double)(timeArr[i] - timeArr[i + 1]);
      if(diff >= 172800)
        {
         double mondayOpen = openArr[i];
         double fridayClose = closeArr[i + 1];
         double gapPips = MathAbs(mondayOpen - fridayClose) / pip;
         if(gapPips >= MinGapPips && !GapExistsByMonOpen(timeArr[i]))
           {
            GapInfo gap;
            gap.monOpenTime = timeArr[i];
            gap.gapHigh = MathMax(mondayOpen, fridayClose);
            gap.gapLow = MathMin(mondayOpen, fridayClose);
            gap.isGapDown = (fridayClose > mondayOpen);
            gap.gapFilled = false;
            gap.scanStartIndex = i;
            gap.weekLow = 0;
            gap.weekHigh = 0;
            gap.lastSignalBarTime = 0;
            ArrayResize(gap.signals, 0);
            AddGap(gap);
           }
        }
     }
  }
At this stage, the indicator stores the gap boundaries, the gap direction, the weekly timing, and the default tracking values. It also determines whether the gap belongs to the current week or to a previous week. That distinction matters because the current week is monitored live, while older gaps may only be displayed for reference or used for historical reconstruction.
This detection stage is the starting point for the entire indicator. Without a correct gap database, nothing else in the signal logic would have a meaningful base to work from.
Historical Signal Reconstruction
Once the gap database has been built, the next challenge is reconstructing how those gaps behaved in the past. Without this step, the indicator would only begin generating signals from the moment it is attached to the chart. To solve that problem, we implement ScanHistoricalSignals(), which replays historical price action and rebuilds all valid signals using the same logic employed during live execution.
We walk through each detected gap and scan bars from the gap start to the next Monday boundary. For each bar, we call ProcessBarForGap() in historical mode. That is an important design choice because it allows the same logic to be used both historically and live, which keeps the behavior consistent.
//+------------------------------------------------------------------+
//| Scan historical signals for all detected gaps                    |
//+------------------------------------------------------------------+
void ScanHistoricalSignals()
  {
   int bars = Bars(_Symbol, _Period);
   if(bars < 3)
      return;

//--- load price arrays for scanning
   datetime timeArr[];
   double highArr[], lowArr[], closeArr[];
   ArraySetAsSeries(timeArr, true);
   ArraySetAsSeries(highArr, true);
   ArraySetAsSeries(lowArr, true);
   ArraySetAsSeries(closeArr, true);
   if(CopyTime(_Symbol, _Period, 0, bars, timeArr) <= 0)
      return;
   if(CopyHigh(_Symbol, _Period, 0, bars, highArr) <= 0)
      return;
   if(CopyLow(_Symbol, _Period, 0, bars, lowArr) <= 0)
      return;
   if(CopyClose(_Symbol, _Period, 0, bars, closeArr) <= 0)
      return;

//--- for each gap, walk forward from Monday and simulate signals
   for(int g = 0; g < ArraySize(g_gaps); g++)
     {
      int mondayIdx = g_gaps[g].scanStartIndex;
      if(mondayIdx < 0 || mondayIdx >= bars)
         continue;
      datetime nextMonday = g_gaps[g].monOpenTime + 7 * 86400;
      for(int s = mondayIdx - 1; s >= 0; s--)
        {
         if(timeArr[s] >= nextMonday)
            break;
         ProcessBarForGap(g, s, highArr, lowArr, closeArr, timeArr, true);
         if(g_gaps[g].gapFilled)
            break;
        }
     }
  }
The reason for this reconstruction step is simple: when the indicator is loaded onto a chart that already contains history, the user should not only see current signals from that moment forward. They should also see how the indicator would have behaved in the past. Since the scan uses already-closed historical bars, the output remains deterministic and non-repainting.
The historical scan also prepares the indicator buffers. That means an Expert Advisor can access reconstructed signals just as it would access live ones. This makes the indicator useful for visual review, strategy testing, and historical comparison.
Bar-by-Bar Gap Processing
The core processing function is ProcessBarForGap(). We implement this function to handle one bar for one gap at a time. It is responsible for checking whether the bar belongs to the valid time window, updating the weekly extremes, deciding whether the gap has been filled, and identifying whether a signal condition has been met.
The function begins by making sure the bar is inside the active life span of the gap. It ignores bars before the gap starts, bars after the next Monday boundary, gaps that are already filled, and gaps that do not meet the tradable threshold. These checks keep the logic clean and prevent unnecessary processing.
//+------------------------------------------------------------------+
//| Process a single bar for a given gap: signal detection & fill    |
//+------------------------------------------------------------------+
void ProcessBarForGap(int gapIdx, int shift, const double &high[], const double &low[],
                      const double &close[], const datetime &time[], bool historical=false)
  {
   if(gapIdx < 0 || gapIdx >= ArraySize(g_gaps))
      return;
   if(time[shift] <= g_gaps[gapIdx].monOpenTime)
      return;
   datetime nextMonday = g_gaps[gapIdx].monOpenTime + 7 * 86400;
   if(time[shift] >= nextMonday)
      return;
   if(g_gaps[gapIdx].gapFilled)
      return;
   if(!IsTradableGap(gapIdx))
      return;

//--- initialise weekly high/low if not set
   if(g_gaps[gapIdx].weekLow == 0)
      g_gaps[gapIdx].weekLow = g_gaps[gapIdx].gapLow;
   if(g_gaps[gapIdx].weekHigh == 0)
      g_gaps[gapIdx].weekHigh = g_gaps[gapIdx].gapHigh;

//--- update weekly extremes
   if(high[shift] > g_gaps[gapIdx].weekHigh)
      g_gaps[gapIdx].weekHigh = high[shift];
   if(low[shift] < g_gaps[gapIdx].weekLow)
      g_gaps[gapIdx].weekLow = low[shift];

//--- check if gap got filled (price touches the opposite edge)
   if((g_gaps[gapIdx].isGapDown && CandleTouchesLevel(high[shift], low[shift], g_gaps[gapIdx].gapHigh)) ||
      (!g_gaps[gapIdx].isGapDown && CandleTouchesLevel(high[shift], low[shift], g_gaps[gapIdx].gapLow)))
     {
      g_gaps[gapIdx].gapFilled = true;
      return;
     }

//--- determine raw signal conditions (using confirmation offset for logic)
   bool buySignal = false, sellSignal = false;
   if(g_gaps[gapIdx].isGapDown)
     {
      buySignal = (low[shift] <= (g_gaps[gapIdx].gapLow + PipOffset(ConfirmationOffsetPips)) &&
                   close[shift] > g_gaps[gapIdx].gapLow);
     }
   else
     {
      sellSignal = (high[shift] >= (g_gaps[gapIdx].gapHigh - PipOffset(ConfirmationOffsetPips)) &&
                    close[shift] < g_gaps[gapIdx].gapHigh);
     }

   bool signalNow = (buySignal || sellSignal);
   if(signalNow && g_gaps[gapIdx].lastSignalBarTime != time[shift])
     {
      bool isBuy = buySignal;
      if(InvertSignals)
         isBuy = !isBuy;
      PublishSignal(gapIdx, shift, isBuy, historical, time, high, low);
     }
  }
If the gap is still active, the function initializes the weekly low and high if needed, then updates them with the current bar’s high and low. These values are important because they later help determine the stop-loss placement for any signal that is generated.
The next step is fill detection. We use the candle range to check whether price has touched the opposite boundary of the gap. For a gap down, fill occurs when price reaches the upper edge. For a gap up, fill occurs when price reaches the lower edge. Once fill is detected, the gap is marked as filled and processing for that gap stops.
If the gap is still active after the fill check, the function evaluates the actual buy or sell conditions. For a gap down, a buy setup may appear when price moves into the lower part of the gap and confirms back above it. For a gap up, a sell setup may appear when price moves into the upper part of the gap and confirms back below it. The ConfirmationOffsetPips input gives the trader control over how strict that confirmation should be.
When a valid condition is found, the function calls PublishSignal() so the signal can be stored and displayed properly.
Live Signal Monitoring
To handle real-time chart updates, we implement CheckLiveSignals(). This function processes only the latest completed bar, which is the correct way to maintain a non-repainting indicator. The still-forming candle is ignored because its final close is not yet known.
//+------------------------------------------------------------------+
//| Check for new signals on the current (latest) bar                |
//+------------------------------------------------------------------+
void CheckLiveSignals(const datetime &time[], const double &high[],
                      const double &low[], const double &close[])
  {
   int shift = 1;
   if(ArraySize(time) <= shift + 1)
      return;

   for(int g = 0; g < ArraySize(g_gaps); g++)
     {
      datetime nextMonday = g_gaps[g].monOpenTime + 7 * 86400;
      if(time[shift] >= nextMonday)
         continue;
      ProcessBarForGap(g, shift, high, low, close, time, false);
     }
  }
This function loops through every active gap and sends the latest closed bar into ProcessBarForGap(). If the bar still lies inside the active weekly window, the gap is checked for a new signal. This means the indicator can continue producing valid opportunities while the gap remains open during the week.
This live monitoring logic keeps the indicator responsive without sacrificing reliability. It uses the same rules as the historical scan, which means the live output and the backtested output remain consistent.
Publishing Signals
Whenever ProcessBarForGap() identifies a valid setup, it calls PublishSignal(). This function stores the signal in the gap’s signal array and also prepares the output for the chart and the buffers.
We use PublishSignal() to determine the signal direction, place the arrow price, calculate the TP level, calculate the SL level, and write the result into the corresponding signal record. By default, a gap down produces a buy signal and a gap up produces a sell signal, but that direction can be reversed through InvertSignals.
//+------------------------------------------------------------------+
//| Record a new signal and draw its objects/alert                   |
//+------------------------------------------------------------------+
void PublishSignal(int gapIdx, int barIdx, bool isBuy, bool isHistorical,
                   const datetime &time[], const double &high[], const double &low[])
  {
   SignalRecord newSig;
   newSig.signalTime  = time[barIdx];
   newSig.signalIsBuy = isBuy;

//--- visual arrow placement: always 2 pips away from candle edge to avoid overlap
   double visualOffset = PipOffset(2.0);
   newSig.signalPrice = isBuy ? (low[barIdx] - visualOffset) : (high[barIdx] + visualOffset);
   newSig.signalTP    = isBuy ? g_gaps[gapIdx].gapHigh : g_gaps[gapIdx].gapLow;
   newSig.signalSL    = isBuy ? (g_gaps[gapIdx].weekLow - PipOffset(StopBufferPips))
                        : (g_gaps[gapIdx].weekHigh + PipOffset(StopBufferPips));

//--- store signal
   int sz = ArraySize(g_gaps[gapIdx].signals);
   ArrayResize(g_gaps[gapIdx].signals, sz + 1);
   g_gaps[gapIdx].signals[sz] = newSig;
   g_gaps[gapIdx].lastSignalBarTime = time[barIdx];

//--- draw TP/SL levels if requested
   if(ShowTradeLevels)
      DrawTradeLevels(gapIdx, sz, PrefixForIndex(gapIdx));

//--- for live signals (not historical), send alerts and print
   if(!isHistorical)
     {
      string signalType = isBuy ? "BUY" : "SELL";
      string msg = StringFormat("Weekend Gap %s signal on %s %s at %s | TP: %.*f | SL: %.*f",
                                signalType, _Symbol, EnumToString((ENUM_TIMEFRAMES)_Period),
                                TimeToString(newSig.signalTime, TIME_DATE | TIME_MINUTES),
                                _Digits, newSig.signalTP, _Digits, newSig.signalSL);
      DoAlert(msg, EnableSound, EnableNotification, EnableEmail);
      Print(msg);
     }
  }
The signal price is offset slightly away from the candle so the arrow remains visible and does not overlap the bar. The TP is placed at the opposite gap boundary, while the SL is calculated from the weekly extreme plus the optional stop buffer. That gives each signal a complete trade structure rather than just a directional marker.
If the signal is a live one, the function also sends alerts and prints the event to the terminal. Historical signals are stored quietly without notifications, so the chart can be reconstructed without unnecessary message spam.
Trade-Level Drawing
If ShowTradeLevels is enabled, PublishSignal() also calls DrawTradeLevels(). We use this function to draw the TP and SL lines for each signal so the chart shows the full structure of the setup.
The TP and SL lines begin at the signal time and extend to the end of the gap week. This keeps the trade levels aligned with the same weekly window used by the rest of the indicator. Because the lines are named using both the gap index and the signal index, multiple signals from the same gap can each keep their own separate TP and SL objects.
//+------------------------------------------------------------------+
//| Draw TP/SL trend lines for a specific signal                     |
//+------------------------------------------------------------------+
void DrawTradeLevels(int gapIdx, int sigIdx, string prefix)
  {
   if(!ShowTradeLevels)
      return;
   if(gapIdx < 0 || gapIdx >= ArraySize(g_gaps))
      return;
   if(sigIdx < 0 || sigIdx >= ArraySize(g_gaps[gapIdx].signals))
      return;

   SignalRecord sig = g_gaps[gapIdx].signals[sigIdx];
   datetime endTime = g_gaps[gapIdx].monOpenTime + 7 * 86400;
   string id = prefix + "_S" + IntegerToString(sigIdx);
   string tpName = id + "_TP";
   string slName = id + "_SL";

   ObjectDelete(0, tpName);
   ObjectDelete(0, slName);

//--- draw take profit line (horizontal from signal time to week end)
   ObjectCreate(0, tpName, OBJ_TREND, 0, sig.signalTime, sig.signalTP, endTime, sig.signalTP);
   ObjectSetInteger(0, tpName, OBJPROP_COLOR, TPLineColor);
   ObjectSetInteger(0, tpName, OBJPROP_WIDTH, 2);
   ObjectSetInteger(0, tpName, OBJPROP_RAY_RIGHT, false);

//--- draw stop loss line
   ObjectCreate(0, slName, OBJ_TREND, 0, sig.signalTime, sig.signalSL, endTime, sig.signalSL);
   ObjectSetInteger(0, slName, OBJPROP_COLOR, SLLineColor);
   ObjectSetInteger(0, slName, OBJPROP_WIDTH, 2);
   ObjectSetInteger(0, slName, OBJPROP_RAY_RIGHT, false);
  }
This part of the implementation is especially useful for visual analysis. The trader can immediately see the target and risk structure of every signal without needing to calculate levels manually.
Chart Objects for Gap Visualization
The function CreateGapObjects() handles the main chart drawing for each gap. We implement this function to create the rectangle, midpoint line, primary label, detailed labels, and week separator.
The rectangle spans from the Monday open of the gap week to the next Monday boundary. Its vertical range is defined by the gap’s upper and lower levels. The fill is transparent enough to keep the candles visible while still making the gap area easy to recognize. The rectangle is drawn behind the bars so it does not obstruct price action.
//+------------------------------------------------------------------+
//| Create visual objects for a gap (rectangle, midline, labels)     |
//+------------------------------------------------------------------+
void CreateGapObjects(int gapIdx, string prefix)
  {
   if(!ShowHistoricalGaps || gapIdx < 0 || gapIdx >= ArraySize(g_gaps))
      return;

//--- draw week separator if enabled
   if(DrawWeekSeparators)
     {
      int weekNum = (int)(g_gaps[gapIdx].monOpenTime / 86400 / 7);
      DrawWeekSeparator(g_gaps[gapIdx].monOpenTime, weekNum);
     }

   datetime leftTime   = g_gaps[gapIdx].monOpenTime;
   datetime rightTime  = GetNextMondayOpen(leftTime);
   long     weekLength = rightTime - leftTime;
   double   mid        = (g_gaps[gapIdx].gapHigh + g_gaps[gapIdx].gapLow) / 2.0;

   string rect = prefix + "_RECT";
   string midL = prefix + "_MID";
   string lbl  = prefix + "_LBL";

//--- gap rectangle
   if(ObjectFind(0, rect) < 0)
     {
      ObjectCreate(0, rect, OBJ_RECTANGLE, 0, leftTime, g_gaps[gapIdx].gapHigh, rightTime, g_gaps[gapIdx].gapLow);
      ObjectSetInteger(0, rect, OBJPROP_COLOR, ActiveOutlineColor);
      ObjectSetInteger(0, rect, OBJPROP_WIDTH, LineWidth);
      ObjectSetInteger(0, rect, OBJPROP_FILL, true);
      ObjectSetInteger(0, rect, OBJPROP_BGCOLOR, ColorSetAlpha(ActiveFillColor, (uchar)(ActiveFillOpacity * 255 / 100)));
      ObjectSetInteger(0, rect, OBJPROP_BACK, true);
     }

//--- midline (solid yellow for clear visibility)
   if(ObjectFind(0, midL) < 0)
     {
      ObjectCreate(0, midL, OBJ_TREND, 0, leftTime, mid, rightTime, mid);
      ObjectSetInteger(0, midL, OBJPROP_COLOR, clrYellow);
      ObjectSetInteger(0, midL, OBJPROP_STYLE, STYLE_SOLID);
      ObjectSetInteger(0, midL, OBJPROP_WIDTH, 2);
      ObjectSetInteger(0, midL, OBJPROP_BACK, true);
     }

//--- main label showing gap size
   if(ObjectFind(0, lbl) < 0)
     {
      datetime labelTime = (datetime)(leftTime + (long)(weekLength * 0.25));
      DrawTextLabel(lbl, labelTime, mid, StringFormat("WG | %.1fp", GapPips(gapIdx)), clrBlack, FontSize, "Arial Bold", ANCHOR_CENTER);
     }

//--- detailed labels (Friday close, Monday open, midpoint)
   if(ShowDetailedLabels)
     {
      datetime detailTime = (datetime)(leftTime + (long)(weekLength * 0.05));
      double gapHeight    = g_gaps[gapIdx].gapHigh - g_gaps[gapIdx].gapLow;
      double offset       = gapHeight * 0.1;
      int smallFont       = MathMax(FontSize - 1, 6);

      string topText;
      string botText;

      if(g_gaps[gapIdx].isGapDown)
        {
         topText = "FRIDAY CLOSE";
         botText = "MONDAY OPEN";
        }
      else
        {
         topText = "MONDAY OPEN";
         botText = "FRIDAY CLOSE";
        }

      DrawTextLabel(prefix + "_TOP", detailTime, g_gaps[gapIdx].gapHigh - offset, topText, clrBlack, smallFont, "Arial");
      DrawTextLabel(prefix + "_BOT", detailTime, g_gaps[gapIdx].gapLow + offset,  botText, clrBlack, smallFont, "Arial");
      DrawTextLabel(prefix + "_MIDPRICE", detailTime, mid,                        "MIDPOINT",     clrBlack, smallFont, "Arial");
     }
  }
The midpoint line is added to give the user a quick center reference. The primary label displays the gap size in pips, and if ShowDetailedLabels is enabled, the indicator also shows the Friday close, Monday open, and midpoint values. These labels make the gap easier to inspect visually and help the user understand how the zone was formed.
The same function also calls DrawWeekSeparator() so each Monday boundary can be marked with a vertical line. This is especially helpful when several weeks of gaps are shown on the same chart.
Updating Gap Visuals
Once signals begin to appear, we use UpdateGapVisuals() to refresh the appearance of the gap objects. This function keeps the chart aligned with the internal state of the indicator.
If the gap already has one or more signals, the rectangle color is updated to match the most recent signal direction. The label text is also changed so the user can see whether the latest event was a buy or a sell. If the gap has not yet produced any signal, the default neutral style is retained.
//+------------------------------------------------------------------+
//| Update visuals when gap state changes (signal added, filled)     |
//+------------------------------------------------------------------+
void UpdateGapVisuals(int gapIdx, string prefix)
  {
   if(!ShowHistoricalGaps || gapIdx < 0 || gapIdx >= ArraySize(g_gaps))
      return;

   string rect = prefix + "_RECT";
   string lbl  = prefix + "_LBL";

   if(ObjectFind(0, rect) < 0)
      return;

   int sigCount = ArraySize(g_gaps[gapIdx].signals);

//--- if there is at least one signal, highlight rectangle with signal color
   if(sigCount > 0)
     {
      SignalRecord latest = g_gaps[gapIdx].signals[sigCount - 1];
      color sigColor = latest.signalIsBuy ? clrLimeGreen : clrRed;
      ObjectSetInteger(0, rect, OBJPROP_COLOR, sigColor);
      ObjectSetInteger(0, rect, OBJPROP_FILL, true);
      //--- use semi-transparent version of signal color for background
      color bgColor = ColorSetAlpha(sigColor, 60);
      ObjectSetInteger(0, rect, OBJPROP_BGCOLOR, bgColor);

      if(ObjectFind(0, lbl) >= 0)
        {
         ObjectSetInteger(0, lbl, OBJPROP_COLOR, clrBlack);
         string side = latest.signalIsBuy ? "BUY" : "SELL";
         ObjectSetString(0, lbl, OBJPROP_TEXT, StringFormat("WG | %.1fp | %s", GapPips(gapIdx), side));
        }
      return;
     }

//--- no signal: default inactive appearance
   ObjectSetInteger(0, rect, OBJPROP_COLOR, ActiveOutlineColor);
   ObjectSetInteger(0, rect, OBJPROP_STYLE, STYLE_SOLID);
   ObjectSetInteger(0, rect, OBJPROP_WIDTH, LineWidth);
   ObjectSetInteger(0, rect, OBJPROP_FILL, true);
   ObjectSetInteger(0, rect, OBJPROP_BGCOLOR, ColorSetAlpha(ActiveFillColor, (uchar)(ActiveFillOpacity * 255 / 100)));

   if(ObjectFind(0, lbl) >= 0)
     {
      ObjectSetInteger(0, lbl, OBJPROP_COLOR, clrBlack);
      ObjectSetString(0, lbl, OBJPROP_TEXT, StringFormat("WG | %.1fp", GapPips(gapIdx)));
     }
  }
This visual update matters because the chart should not treat every gap the same way. A fresh gap, an active gap, and a gap that has already generated a signal should all be easy to distinguish. By updating the visuals dynamically, the indicator gives immediate feedback on the state of each zone.
Week Separators and Text Labels
DrawWeekSeparator() creates the vertical line at the start of each gap week. We implement it to keep the chart organized and to make weekly boundaries easy to spot.
The function checks whether the separator already exists before creating a new one. That avoids duplicate objects when more than one gap belongs to the same week. The color, style, and width of the separator are all controlled by user inputs, so the chart can be styled to match different preferences.
//+------------------------------------------------------------------+
//| Draw a vertical line to separate weeks                           |
//+------------------------------------------------------------------+
void DrawWeekSeparator(datetime lineTime, int weekNumber)
  {
   if(!DrawWeekSeparators)
      return;
   string objName = "WG_WeekSep_" + IntegerToString(weekNumber);
   if(ObjectFind(0, objName) >= 0)
      return;
   ObjectCreate(0, objName, OBJ_VLINE, 0, lineTime, 0);
   ObjectSetInteger(0, objName, OBJPROP_COLOR, WeekSeparatorColor);
   ObjectSetInteger(0, objName, OBJPROP_STYLE, WeekSeparatorStyle);
   ObjectSetInteger(0, objName, OBJPROP_WIDTH, 1);
   ObjectSetInteger(0, objName, OBJPROP_BACK, true);
  }
DrawTextLabel() is the reusable helper that creates and updates text objects on the chart. We use it for the main label and the detailed labels so the formatting remains consistent. It also lets us move existing labels rather than recreating them every time the chart refreshes.
//+------------------------------------------------------------------+
//| Draw or update a text label on the chart                         |
//+------------------------------------------------------------------+
void DrawTextLabel(string name, datetime t, double p, string txt, color clr, int sz, string font, int anchor = ANCHOR_LEFT)
  {
   if(ObjectFind(0, name) < 0)
      ObjectCreate(0, name, OBJ_TEXT, 0, t, p);
   else
      ObjectMove(0, name, 0, t, p);

   ObjectSetString(0, name, OBJPROP_TEXT, txt);
   ObjectSetInteger(0, name, OBJPROP_FONTSIZE, sz);
   ObjectSetInteger(0, name, OBJPROP_COLOR, clr);
   ObjectSetString(0, name, OBJPROP_FONT, font);
   ObjectSetInteger(0, name, OBJPROP_ANCHOR, anchor);
  }
Main Calculation Loop
All of the pieces come together inside OnCalculate(). This function is the main execution engine of the indicator and it controls both the first historical pass and the live incremental updates.
On the first run, OnCalculate() calls DetectAllGaps() and ScanHistoricalSignals(). It then creates the chart objects for every detected gap and updates their appearance. After that, it calls RenderSignalBuffers() so the historical signals are written into the indicator buffers.
//+------------------------------------------------------------------+
//| Custom indicator iteration function (main calculation)           |
//+------------------------------------------------------------------+
int OnCalculate(const int rates_total,
                const int prev_calculated,
                const datetime &time[],
                const double &open[],
                const double &high[],
                const double &low[],
                const double &close[],
                const long &tick_volume[],
                const long &volume[],
                const int &spread[])
  {
//--- ensure all arrays are series-aligned (newest bar at index 0)
   ArraySetAsSeries(time, true);
   ArraySetAsSeries(open, true);
   ArraySetAsSeries(high, true);
   ArraySetAsSeries(low, true);
   ArraySetAsSeries(close, true);

   if(rates_total < 3)
      return 0;

//--- detect new bar (closed bar)
   bool newBar = (time[0] != g_lastBarTime);
   if(newBar)
      g_lastBarTime = time[0];

//--- first run or full recalculation: build gap database and historical signals
   if(prev_calculated == 0 || g_firstRun)
     {
      DetectAllGaps();
      ScanHistoricalSignals();

      if(ShowHistoricalGaps)
        {
         for(int g = 0; g < ArraySize(g_gaps); g++)
           {
            string prefix = PrefixForIndex(g);
            CreateGapObjects(g, prefix);
            UpdateGapVisuals(g, prefix);
           }
        }

      RenderSignalBuffers(rates_total);
      g_firstRun = false;
      return rates_total;
     }

//--- on a new bar, check for new gaps and live signals
   if(newBar)
     {
      //--- detect potential new weekend gap using closed bars only
      if((time[1] - time[2]) >= 172800)
        {
         if(!GapExistsByMonOpen(time[1]))
           {
            double mondayOpen = open[1];
            double fridayClose = close[2];
            double gp = MathAbs(mondayOpen - fridayClose) / PipSize();
            if(gp >= MinGapPips)
              {
               GapInfo gap;
               gap.monOpenTime = time[1];
               gap.gapHigh = MathMax(mondayOpen, fridayClose);
               gap.gapLow = MathMin(mondayOpen, fridayClose);
               gap.isGapDown = (fridayClose > mondayOpen);
               gap.gapFilled = false;
               gap.scanStartIndex = 1;
               gap.weekLow = 0;
               gap.weekHigh = 0;
               gap.lastSignalBarTime = 0;
               ArrayResize(gap.signals, 0);
               AddGap(gap);
               int idx = ArraySize(g_gaps) - 1;
               if(ShowHistoricalGaps)
                 {
                  string prefix = PrefixForIndex(idx);
                  CreateGapObjects(idx, prefix);
                  UpdateGapVisuals(idx, prefix);
                 }
              }
           }
        }

      //--- check for signals on the latest completed bar
      CheckLiveSignals(time, high, low, close);
      RenderSignalBuffers(rates_total);

      //--- update visual appearance of all gaps
      if(ShowHistoricalGaps)
        {
         for(int g = 0; g < ArraySize(g_gaps); g++)
            UpdateGapVisuals(g, PrefixForIndex(g));
        }
     }

   return rates_total;
  }
On subsequent calls, the function switches to incremental mode. It checks whether a new bar has appeared, scans for any newly formed weekend gaps, processes live signals through CheckLiveSignals(), updates the buffers again, and refreshes the gap visuals. This two-stage design keeps the indicator efficient while ensuring that both history and live data remain in sync.
This is the point where the entire implementation becomes operational. Every function built earlier now feeds into this loop, and the indicator can process the market bar by bar in a structured way.
Buffer Rendering
The last major processing step is RenderSignalBuffers(). We use this function to move the internal signal records into the public indicator buffers that Expert Advisors can read.
The function first clears all buffer slots to EMPTY_VALUE. This ensures that only confirmed signal positions contain values. After that, it loops through every gap and every signal inside each gap. For each signal, the function finds the matching bar index using iBarShift() and writes the signal price and TP/SL values into the proper buffer locations.
//+------------------------------------------------------------------+
//| Render arrow buffers from stored signals                         |
//+------------------------------------------------------------------+
void RenderSignalBuffers(const int rates_total)
  {
//--- reset buffers (called only on new bar, so performance acceptable for most cases)
   for(int i = 0; i < rates_total; i++)
     {
      BufferBuyArrow[i] = EMPTY_VALUE;
      BufferSellArrow[i] = EMPTY_VALUE;
      BufferBuyTP[i]    = EMPTY_VALUE;
      BufferBuySL[i]    = EMPTY_VALUE;
      BufferSellTP[i]   = EMPTY_VALUE;
      BufferSellSL[i]   = EMPTY_VALUE;
     }

//--- fill from gap signals
   for(int g = 0; g < ArraySize(g_gaps); g++)
     {
      for(int s = 0; s < ArraySize(g_gaps[g].signals); s++)
        {
         SignalRecord sig = g_gaps[g].signals[s];
         int sh = iBarShift(_Symbol, _Period, sig.signalTime, false);
         if(sh < 0 || sh >= rates_total)
            continue;

         if(sig.signalIsBuy)
           {
            BufferBuyArrow[sh] = sig.signalPrice;
            BufferBuyTP[sh]    = NormalizeDouble(sig.signalTP, _Digits);
            BufferBuySL[sh]    = NormalizeDouble(sig.signalSL, _Digits);
           }
         else
           {
            BufferSellArrow[sh] = sig.signalPrice;
            BufferSellTP[sh]    = NormalizeDouble(sig.signalTP, _Digits);
            BufferSellSL[sh]    = NormalizeDouble(sig.signalSL, _Digits);
           }
        }
     }
  }
This buffer rendering stage is the bridge between the indicator’s internal data structures and the EA-facing output. The GapInfo and SignalRecord structures are excellent for organizing the logic, but the buffers are what make the indicator directly usable by automated systems.
Final Cleanup and Resource Management
Finally, we implement the resource cleanup. DeleteWGObjects() removes every chart object created by the indicator by checking for the "WG_" prefix. This keeps the chart clean after the indicator is removed.
OnDeinit() then clears the dynamic gap array so no memory is left hanging after deinitialization. Because the indicator creates many visual objects and stores multiple signals per gap, this cleanup step is essential for safe reuse and stable chart behavior.
Outcomes
After successfully implementing the indicator, the next step is validation through testing. This begins by compiling the code in MetaEditor and attaching the indicator to any chart in MetaTrader 5. Testing was performed across multiple symbols and timeframes to verify that the indicator behaved consistently under different market conditions.
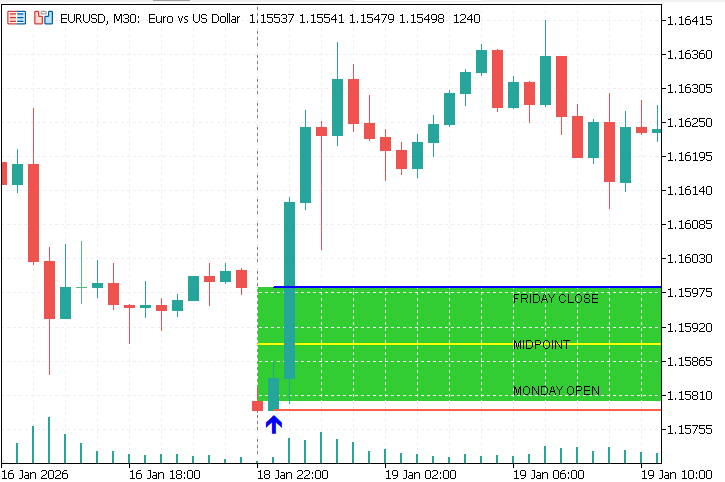
The diagram shows a bullish gap-trading setup. The indicator generates a buy signal and displays an upward arrow after confirmation near the lower gap boundary. The red horizontal line represents the stop-loss level, while the blue horizontal line marks the take-profit target. The green shaded area highlights the weekend gap region, and the yellow line indicates the midpoint of the gap. In this example, price successfully traded through the gap toward the opposite boundary, demonstrating how the indicator can transform a weekend gap into a structured trading opportunity with clearly defined entry, risk, and profit objectives.
Conclusions
This article converted the weekend-gap concept into a deterministic and testable indicator for automated trading. We defined the key rules clearly: the gap is formed by Friday close and Monday open, a minimum gap size is required, confirmation is based on a closed candle, the take-profit is set at the opposite boundary, and the stop-loss is placed beyond the week’s extreme with an optional buffer. The logic is applied consistently in both historical reconstruction and live processing, so signals remain fixed after candle close.
The indicator also exposes six EA-compatible buffers: buy arrow, sell arrow, buy take-profit, buy stop-loss, sell take-profit, and sell stop-loss. This gives the Expert Advisor a clear data contract for filtering and execution. In the next article, we will build the EA that reads these buffers and executes trades using the same non-repainting logic.
Warning: All rights to these materials are reserved by MetaQuotes Ltd. Copying or reprinting of these materials in whole or in part is prohibited.
This article was written by a user of the site and reflects their personal views. MetaQuotes Ltd is not responsible for the accuracy of the information presented, nor for any consequences resulting from the use of the solutions, strategies or recommendations described.

- Free trading apps
- Over 8,000 signals for copying
- Economic news for exploring financial markets
You agree to website policy and terms of use