Articles with examples of indicators developed in MQL5

The articles contain detailed explanation of the attached codes. Download and open them in MetaEditor and program together with the author while reading the article.
Add a new article

You are missing trading opportunities:
- Free trading apps
- Over 8,000 signals for copying
- Economic news for exploring financial markets
Registration
Log in
You agree to website policy and terms of use
If you do not have an account, please register


Creating Custom Indicators in MQL5 (Part 10): Enhancing the Footprint Chart with Per-Bar Volume Sentiment Information Box
The article enhances an MQL5 footprint indicator with a compact box above each candle that summarizes net delta, total volume, and buy/sell percentages. We implement supersampled anti‑aliased rendering, rounded corners via arc and quadrilateral rasterization, and per‑pixel alpha compositing. Supporting utilities include ARGB conversion, scanline fills, and box‑filter downsampling. The box delivers fast sentiment reads that stay legible across zoom levels.


Creating a Traditional Renko Overlay Indicator in MQL5
Create a traditional Renko indicator in MQL5 that converts candlestick closing prices into fixed-size blocks displayed on the main chart. We calculate the movement from the closing price of the last block, create new blocks of a user-defined size, confirm reversals using the two-block rule, manage block closing prices in a dynamic array, and display rectangles for visualizing the trend in real time.


Analyzing Overbought and Oversold Trends Via Chaos Theory Approaches
We determine the overbought and oversold condition of the market according to chaos theory: integrating the principles of chaos theory, fractal geometry and neural networks to forecast financial markets. The study demonstrates the use of the Lyapunov exponent as a measure of market randomness and the dynamic adaptation of trading signals. The methodology includes an algorithm for generating fractal noise, hyperbolic tangent activation, and moment optimization.


Package-based approach with KnitPkg for MQL5 development
For maximum reliability and productivity in MetaTrader products built with MQL, this article advocates a development approach based on reusable “packages” managed by KnitPkg, a project manager for MQL5/MQL4. A package can be used as a building block for other packages or as the foundation for final artifacts that run directly on the MetaTrader platform, such as EAs, indicators, and more.


Walsh Functions in Modern Trading
The article discusses the application of Walsh functions in trading. We will explore the basic principles of using these functions to analyze financial markets, forecast prices, and make trading decisions. We will also discuss the advantages and disadvantages of these functions, as well as the prospects for their application in trading and technical analysis.


Building an Interactive AnchorFlow Volume Profile Indicator (MTF) in MQL5
We implement an interactive, anchored multi-timeframe volume profile in MQL5 for MetaTrader 5. The indicator draws the current-timeframe profile on the main chart and a higher timeframe profile in a subwindow, both aligned by a draggable anchor and the visible range. You will learn keyboard-driven bin editing (E/S double-click), robust timeframe validation, viewport-aware updates, and object restoration to build a reliable, synchronized volume workflow.


Creating Custom Indicators in MQL5 (Part 7): Hybrid Time Price Opportunity (TPO) Market Profiles for Session Analysis
In this article, we develop a custom indicator in MQL5 for hybrid Time Price Opportunity (TPO) market profiles, supporting multiple session timeframes such as intraday, daily, weekly, monthly, and fixed periods with timezone adjustments. The indicator quantizes prices into a grid, tracks session data including highs, lows, opens, and closes, and calculates key elements like the point of control and value area based on TPO counts. It renders profiles visually on the chart with customizable colors for TPO letters, single prints, value areas, POC, and close markers, enabling detailed session analysis

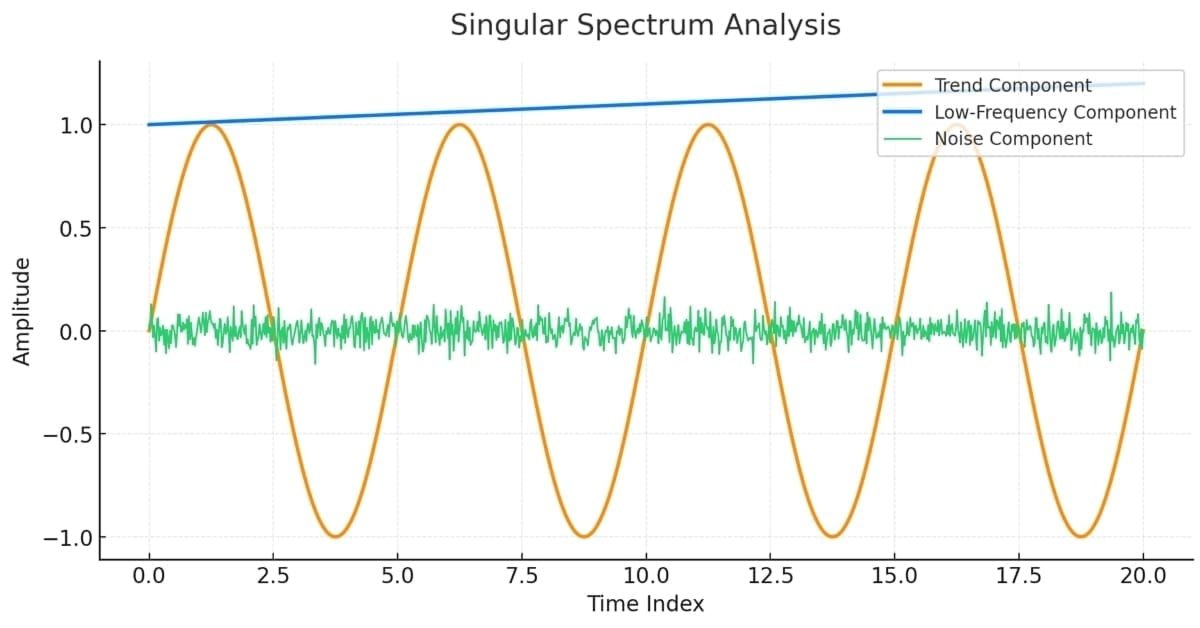
Singular Spectrum Analysis in MQL5
This article is meant as a guide for those unfamiliar with the concept of Singular Spectrum Analysis and who wish to gain enough understanding to be able to apply the built-in tools available in MQL5.


Trend Criteria. Conclusion
In this article, we will consider the specifics of applying some trend criteria in practice. We will also try to develop several new criteria. The focus will be on the efficiency of applying these criteria to market data analysis and trading.


Price Action Analysis Toolkit Development (Part 18): Introducing Quarters Theory (III) — Quarters Board
In this article, we enhance the original Quarters Script by introducing the Quarters Board, a tool that lets you toggle quarter levels directly on the chart without needing to revisit the code. You can easily activate or deactivate specific levels, and the EA also provides trend direction commentary to help you better understand market movements.


Forex Arbitrage Trading: Relationship Assessment Panel
This article presents the development of an arbitrage analysis panel in MQL5. How to get fair exchange rates on Forex in different ways? Create an indicator to obtain deviations of market prices from fair exchange rates, as well as to assess the benefits of arbitrage ways of exchanging one currency for another (as in triangular arbitrage).


Building a Divergence System (Part II): Adaptive SuperTrend Custom Indicator
The article upgrades SuperTrend by integrating a divergence engine (MPO4 or RSI) the dynamically reduces the ATR multiplier during weakening momentum. It covers the shrinking formula, non-repainting state propagation with dedicated buffers, and a step-by-step MQL5 implementation on the price chart. You will learn how to interpret arrows and line flips, adjust inputs, and apply the indicator for disciplined trailing and earlier confirmations.


Price Action Analysis Toolkit Development (Part 72): Building a Gap Fill Indicator in MQL5
An EA-ready weekend gap-fill tool for MetaTrader 5 that detects gaps, confirms complete fills, and posts deterministic buy/sell values to indicator buffers. It reconstructs historical events, monitors live markets without repainting, and visualizes gap structure directly on the chart. Configurable alerts and clear object graphics support both manual review and automated execution.


Building A Candlestick Trend Constraint Model (Part 6): All in one integration
One major challenge is managing multiple chart windows of the same pair running the same program with different features. Let's discuss how to consolidate several integrations into one main program. Additionally, we will share insights on configuring the program to print to a journal and commenting on the successful signal broadcast on the chart interface. Find more information in this article as we progress the article series.


Building Volatility Models in MQL5 (Part II): Implementing GJR-GARCH and TARCH in MQL5
The article implements GJR-GARCH and TARCH in an MQL5 volatility library and explains why asymmetry improves on standard ARCH/GARCH. It covers model formulation, parameterization, and usage through derived classes and scripts. Readers get code examples for calibration and one-step-ahead forecasting on real data to support risk and diagnostics.


Building a Megaphone Pattern Indicator in MQL5
Build a megaphone pattern indicator in MQL5 that detects expanding structures on the chart. The article walks through swing identification and refinement, trend line validation, breakout confirmation, and SL/TP projection, with chart objects for lines, labels, and signals. As a result, you get a rule-based implementation that automates pattern detection and produces actionable levels directly in MetaTrader 5.


The MQL5 Standard Library Explorer (Part 11): How to Build a Matrix-Based Market Structure Indicator in MQL5
Learn to engineer an MQL5 indicator that converts trend, momentum, and volatility into a single raw score using a matrix.mqh (ALGLIB). The article covers a separate‑window oscillator to validate the core mathematics, then a main‑chart indicator that plots non‑repainting buy/sell arrows when the score crosses user‑defined thresholds. An optional long‑term EMA filter, a minimum‑bar cooldown, and built‑in alerts make the tool practical for live trading.


Building a Hull Moving Average Momentum Oscillator in MQL5
This article builds a Hull Moving Average Momentum indicator in MQL5 by combining raw price momentum with Hull MA smoothing. We compute momentum as the close-to-close difference over a user-defined length, form 2×Fast WMA − Slow WMA, then apply a final WMA with a square‑root period. The implementation covers inputs, buffers, warm-up/recalculation, and visualization with a color-coded line and zero-line filling, helping interpret positive/negative momentum without treating zero crossings as signals.


Analyzing the Hourly Movement of Trading Symbols and Their Spreads in MetaTrader 5
The ProSpread seasonality index indicator with a Moving Average is a technical analysis tool that identifies seasonal patterns in price movements, analyzes price behavior during specific trading hours and is able to work with either a single instrument or a spread between two assets. It also visualizes the statistical probability of directional movements.


Analyzing Price Time Gaps in MQL5 (Part I): Building a Basic Indicator
Time gap analysis helps traders identify potential market reversal points. The article discusses what a time gap is, how to interpret it, and how it can be used to detect large volume influxes into the market.


From Novice to Expert: Candlestick Momentum Confirmation for Classic Crossover Strategies
In this article, we refine a moving average crossover strategy with a momentum candle filter and an immediate retracement bar confirmation. When both conditions are met, a pending stop order is placed using a pivot-based stop loss and a 2R take profit. The complete MQL5 Expert Advisor code, finite-state-machine logic, and chart annotations are detailed.


Developing Smart Chart Objects in MQL5 (Part 1): Building a Stateful Trendline Management Framework
This article details a practical framework for converting MetaTrader 5 trendlines from static drawings into managed runtime entities. It covers object discovery, event-driven synchronization of user edits, and confirmation logic based on ATR multipliers and closed candles. A central manager coordinates multiple lines and updates their visual state. Readers can implement consistent, extensible rules for detecting proximity, validating bounces, and confirming breakouts.


Creating an EMA Crossover Forward Simulation Indicator in MQL5
A custom forward simulation engine detects fast/slow EMA crossovers and immediately projects synthetic candles ahead of the signal bar. It generates bodies and wicks using controlled logic, draws them with chart objects, and refreshes on every new signal or anchor change. You get a clear forward-looking view to test timing, visualize scenarios, and manage invalidation on the chart.


Account Audit System in MQL5 (Part 1): Designing the User Interface
This article builds the user interface layer of an Account Audit System in MQL5 using CChartObject classes. We construct an on-chart dashboard that displays key metrics such as start/end balance, net profit, total trades, wins/losses, win rate, withdrawals, and a star-based performance rating. A menu button lets you show or hide the panel and restores one-click trading, delivering a clean, usable foundation for the broader audit pipeline.


Feature Engineering for ML (Part 12): Fractal Features in MQL5
A direct MQL5 port of the fractal detector writes each pattern at its center bar, so a buffer read by an expert advisor holds a value that only existed n bars later. We implement CFractalFeatures.mqh with ProcessBar for bar-by-bar use and Compute for full-series recalculation, covering detection, strength scored against a fixed or volatility-scaled floor, an event-based support/resistance ring, and trend-filtered breakout signals. Output is eighteen buffers published at the confirmation bar, verified against the Python reference to within 1e-13.


Forecasting in Trading Using Grey Models
The article discusses the application of Grey models to forecasting financial time series. We will consider the operating principles of Grey models and the specifics of their application to financial series. We will also discuss the advantages and limitations of using these models in trading.


Feature Engineering for ML (Part 13): Trend-Scanning Features in Python
Trend-scanning supports both forward and backward windows, and the labeling default is unsafe for features: it looks ahead and boosts next-bar agreement well above chance on random walks. We provide a dedicated wrapper, get trend scanning features, that forces computational causal and returns only window, slope, t value, and rsquared. A second analysis quantifies errors introduced by the default log transform on signed series.


Building a Divergence System: Creating the MPO4 Custom Indicator
We introduce MPO4, a pressure-based oscillator that emphasizes the body and direction of candles in the context of current volatility. The article details its mathematics, normalization into a bounded range, and the EMA smoothing, then builds a pivot-driven divergence module designed not to repaint. You get complete MQL5 implementation and practical guidance for interpreting signals, including a comparison with RSI as an alternative source.


Unified Multi-Timeframe Renko: Synthesizing the Market's Temporal Dimensions
The article presents an innovative concept for a multi-timeframe Renko chart that combines signals from four timeframes (M5, M15, H1, H4) into a unified synthetic instrument. The system creates a virtual symbol in MetaTrader 5 by using the EMA of each timeframe to generate a composite signal through three methods: simple average, weighted average, and consensus. The implementation includes ATR-based adaptive brick sizing, real-time operation, and full integration with MetaTrader 5.


Market Microstructure in MQL5 (Part 1): Robust Foundation
This article builds the foundation layer of a twelve-part MQL5 market microstructure toolkit. It implements guarded math helpers (SafeDivide, SafeLog, SafeSqrt, SafeExp, SafeTanh), robust data validation (ValidateSymbolV2, SafeCopyClose), trimmed statistical estimators (robust mean var), a linear regression slope, shared structs, and an FFT. You compile a single include file that hardens indicators and expert advisors against silent numerical failures and standardizes data flow for later parts.


Market Heat Map Indicator Based on Prime-Number Density
An innovative indicator based on prime number theory helps identify strong reversal levels that other traders overlook. Testing on 10 assets showed that reversals in mathematically significant zones occur 1.5 to 1.8 times more frequently. Five practical application scenarios with specific rules for filtering out false breakouts and making precise market entries.


The MQL5 Standard Library Explorer (Part 12): Multi-Timeframe Composite-Score Dashboard
The article implements CMultiTimeframeMatrix, a reusable dashboard that maps symbols vs. timeframes and displays a numeric, colour‑coded score. The score combines trend, momentum, and volatility, updates by timer, and respects performance constraints. You will learn how to build the UI with CAppDialog/CLabel, compute metrics via CMatrixDouble, and embed the component into a thin EA for a consistent, real-time overview.


Analyzing Price Time Gaps in MQL5 (Part II): Creating a Heat Map of Liquidity Distribution Over Time
A detailed guide on how to create a heat map indicator for MetaTrader 5 that visualizes the price distribution over time. The article reveals the mathematical basis of time density analysis, where each price level is colored from red (minimum stay time) to blue (maximum stay time).


Engineering Trading Discipline into Code (Part 4): Enforcing Trading Hours and News Disabling in MQL5
An MQL5 control system that blocks orders outside scheduled trading hours and during scheduled news releases, converting time rules into executable restrictions. It combines a permissions management mechanism, a transaction-level expert advisor, and a visual dashboard for real-time status and upcoming restrictions. Configuration is accomplished using editable files, with caching and a CSV audit log for traceability.


Engineering Trading Discipline into Code (Part 6): Building a Unified Discipline Framework in MQL5
The article introduces a unified MQL5 discipline framework that consolidates the symbol whitelist, trading‑hours and news filters, and daily trade‑limit modules under CDisciplineEngine.mqh. It explains centralized trade validation and state synchronization shared by a chart dashboard and an enforcement Expert Advisor. Readers learn how to authorize orders through a single gate, monitor permissions in real time, and automatically enforce rules across the terminal.


GoertzelBrain: Adaptive Spectral Cycle Detection with Neural Network Ensemble in MQL5
GoertzelBrain combines Goertzel spectral analysis with an online‑trained neural network ensemble to convert cycle features into a directional confirmation signal. The indicator builds a compact feature vector from the dominant period, amplitude, confidence and their dynamics, plus local volatility, and outputs +1, −1 or 0. The article provides the full MQL5 implementation, explains the architecture and feature engineering, and shows how to use it as a directional filter.


Building a Modular Fair Value Gap (FVG) Detection Engine in MQL5
This article introduces a modular Fair Value Gap (FVG) detection engine for MQL5 packaged as a reusable include class, it evaluates imbalance zones on closed bars, applies a Simple True Range average filter to eliminate low-volatility noise, and supports wick-touch and close-through mitigation. A companion diagnostic indicator plots active gaps, and an Expert Advisor template demonstrates automated pullback entries with new-bar execution controls.


Eigenvectors and eigenvalues: Exploratory data analysis in MetaTrader 5
In this article we explore different ways in which the eigenvectors and eigenvalues can be applied in exploratory data analysis to reveal unique relationships in data.


The Mathematics of Volatility: Why the GRI Indicator Deserves to Return to Your Trading Terminal
The article focuses on the Gopalakrishnan Range Index (GRI/ROCI), which quantitatively assesses the market's "degree of chaos" using the logarithm of the closing price range over a given period. The article shows how to implement GRI in MetaTrader 5, resolve the issue of negative values using a shifted logarithm, and convert the scale to convenient "points" by normalizing it by Point. Next, we examine practical scenarios for using GRI as a filter for volatility and market phases.


Price Action Analysis Toolkit Development (Part 71): Weekend Gap Structure Mapping in MQL5
The article delivers an object-based MQL5 implementation that detects weekend gaps from time discontinuities and renders them directly on the chart. It manages graphical objects, tracks state transitions (fresh, partial, reaction, filled), and preserves completed gaps as historical zones. The result is a reproducible framework for monitoring how price revisits and fills weekend gap structures.