
Developing a trading Expert Advisor from scratch (Part 14): Adding Volume At Price (II)

Introduction
Our EA already has some resources which assist in trading — we have added them in our previous articles. However, this EA has some issues with visualization and resizing. They do not interfere with trading, but at some points this leads to a mess on the screen until you force it to refresh. In addition, there are still some things missing that would provide valuable information for us. These are specific things, but the information can be necessary.
So, let's start implementing these new improvements. This interesting article can provide some new ideas and methods of presenting information. At the same time, it can assist in fixing minor flaws in projects.
Planning and implementing a new function in Volume At Price
1. Planning
There is a curious thing about trading. We often see that the market accumulates in certain price regions, and when stops trigger either on the buy or on sell side, there is a rapid movement of the price. This movement can be seen via Times & Trade. We considered this in previous articles, Times & Trade (I) and Times & Trade (II). In these articles, we looked at how to create an alternative graphical system for reading and analyzing an order flow of executed orders. If you look closer, you will notice that at some moments the price tends to get back to the accumulation region, where it does not want to leave at that moment. But when we watch the Volume at Price indicator, it is difficult to determine how recent was the price unchanged in this specific region. This indicator was implemented in the article "Adding Volume At Price (I)". Using it, we can analyze relatively recent movements by simply changing the analysis starting point, which in turn is done by adjusting the value of the object indicated in the figure below:
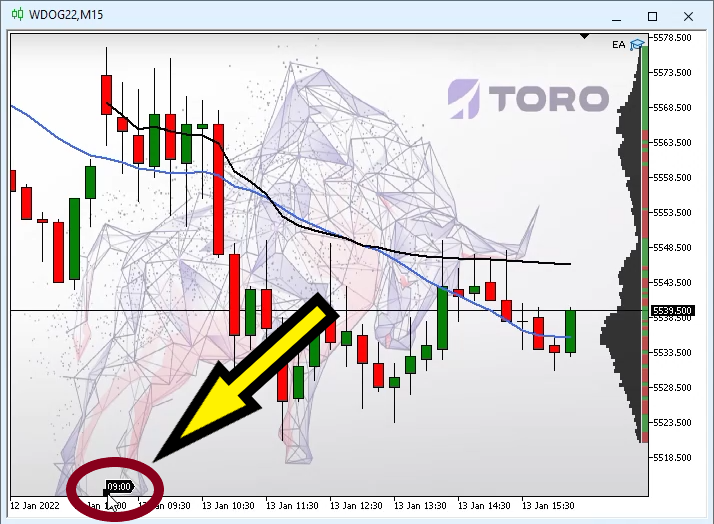
But this is actually impractical, since we are tied to the main timeframe, i.e., if you have a 60-minute timeframe chart, you will not be able to analyze price movements below this timeframe. You have to switch to a lower timeframe to be able to adjust the analysis point. But when trading futures contracts, most traders actually use lower timeframes, such as 5, 10 or 30 minutes so there is no problem with the adjustment of the analysis beginning point. But as I explained earlier, sometimes the price exits the accumulation because stops have triggered, and such a return usually occurs in less than 5 minutes. In such cases a candlestick with a long upper or lower shadow appears on the chart. In such cases Price Action tells us that what happened was a market sounding, this type of movement can be seen below on the candlesticks indicated by arrows:
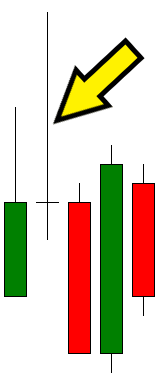
Typical buyer's testing move, or short stop triggering
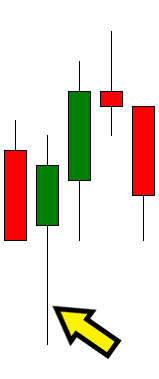
Typical seller's testing move, or buyer-side stop triggering
This kind of movement occurs frequently, and analyzing the volume generated in each of the price ranges is very important as it allows to understand whether the market is testing or the trend is really reversing. But it is impossible to do this properly, or rather quickly, using the volumes indicator proposed earlier.
However, we can make a small change to the indicator object class to have a clearer idea of what's going on. This will appear as a trace of a trade that took place in the given period of time.
2. Implementation
The first thing to do is to analyze how much tracking time you want to set, whether it will be 60, 45, 30, 19, 7 or 1 minute. Regardless of this, we recommend using values that are multiples enough so that the tracking system can be really useful. For practical reasons we will be implementing it using 30 minutes of tracking, so we will define it in the following line of code:
#define def_MaxTrailMinutes 30
But why exactly 30 minutes? Actually, the tracking system will be performed every minute, but the maximum tracking time will be 30 minutes. I.e., you will always having 30-minute tracking, for example, when tracking switches to 31st minute, the first trading minute will no longer be displayed. How is it implemented? This uses the capture system shown below:
inline void SetMatrix(MqlTick &tick)
{
        int pos;

        if ((tick.last == 0) || ((tick.flags & (TICK_FLAG_BUY | TICK_FLAG_SELL)) == (TICK_FLAG_BUY | TICK_FLAG_SELL))) return;
        pos = (int) ((tick.last - m_Infos.FirstPrice) / Terminal.GetPointPerTick()) * 2;
        pos = (pos >= 0 ? pos : (pos * -1) - 1);
        if ((tick.flags & TICK_FLAG_BUY) == TICK_FLAG_BUY) m_InfoAllVaP[pos].nVolBuy += tick.volume; else
        if ((tick.flags & TICK_FLAG_SELL) == TICK_FLAG_SELL) m_InfoAllVaP[pos].nVolSell += tick.volume;
        m_InfoAllVaP[pos].nVolDif = (long)(m_InfoAllVaP[pos].nVolBuy - m_InfoAllVaP[pos].nVolSell);
        m_InfoAllVaP[pos].nVolTotal = m_InfoAllVaP[pos].nVolBuy + m_InfoAllVaP[pos].nVolSell;
        m_Infos.MaxVolume = (m_Infos.MaxVolume > m_InfoAllVaP[pos].nVolTotal ? m_Infos.MaxVolume : m_InfoAllVaP[pos].nVolTotal);
        m_Infos.CountInfos = (m_Infos.CountInfos == 0 ? 1 : (m_Infos.CountInfos > pos ? m_Infos.CountInfos : pos));
        m_Infos.Momentum = macroGetMin(tick.time);
        m_Infos.Momentum = (m_Infos.Momentum > (def_MaxTrailMinutes - 1) ? m_Infos.Momentum - def_MaxTrailMinutes : m_Infos.Momentum);
        if (m_Infos.memMomentum != m_Infos.Momentum)
        {
                for (int c0 = 0; c0 <= m_Infos.CountInfos; c0++) m_TrailG30[m_Infos.Momentum].nVolume[c0] = 0;
                m_Infos.memMomentum = m_Infos.Momentum;
        }
        m_TrailG30[m_Infos.Momentum].nVolume[pos] += tick.volume;
}
The highlighted lines are those that have been added to the source code of the object class - they implement volume trace capturing. The lines below guarantee that the tracking will be performed as expected.
m_Infos.Momentum = macroGetMin(tick.time);
m_Infos.Momentum = (m_Infos.Momentum > (def_MaxTrailMinutes - 1) ? m_Infos.Momentum - def_MaxTrailMinutes : m_Infos.Momentum);
The trace capture system us ready. Now we need to make a new decision. Remember that the trace is captured every 1 minute. This can be presented so that we could see volume at each price range within 1 minute. As long as we're charting this way, you might consider doing something like shown below:

Lighter shades represent fresher volumes, which might be a good idea...
Although it seems to be a good idea, when the volume is low, or the movement is very fast, even with an expressive volume for the moment, it may in fact not be visible, since it will be plotted adjusting to the maximum volume that has been found so far. Therefore, you might want to plot a little differently to solve this, so it would look like this:

Each color represents a specific period in the volume trace.
This can assist in analyzing very narrow bands in volume, and corrects occasional problems seen in the first case. But still we would have the adjustment problem that occurs when the volume may not be as expressive compared to the overall volume at another point. In addition, the colors for each period must be chosen carefully so that the analysis does not get confused during very active trades.
Therefore, here we will use a simpler model, which again can be adjusted to analyze the movements of different periods. However, keep in mind the above mentioned problems. This will be up to you. Then the trace will be displayed as follows:

We see here a pure trace. When it happens, we should analyze both Times & Trade and Price Action to understand what is happening.
Anyway, the only function that needs to be modified to change the volume display is the function below:
void Redraw(void)
{
        uint            x, y, y1, p;
        double  reason = (double) (m_Infos.MaxVolume > m_WidthMax ? (m_WidthMax / (m_Infos.MaxVolume * 1.0)) : 1.0);
        double  desl = Terminal.GetPointPerTick() / 2.0;
        ulong           uValue;

        Erase();
        p = m_WidthMax - 8;
        for (int c0 = 0; c0 <= m_Infos.CountInfos; c0++)
        {
                if (m_InfoAllVaP[c0].nVolTotal == 0) continue;
                ChartTimePriceToXY(Terminal.Get_ID(), 0, 0, m_Infos.FirstPrice + (Terminal.GetPointPerTick() * (((c0 & 1) == 1 ? -(c0 + 1) : c0) / 2)) + desl, x, y);
                y1 = y + Terminal.GetHeightBar();
                FillRectangle(p + 2, y, p + 8, y1, macroColorRGBA(m_InfoAllVaP[c0].nVolDif > 0 ? m_Infos.ColorBuy : m_Infos.ColorSell, m_Infos.Transparency));
                FillRectangle((int)(p - (m_InfoAllVaP[c0].nVolTotal * reason)), y, p, y1, macroColorRGBA(m_Infos.ColorBars, m_Infos.Transparency));
                uValue = 0;
                for (int c1 = 0; c1 < def_MaxTrailMinutes; c1++) uValue += m_TrailG30[c1].nVolume[c0];
                FillRectangle((int) (p - (uValue * reason)), y, p, y1, macroColorRGBA(clrRoyalBlue, m_Infos.Transparency));
        }
        C_Canvas::Update();
};
To be more exact, only the highlighted code needs to be modified. You can play with it until you get the desired result. Nothing else in the class needs to be modified except for the highlighted part. After you compile the program and run it on the chart, you will see something like this:
Solving the rendering problem
Although the code didn't have any specific problems, there is a minor flaw when resizing a chart: when a maximized chart is resized to any other size and then back to maximized, some objects are a kind of lost, do not behave as expected, and become positioned in wrong places. There are not many things to fix. The problem is in the below code - we used it in previous articles.
void OnChartEvent(const int id, const long &lparam, const double &dparam, const string &sparam)
{
        Chart.DispatchMessage(id, lparam, dparam, sparam);
        VolumeAtPrice.DispatchMessage(id, sparam);
        switch (id)
        {
                case CHARTEVENT_CHART_CHANGE:
                        Terminal.Resize();
                        WallPaper.Resize();
                        TimesAndTrade.Resize();
        break;
        }
        ChartRedraw();
}
There is a very simple modification, but you may think "I don't see anything - the code is correct". At first glance I don't see anything wrong either, and the code remained with a runtime error. But when I was adding some extra features, I noticed the problem, which is exactly the one I described above. To solve this problem the code needs to be changed as follows:
void OnChartEvent(const int id, const long &lparam, const double &dparam, const string &sparam)
{
        switch (id)
        {
                case CHARTEVENT_CHART_CHANGE:
                        Terminal.Resize();
                        WallPaper.Resize();
                        TimesAndTrade.Resize();
        break;
        }
        Chart.DispatchMessage(id, lparam, dparam, sparam);
        VolumeAtPrice.DispatchMessage(id, sparam);
        ChartRedraw();
}
It may sound silly, but to understand why, just see the entire function code and the highlighted part. Now that the system is fixed, we can move on to the next step.
Adding extra resources
The function we are going to add now is very simple and many may not see much reason to implement it, but implementing it will help a lot when working with orders, including positioning, moving, or just watching the Volume at Price indicator.
The first thing to do is to change the class that the price line adjustment code will be part of. This code comes out of the C_OrderView class and goes into the C_Terminal class, but for this it also undergoes small changes, since it starts working with the variables of the class itself. Below is what the new code will look like.
double AdjustPrice(const double arg)
{
        double v0, v1;

        if(m_Infos.TypeSymbol == OTHER) return arg;
        v0 = (m_Infos.TypeSymbol == WDO ? round(arg * 10.0) : round(arg));
        v1 = fmod(round(v0), 5.0);
        v0 -= ((v1 != 0) || (v1 != 5) ? v1 : 0);
        return (m_Infos.TypeSymbol == WDO ? v0 / 10.0 : v0);
};
By doing so we can create a new EA class - it will be the C_Mouse class. This class object will be in charge of and the basis of mouse events, so let's see how it goes at this stage of development. But first, let's look at the current class structure of our Expert Advisor, which is shown in the figure below:
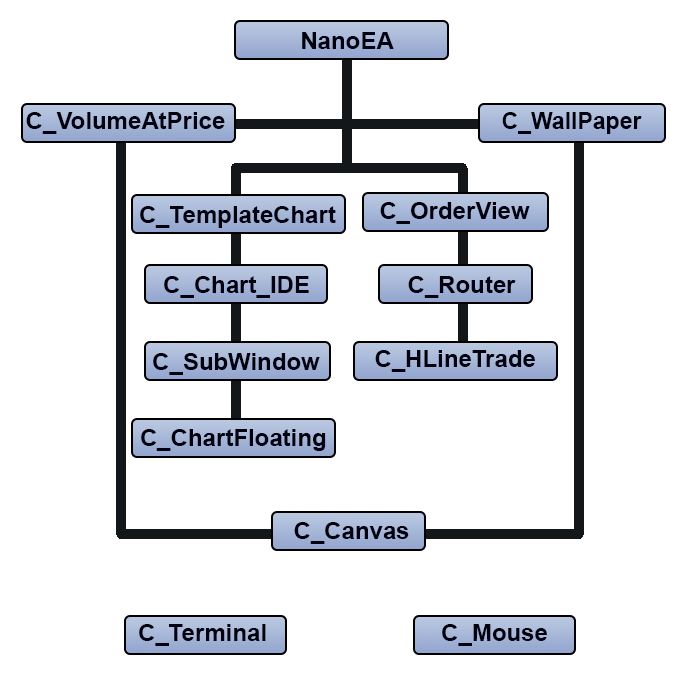
To implement the next system, it is necessary to introduce a new structure...
So, given the above structure, let's break down the code of the C_Mouse object class, starting with the declaration of variables, which can be seen below:
class C_Mouse
{
        private  :
                struct st00
                {
                color   cor01,
                        cor02,
                        cor03;
                string  szNameObjH,
                        szNameObjV,
                        szNameObjT,
                        szNameObjI,
                        szNameObjB;
                }m_Infos;
                struct st01
                {
                        int      X,
                                 Y;
                        datetime dt;
                        double   price;
                        uint     ButtonsStatus;
                }Position;
Seeing that there are few needed at this stage of development, let's move on to the next point that deserves our attention:
~C_Mouse()
{
// ... Internal code ...
        ChartSetInteger(Terminal.Get_ID(), CHART_EVENT_MOUSE_MOVE, false);
        ChartSetInteger(Terminal.Get_ID(), CHART_CROSSHAIR_TOOL, true);
}
This code restores crosshairs CHART_CROSSHAIR_TOOL and disables the use of mouse events by the chart, which means that MT5 no longer needs to care about sending such events to the chart because they will be handled by the platform itself.
We also have two very common functions which are used when we are going to control the mouse:
inline void Show(void)
{
        ObjectSetInteger(Terminal.Get_ID(), m_Infos.szNameObjH, OBJPROP_COLOR, m_Infos.cor01);
}
//+------------------------------------------------------------------+
inline void Hide(void)
{
        ObjectSetInteger(Terminal.Get_ID(), m_Infos.szNameObjH, OBJPROP_COLOR, clrNONE);
        ObjectSetInteger(Terminal.Get_ID(), m_Infos.szNameObjV, OBJPROP_COLOR, clrNONE);
        ObjectSetInteger(Terminal.Get_ID(), m_Infos.szNameObjT, OBJPROP_COLOR, clrNONE);
        ObjectSetInteger(Terminal.Get_ID(), m_Infos.szNameObjI, OBJPROP_COLOR, clrNONE);
        ObjectMove(Terminal.Get_ID(), m_Infos.szNameObjB, 0, 0, 0);
}
The interesting thing is that the mouse doesn't actually disappear, only the objects that we create disappear from the screen, and when we "turn on" the mouse, only the price line will actually be visible. This may seem curious, but it has its uses in some specific points of the EA. One of such points is the C_OrderView class object in the part highlighted in the code below:
inline void MoveTo(uint Key)
{
        static double local = 0;
        int w = 0;
        datetime dt;
        bool bEClick, bKeyBuy, bKeySell;
        double take = 0, stop = 0, price;

        bEClick  = (Key & 0x01) == 0x01;    //Left click
        bKeyBuy  = (Key & 0x04) == 0x04;    //SHIFT pressed
        bKeySell = (Key & 0x08) == 0x08;    //CTRL pressed
        Mouse.GetPositionDP(dt, price);
        if (bKeyBuy != bKeySell) Mouse.Hide(); else Mouse.Show();
        ObjectMove(Terminal.Get_ID(), m_Infos.szHLinePrice, 0, 0, price = (bKeyBuy != bKeySell ? price : 0));
        ObjectMove(Terminal.Get_ID(), m_Infos.szHLineTake, 0, 0, take = price + (m_Infos.TakeProfit * (bKeyBuy ? 1 : -1)));
        ObjectMove(Terminal.Get_ID(), m_Infos.szHLineStop, 0, 0, stop = price + (m_Infos.StopLoss * (bKeyBuy ? -1 : 1)));
        if((bEClick) && (bKeyBuy != bKeySell) && (local == 0)) CreateOrderPendent(bKeyBuy, m_Infos.Volume, local = price, take, stop, m_Infos.IsDayTrade); else local = 0;
        ObjectSetInteger(Terminal.Get_ID(), m_Infos.szHLinePrice, OBJPROP_COLOR, (bKeyBuy != bKeySell ? m_Infos.cPrice : clrNONE));
        ObjectSetInteger(Terminal.Get_ID(), m_Infos.szHLineTake, OBJPROP_COLOR, (take > 0 ? m_Infos.cTake : clrNONE));
        ObjectSetInteger(Terminal.Get_ID(), m_Infos.szHLineStop, OBJPROP_COLOR, (stop > 0 ? m_Infos.cStop : clrNONE));
};
Pay attention to the line above the highlighted part:
Mouse.GetPositionDP(dt, price);
This line will capture the mouse position value. Below is the code that will report these values:
inline void GetPositionDP(datetime &dt, double &price)
{
        dt = Position.dt;
        price = Position.price;
}
But that's not all. In some cases, we need the Cartesian coordinates of the chart in terms of screen position. There is another function that allows obtaining the relevant values. It is shown below:
inline void GetPositionXY(int &X, int &Y)
{
        X = Position.X;
        Y = Position.Y;
}
Returning to the C_OrderView class, we have an interesting point that also deserves attention:
void DispatchMessage(int id, long lparam, double dparam, string sparam)
{
        ulong           ticket;
        double          price, pp, pt, ps;
        eHLineTrade     hl;

        switch (id)
        {
                case CHARTEVENT_MOUSE_MOVE:
                        MoveTo(Mouse.GetButtonStatus());
                        break;

// ... The rest of the code ...

}
The MoveTo function can be seen a little earlier in this function. It is also part of the C_OrderView class. But more important is the Mouse.GetButtonsStatus function. This function returns the state of buttons and keys associated with mouse events.
This function Mouse.GetButtonStatus is shown below:
inline uint GetButtonStatus(void) const
{
        return Position.ButtonsStatus;
}
This is one line that returns a variable containing the values recorded since the last mouse event. We will now get to the code that records this value. But first, let's look at the mouse initialization code, because it should tell the EA that we want to initialize the mouse and that from now on the EA will handle various mouse-related things. The code responsible for this is shown below:
// ... Other things ....

input group "Mouse"
input color     user50 = clrBlack;      //Price line
input color     user51 = clrDarkGreen;  //Positive move
input color     user52 = clrMaroon;     //Negative move
//+------------------------------------------------------------------+

// ... General information ...

//+------------------------------------------------------------------+
int OnInit()
{
        static string   memSzUser01 = "";

        Terminal.Init();
        WallPaper.Init(user10, user12, user11);
        Mouse.Init(user50, user51, user52);

// ... The rest of the code ...
So, we need to define three colors which the system will use. These colors should be chosen so that the data is clear and visible on the chart. Take a look at the code of Mouse.Init to understand a little more. It can be seen below.
void Init(color c1, color c2, color c3)
{
        m_Infos.cor01 = c1;
        m_Infos.cor02 = c2;
        m_Infos.cor03 = c3;
        if (m_Infos.szNameObjH != NULL) return;
        ChartSetInteger(Terminal.Get_ID(), CHART_EVENT_MOUSE_MOVE, true);
        ChartSetInteger(Terminal.Get_ID(), CHART_CROSSHAIR_TOOL, false);
        m_Infos.szNameObjH = "H" + (string)MathRand();
        m_Infos.szNameObjV = "V" + (string)MathRand();
        m_Infos.szNameObjT = "T" + (string)MathRand();
        m_Infos.szNameObjB = "B" + (string)MathRand();
        m_Infos.szNameObjI = "I" + (string)MathRand();
//---
        ObjectCreate(Terminal.Get_ID(), m_Infos.szNameObjH, OBJ_HLINE, 0, 0, 0);
        ObjectCreate(Terminal.Get_ID(), m_Infos.szNameObjV, OBJ_VLINE, 0, 0, 0);
        ObjectCreate(Terminal.Get_ID(), m_Infos.szNameObjT, OBJ_TREND, 0, 0, 0);
        ObjectCreate(Terminal.Get_ID(), m_Infos.szNameObjB, OBJ_BITMAP, 0, 0, 0);
        ObjectCreate(Terminal.Get_ID(), m_Infos.szNameObjI, OBJ_TEXT, 0, 0, 0);
//---
        ObjectSetString(Terminal.Get_ID(), m_Infos.szNameObjH, OBJPROP_TOOLTIP, "\n");
        ObjectSetString(Terminal.Get_ID(), m_Infos.szNameObjV, OBJPROP_TOOLTIP, "\n");
        ObjectSetString(Terminal.Get_ID(), m_Infos.szNameObjT, OBJPROP_TOOLTIP, "\n");
        ObjectSetString(Terminal.Get_ID(), m_Infos.szNameObjB, OBJPROP_TOOLTIP, "\n");
        ObjectSetString(Terminal.Get_ID(), m_Infos.szNameObjI, OBJPROP_TOOLTIP, "\n");
//---
        ObjectSetInteger(Terminal.Get_ID(), m_Infos.szNameObjT, OBJPROP_WIDTH, 2);
//---
        ObjectSetString(Terminal.Get_ID(), m_Infos.szNameObjB, OBJPROP_BMPFILE, "::" + def_Fillet);
//---
        ObjectSetString(Terminal.Get_ID(), m_Infos.szNameObjI, OBJPROP_FONT, "Lucida Console");
        ObjectSetInteger(Terminal.Get_ID(), m_Infos.szNameObjI, OBJPROP_FONTSIZE, 10);
        ObjectSetInteger(Terminal.Get_ID(), m_Infos.szNameObjI, OBJPROP_BACK, false);
        Hide();
        Show();
}
There is nothing special about this code - we are just creating some objects to be used by the class. But the highlighted part may be somewhat confusing, because if you look for it in the class, you won't find any place where it is declared. This is because it is actually declared in the code of the EA file along with the declarations of other resources. Later I will group all this in a file, but for now it will stay this way. So, if you look at the EA code, you will find the following lines:
#define def_Resource    "Resources\\SubSupport.ex5"
#define def_Fillet      "Resources\\Fillet.bmp"
//+------------------------------------------------------------------+
#resource def_Resource
#resource def_Fillet
The line shows the resource that was highlighted in the mouse initialization code.
Well, we have reached our peak within this class, which is called by the following fragment:
void OnChartEvent(const int id, const long &lparam, const double &dparam, const string &sparam)
{
        Mouse.DispatchMessage(id, lparam, dparam, sparam);
        switch (id)
        {
                case CHARTEVENT_CHART_CHANGE:
                        Terminal.Resize();
                        WallPaper.Resize();
                        TimesAndTrade.Resize();
        break;
        }
        Chart.DispatchMessage(id, lparam, dparam, sparam);
        VolumeAtPrice.DispatchMessage(id, sparam);
        ChartRedraw();
}
Then the highlighted line in the EA code will call the following code:
void DispatchMessage(const int id, const long &lparam, const double &dparam, const string &sparam)
{
        int     w = 0;
        uint    key;
        static int b1 = 0;
        static double memPrice = 0;

        switch (id)
        {
                case CHARTEVENT_MOUSE_MOVE:
                        Position.X = (int)lparam;
                        Position.Y = (int)dparam;
                        ChartXYToTimePrice(Terminal.Get_ID(), Position.X, Position.Y, w, Position.dt, Position.price);
                        ObjectMove(Terminal.Get_ID(), m_Infos.szNameObjH, 0, 0, Position.price = Terminal.AdjustPrice(Position.price));
                        ObjectMove(Terminal.Get_ID(), m_Infos.szNameObjV, 0, Position.dt, 0);
                        key = (uint) sparam;
                        if ((key & 0x10) == 0x10)
                        {
                                ObjectSetInteger(Terminal.Get_ID(), m_Infos.szNameObjV, OBJPROP_COLOR, m_Infos.cor01);
                                b1 = 1;
                        }
                        if (((key & 0x01) == 0x01) && (b1 == 1))
                        {
                                ChartSetInteger(Terminal.Get_ID(), CHART_MOUSE_SCROLL, false);
                                ObjectSetInteger(Terminal.Get_ID(), m_Infos.szNameObjT, OBJPROP_COLOR, m_Infos.cor01);
                                ObjectMove(Terminal.Get_ID(), m_Infos.szNameObjT, 0, Position.dt, memPrice = Position.price);
                                b1 = 2;
                        }
                        if (((key & 0x01) == 0x01) && (b1 == 2))
                        {
                                ObjectMove(Terminal.Get_ID(), m_Infos.szNameObjT, 1, Position.dt, Position.price);
                                ObjectSetInteger(Terminal.Get_ID(), m_Infos.szNameObjT, OBJPROP_COLOR, (memPrice > Position.price ? m_Infos.cor03 : m_Infos.cor02));
                                ObjectSetInteger(Terminal.Get_ID(), m_Infos.szNameObjI, OBJPROP_COLOR, (memPrice > Position.price ? m_Infos.cor03 : m_Infos.cor02));
                                ObjectMove(Terminal.Get_ID(), m_Infos.szNameObjB, 0, Position.dt, Position.price);
                                ObjectSetInteger(Terminal.Get_ID(), m_Infos.szNameObjB, OBJPROP_ANCHOR, (memPrice > Position.price ? ANCHOR_RIGHT_UPPER : ANCHOR_RIGHT_LOWER));
                                ObjectSetString(Terminal.Get_ID(), m_Infos.szNameObjI, OBJPROP_TEXT, StringFormat("%.2f ", Position.price - memPrice));
                                ObjectMove(Terminal.Get_ID(), m_Infos.szNameObjI, 0, Position.dt, Position.price);
                                ObjectSetInteger(Terminal.Get_ID(), m_Infos.szNameObjI, OBJPROP_ANCHOR, (memPrice > Position.price ? ANCHOR_RIGHT_UPPER : ANCHOR_RIGHT_LOWER));
                        }
                        if (((key & 0x01) != 0x01) && (b1 == 2))
                        {
                                b1 = 0;
                                ChartSetInteger(Terminal.Get_ID(), CHART_MOUSE_SCROLL, true);
                                Hide();
                                Show();
                        }
                        Position.ButtonsStatus = (b1 == 0 ? key : 0);
                        break;
        }
}
Please note that the above code is not the fill implementation code. It supports and solves only the main tasks for the EA up to this stage of development. To understand this, pay attention to one thing in the mouse initialization code - it has the following line:
ChartSetInteger(Terminal.Get_ID(), CHART_CROSSHAIR_TOOL, false);
This line prevents crosshairs from being displayed when we click the middle mouse button. But why do we prevent crosshairs from being created? To understand this, let's take a look at the following gif:
This is the WDO chart, it moves from 0.5 to 0.5. But when we try to do an analysis, we see that we do not have much precision, while in some cases it is important to have some precision in order to conduct the analysis. But the crosshair tool in MetaTrader 5 is not adequate enough for specific cases. In this case, we should resort to a new system and thus we force MetaTrader 5 to stop creating crosshairs when the EA is running. Instead, we create our own crosshairs to perform the analysis. This enables us to add data and values that are more relevant to us and present them in the way that we think is the most appropriate. This can be seen in the figure below, which shows the result of using the data modeling system with the EA running.
As you can see, the specified values correspond to the exact movement values. Furthermore, we have a visual indication: if the value is positive, the indication turns green, and if negative, then the indication turns red. A trace is created and also start and end points become visible. But, as I already mentioned, the system is not yet complete. You can still make improvements to it if you want and you need it. Until a new version of the C_Mouse class comes out, you can improve this version and have more data that you may need. But to do this, you need to understand how everything works, therefore, let's take a closer look at the C_Mouse class message code.
Understanding the DispathMessage code of the C_Mouse class
The code starts by capturing and adjusting the values of the mouse position variables. It is done in the below code:
Position.X = (int)lparam;
Position.Y = (int)dparam;
ChartXYToTimePrice(Terminal.Get_ID(), Position.X, Position.Y, w, Position.dt, Position.price);
Position values are reported by the MetaTrader 5 platform, but the values actually come from the operating system and are in screen coordinates, i.e. X and Y. But we need to convert them to chart coordinates and for this we use the ChartXYToTimePrice function, available in MQL5, which greatly simplifies our lives.
Once this is done, we move the price and time lines.
ObjectMove(Terminal.Get_ID(), m_Infos.szNameObjH, 0, 0, Position.price = Terminal.AdjustPrice(Position.price));
ObjectMove(Terminal.Get_ID(), m_Infos.szNameObjV, 0, Position.dt, 0);
But the time line is initially invisible to us, so we cannot see it on the chart initially. After that, we capture the state of the mouse
key = (uint) sparam;
So far so good. Now let's do the following: we will check if the middle button is pressed state. If it is, the time line becomes visible on the chart. This is implemented in the following code:
if ((key & 0x10) == 0x10)
{
        ObjectSetInteger(Terminal.Get_ID(), m_Infos.szNameObjV, OBJPROP_COLOR, m_Infos.cor01);
        b1 = 1;
}
For this purpose, we use the static variable to store this event, so from now on no other event will be accepted and handled by the EA/ It will deal with the study we want to do on the chart. But in fact, the study starts only when we press the left mouse button, i.e. I use the same working mode that is already known to all users of the MetaTrader 5 platform for research. This is the most appropriate way, since if the user has to learn a new way of doing research lines, they may give up on the system. The EA then waits for this left click, which is done by the following code
if (((key & 0x01) == 0x01) && (b1 == 1))
{
        ChartSetInteger(Terminal.Get_ID(), CHART_MOUSE_SCROLL, false);
        ObjectSetInteger(Terminal.Get_ID(), m_Infos.szNameObjT, OBJPROP_COLOR, m_Infos.cor01);
        ObjectMove(Terminal.Get_ID(), m_Infos.szNameObjT, 0, Position.dt, memPrice = Position.price);
        b1 = 2;
}
when a click occurs, the chart movement system is locked. Then we present a trendline indicating the analysis points. Then the system switches to the next step, which can be seen from a new value in b1. Now it's actually the part where you can add more information or put what you think is most relevant. Here I'm just demonstrating the system, but feel free to put whatever you want. This should be done as shown below:
if (((key & 0x01) == 0x01) && (b1 == 2))
{
        ObjectMove(Terminal.Get_ID(), m_Infos.szNameObjT, 1, Position.dt, Position.price);
        ObjectSetInteger(Terminal.Get_ID(), m_Infos.szNameObjT, OBJPROP_COLOR, (memPrice > Position.price ? m_Infos.cor03 : m_Infos.cor02));
        ObjectSetInteger(Terminal.Get_ID(), m_Infos.szNameObjI, OBJPROP_COLOR, (memPrice > Position.price ? m_Infos.cor03 : m_Infos.cor02));
        ObjectMove(Terminal.Get_ID(), m_Infos.szNameObjB, 0, Position.dt, Position.price);
        ObjectSetInteger(Terminal.Get_ID(), m_Infos.szNameObjB, OBJPROP_ANCHOR, (memPrice > Position.price ? ANCHOR_RIGHT_UPPER : ANCHOR_RIGHT_LOWER));
        ObjectSetString(Terminal.Get_ID(), m_Infos.szNameObjI, OBJPROP_TEXT, StringFormat("%.2f ", Position.price - memPrice));
        ObjectMove(Terminal.Get_ID(), m_Infos.szNameObjI, 0, Position.dt, Position.price);
        ObjectSetInteger(Terminal.Get_ID(), m_Infos.szNameObjI, OBJPROP_ANCHOR, (memPrice > Position.price ? ANCHOR_RIGHT_UPPER : ANCHOR_RIGHT_LOWER));
}
Pay attention to the highlighted line, because that is where the value that you see on the chart screen is displayed and calculated. You can add more useful information there. The operation of this part causes the data to be calculated and presented while the left button is pressed. So this is the same behavior as the default on in MetaTrader 5, but the values will be adjusted and modeled in accordance with your desires and needs.
Now we need to do one more test, which is shown below.
if (((key & 0x01) != 0x01) && (b1 == 2))
{
        b1 = 0;
        ChartSetInteger(Terminal.Get_ID(), CHART_MOUSE_SCROLL, true);
        Hide();
        Show();
}
After releasing the left mouse button, the chart is freed and can be dragged, and all those elements that were used to create the analysis are hidden, only the price line becomes visible again. And finally, we have the last code part, which is shown below:
Position.ButtonsStatus = (b1 == 0 ? key : 0);
If no study is being called, then the mouse button status is stored and can be used elsewhere in the EA, but if a study has been called, a NULL value is used as status data, so it will not be possible to create orders, or change their position.
In the video below, you can see how this trace actually works, how it adjusts the volume on the screen. The indicator helps a lot, and it will be great if you learn how to use it correctly. Together with the Times & Trade they form a double noise analysis tool, which is one of the most advanced trading methods on the market.
Translated from Portuguese by MetaQuotes Ltd.
Original article: https://www.mql5.com/pt/articles/10419
Warning: All rights to these materials are reserved by MetaQuotes Ltd. Copying or reprinting of these materials in whole or in part is prohibited.
This article was written by a user of the site and reflects their personal views. MetaQuotes Ltd is not responsible for the accuracy of the information presented, nor for any consequences resulting from the use of the solutions, strategies or recommendations described.

 Developing a trading Expert Advisor from scratch (Part 15): Accessing data on the web (I)
 Neural networks made easy (Part 14): Data clustering
- Free trading apps
- Over 8,000 signals for copying
- Economic news for exploring financial markets
You agree to website policy and terms of use