Articles with examples of indicators developed in MQL5
The articles contain detailed explanation of the attached codes. Download and open them in MetaEditor and program together with the author while reading the article.
Add a new article

You are missing trading opportunities:
- Free trading apps
- Over 8,000 signals for copying
- Economic news for exploring financial markets
Registration
Log in
You agree to website policy and terms of use
If you do not have an account, please register


Plotting trend lines based on fractals using MQL4 and MQL5
The article describes the automation of trend lines plotting based on the Fractals indicator using MQL4 and MQL5. The article structure provides a comparative view of the solution for two languages. Trend lines are plotted using two last known fractals.

Graphical Interfaces X: The Standard Chart Control (build 4)
This time we will consider the Standard chart control. It will allow to create arrays of subcharts with the ability to synchronize horizontal scrolling. In addition, we will continue to optimize the library code to reduce the CPU load.
Price velocity measurement methods
There are multiple different approaches to market research and analysis. The main ones are technical and fundamental. In technical analysis, traders collect, process and analyze numerical data and parameters related to the market, including prices, volumes, etc. In fundamental analysis, traders analyze events and news affecting the markets directly or indirectly. The article deals with price velocity measurement methods and studies trading strategies based on that methods.

Bid/Ask spread analysis in MetaTrader 5
An indicator to report your brokers Bid/Ask spread levels. Now we can use MT5s tick data to analyze what the historic true average Bid/Ask spread actually have recently been. You shouldn't need to look at the current spread because that is available if you show both bid and ask price lines.
Thomas DeMark's Sequential (TD SEQUENTIAL) using artificial intelligence
In this article, I will tell you how to successfully trade by merging a very well-known strategy and a neural network. It will be about the Thomas DeMark's Sequential strategy with the use of an artificial intelligence system. Only the first part of the strategy will be applied, using the Setup and Intersection signals.

Universal Trend with the Graphical Interface
In this article a universal trend indicator is created based on a number of standard indicators. An additionally created graphical interface allows selecting the type of indicator and adjusting its parameter. The indicator is displayed in a separate window with rows of colored icons.
3D Modeling in MQL5
A time series is a dynamic system, in which values of a random variable are received continuously or at successive equally spaced points in time. Transition from 2D to 3D market analysis provides a new look at complex processes and research objects. The article describes visualization methods providing 3D representation of two-dimensional data.

The Indicators of the Micro, Middle and Main Trends
The aim of this article is to investigate the possibilities of trade automation and the analysis, on the basis of some ideas from a book by James Hyerczyk "Pattern, Price & Time: Using Gann Theory in Trading Systems" in the form of indicators and Expert Advisor. Without claiming to be exhaustive, here we investigate only the Model - the first part of the Gann theory.
Developing the oscillator-based ZigZag indicator. Example of executing a requirements specification
The article demonstrates the development of the ZigZag indicator in accordance with one of the sample specifications described in the article "How to prepare Requirements Specification when ordering an indicator". The indicator is built by extreme values defined using an oscillator. There is an ability to use one of five oscillators: WPR, CCI, Chaikin, RSI or Stochastic Oscillator.
Indicator for Point and Figure Charting
There are lots of chart types that provide information on the current market situation. Many of them, such as Point and Figure chart, are the legacy of the remote past. The article describes an example of Point and Figure charting using a real time indicator.

Universal RSI indicator for working in two directions simultaneously
When developing trading algorithms, we often encounter a problem: how to determine where a trend/flat begins and ends? In this article, we try to create a universal indicator, in which we try to combine signals for different types of strategies. We will try to simplify the process of obtaining trade signals in an expert as much as possible. An example of combining several indicators in one will be given.

Applying One Indicator to Another
When writing an indicator that uses the short form of the OnCalculate() function call, you might miss the fact that an indicator can be calculated not only by price data, but also by data of some other indicator (no matter whether it is a built-in or custom one). Do you want to improve an indicator for its correct application to the other indicator's data? In this article we'll review all the steps required for such modification.

Moving Mini-Max: a New Indicator for Technical Analysis and Its Implementation in MQL5
In the following article I am describing a process of implementing Moving Mini-Max indicator based on a paper by Z.G.Silagadze 'Moving Mini-max: a new indicator for technical analysis'. The idea of the indicator is based on simulation of quantum tunneling phenomena, proposed by G. Gamov in the theory of alpha decay.

MQL5 Cookbook - Pivot trading signals
The article describes the development and implementation of a class for sending signals based on pivots — reversal levels. This class is used to form a strategy applying the Standard Library. Improving the pivot strategy by adding filters is considered.

Master MQL5 from beginner to pro (Part I): Getting started with programming
This article is an introduction to a series of articles about programming. It is assumed here that the reader has never dealt with programming before. So, this series starts from the very basics. Programming knowledge level: Absolute Beginner.

The Drawing Styles in MQL5
There are 6 drawing styles in MQL4 and 18 drawing styles in MQL5. Therefore, it may be worth writing an article to introduce MQL5's drawing styles. In this article, we will consider the details of drawing styles in MQL5. In addition, we will create an indicator to demonstrate how to use these drawing styles, and refine the plotting.

Parallel Calculations in MetaTrader 5
Time has been a great value throughout the history of mankind, and we strive not to waste it unnecessarily. This article will tell you how to accelerate the work of your Expert Advisor if your computer has a multi-core processor. Moreover, the implementation of the proposed method does not require the knowledge of any other languages besides MQL5.
Graphical Interfaces X: The Multiline Text box control (build 8)
The Multiline Text box control is discussed. Unlike the graphical objects of the OBJ_EDIT type, the presented version will not have restrictions on the number of input characters. It also adds the mode for turning the text box into a simple text editor, where the cursor can be moved using the mouse or keys.

Statistical distributions in the form of histograms without indicator buffers and arrays
The article discusses the possibility of plotting statistical distribution histograms of market conditions with the help of the graphical memory meaning no indicator buffers and arrays are applied. Sample histograms are described in details and the "hidden" functionality of MQL5 graphical objects is shown.

Graphical Interfaces I: Form for Controls (Chapter 2)
In this article we will create the first and main element of the graphical interface - a form for controls. Multiple controls can be attached to this form anywhere and in any combination.

Graphical Interfaces III: Simple and Multi-Functional Buttons (Chapter 1)
Let us consider the button control. We will discuss examples of several classes for creating a simple button, buttons with extended functionality (icon button and split button) and interconnected buttons (button groups and radio button). Added to that, we will introduce some additions to existing classes for controls to broaden their capability.
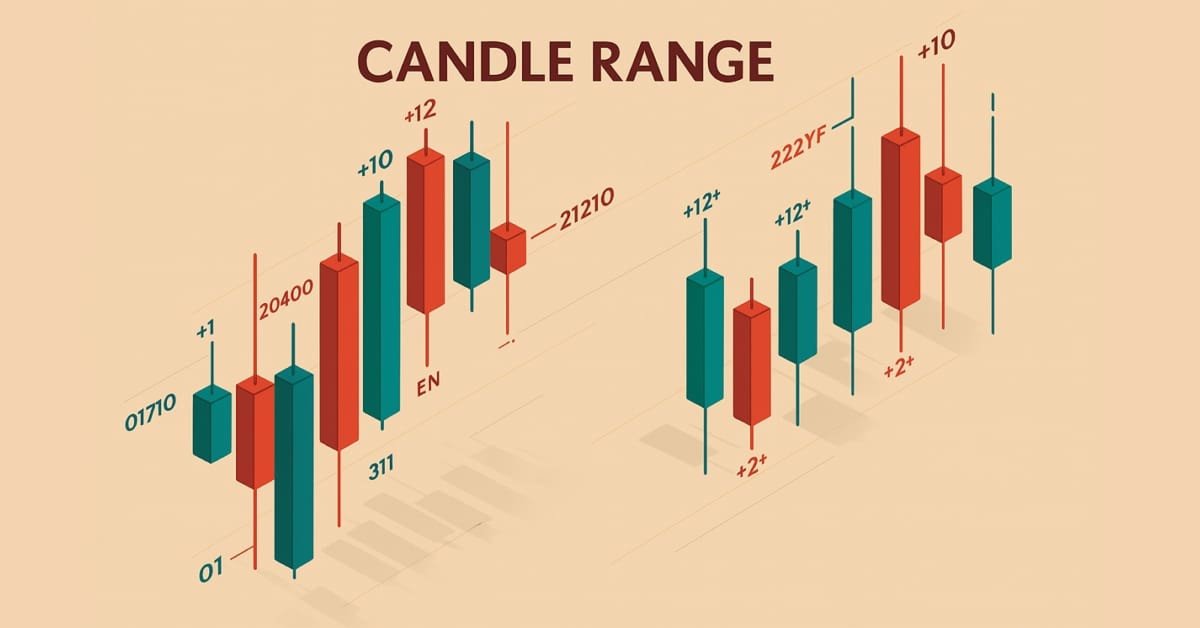
Price Action Analysis Toolkit Development (Part 33): Candle Range Theory Tool
Upgrade your market reading with the Candle-Range Theory suite for MetaTrader 5, a fully MQL5-native solution that converts raw price bars into real-time volatility intelligence. The lightweight CRangePattern library benchmarks each candle’s true range against an adaptive ATR and classifies it the instant it closes; the CRT Indicator then projects those classifications on your chart as crisp, color-coded rectangles and arrows that reveal tightening consolidations, explosive breakouts, and full-range engulfment the moment they occur.

Custom Indicators (Part 1): A Step-by-Step Introductory Guide to Developing Simple Custom Indicators in MQL5
Learn how to create custom indicators using MQL5. This introductory article will guide you through the fundamentals of building simple custom indicators and demonstrate a hands-on approach to coding different custom indicators for any MQL5 programmer new to this interesting topic.

Mini Market Emulator or Manual Strategy Tester
Mini Market Emulator is an indicator designed for partial emulation of work in the terminal. Presumably, it can be used to test "manual" strategies of market analysis and trading.

Manual charting and trading toolkit (Part I). Preparation: structure description and helper class
This is the first article in a series, in which I am going to describe a toolkit which enables manual application of chart graphics by utilizing keyboard shortcuts. It is very convenient: you press one key and a trendline appears, you press another key — this will create a Fibonacci fan with the necessary parameters. It will also be possible to switch timeframes, to rearrange layers or to delete all objects from the chart.

Price Action Analysis Toolkit Development (Part 48): Multi-Timeframe Harmony Index with Weighted Bias Dashboard
This article introduces the “Multi-Timeframe Harmony Index”—an advanced Expert Advisor for MetaTrader 5 that calculates a weighted bias from multiple timeframes, smooths the readings using EMA, and displays the results in a clean chart panel dashboard. It includes customizable alerts and automatic buy/sell signal plotting when strong bias thresholds are crossed. Suitable for traders who use multi-timeframe analysis to align entries with overall market structure.

How to analyze the trades of the Signal selected in the chart
The trade Signals service develops in leaps and bounds. Trusting our funds to a signal provider, we would like to minimize the risk of losing our deposit. So how to puzzle out in this forest of trade signals? How to find the one that would produce profits? This paper proposes to create a tool for visually analyzing the history of trades on trade signals in a symbol chart.

Cluster analysis (Part I): Mastering the slope of indicator lines
Cluster analysis is one of the most important elements of artificial intelligence. In this article, I attempt applying the cluster analysis of the indicator slope to get threshold values for determining whether a market is flat or following a trend.

Building a Viewport SnR Volume Profile Indicator in MQL5
We build a Support and Resistance Volume Profile indicator that adapts to the current viewport in MetaTrader 5. You will learn viewport detection, dynamic SnR identification, zoom‑driven bin sizing, min‑max volume scaling, and fast on‑chart rendering controlled by OnChartEvent. This approach expresses the relative strength of SnR levels with volume, keeping the chart focused on actionable reaction zones.
Graphical Interfaces IV: the Multi-Window Mode and System of Priorities (Chapter 2)
In this chapter, we will extend the library implementation to the possibility of creating multi-window interfaces for the MQL applications. We will also develop a system of priorities for left mouse clicking on graphical objects. This is required to avoid problems when elements do not respond to the user's actions.

Practical Implementation of Digital Filters in MQL5 for Beginners
The idea of digital signal filtering has been widely discussed on forum topics about building trading systems. And it would be imprudent not to create a standard code of digital filters in MQL5. In this article the author describes the transformation of simple SMA indicator's code from his article "Custom Indicators in MQL5 for Newbies" into code of more complicated and universal digital filter. This article is a logical sequel to the previous article. It also tells how to replace text in code and how to correct programming errors.
MQL5 Cookbook: Indicator Subwindow Controls - Buttons
In this article, we will consider an example of developing a user interface with button controls. To convey the idea of interactivity to the user, buttons will change their colors when the cursor hovers over them. With the cursor being over a button, the button color will be slightly darkened, getting significantly darker when the button is clicked. Furthermore, we will add tooltips to each button, thus creating an intuitive interface.

Graphical Interfaces I: Animating the Graphical Interface (Chapter 3)
In the previous article, we started developing a form class for controls. In this article, we are going to continue doing that by filling this class with methods for moving a form over the chart area. We will then integrate this interface component into the core of the library. Also, we will ensure that the color of a form control changes when the mouse cursor is hovering over it.
Indicator for Kagi Charting
The article proposes Kagi chart indicator with various charting options and additional functions. Also, indicator charting principle and its MQL5 implementation features are considered. The most popular cases of its implementation in trading are displayed - Yin/Yang exchange strategy, pushing away from the trend line and consistently increasing "shoulders"/decreasing "waists".
A Universal Channel with the Graphical Interface
All channel indicators are displayed as three lines, including central, top and bottom lines. The drawing principle of the central line is similar to a moving average, while the moving average indicator is mostly used for drawing channels. The top and bottom lines are located at equal distances from the central line. This distance can be determined in points, as percent of price (the Envelopes indicator), using a standard deviation value (Bollinger Bands), or an ATR value (Keltner channel).

The Simple Example of Creating an Indicator Using Fuzzy Logic
The article is devoted to the practical application of the fuzzy logic concept for financial markets analysis. We propose the example of the indicator generating signals based on two fuzzy rules based on Envelopes indicator. The developed indicator uses several indicator buffers: 7 buffers for calculations, 5 buffers for the charts display and 2 color buffers.
Timeseries in DoEasy library (part 40): Library-based indicators - updating data in real time
The article considers the development of a simple multi-period indicator based on the DoEasy library. Let's improve the timeseries classes to receive data from any timeframes to display it on the current chart period.

3 Methods of Indicators Acceleration by the Example of the Linear Regression
The article deals with the methods of indicators computational algorithms optimization. Everyone will find a method that suits his/her needs best. Three methods are described here.One of them is quite simple, the next one requires solid knowledge of Math and the last one requires some wit. Indicators or MetaTrader5 terminal design features are used to realize most of the described methods. The methods are quite universal and can be used not only for acceleration of the linear regression calculation, but also for many other indicators.
Timeseries in DoEasy library (part 41): Sample multi-symbol multi-period indicator
In the article, we will consider a sample multi-symbol multi-period indicator using the timeseries classes of the DoEasy library displaying the chart of a selected currency pair on a selected timeframe as candles in a subwindow. I am going to modify the library classes a bit and create a separate file for storing enumerations for program inputs and selecting a compilation language.

Graphical Interfaces I: Functions for the Form Buttons and Deleting Interface Elements (Chapter 4)
In this article, we are going to continue developing the CWindow class by adding methods, which will allow managing the form by clicking on its controls. We will enable the program to be closed by a form button as well as implement a minimizing and maximizing feature for the form.