
Indicator for Spindles Charting
Introduction
Spindle chart belongs to so-called Volume-by-Price charts. Volume-by-Price is a chart that is plotted using a symbol's activity data in the form of volume (generally tick volume)and one or several prices. Something like market profile comes out. Internet browsing didn't yield much useful information, it was mostly about the chart's composing aspects. Thus we can say that the chart emerged relatively recently and therefore deserves attention.
I received the information about the chart from one of the readers, who asked to create such an indicator. Considering the lack of free time and the implementation complexity, the develpement of the indicator lingered.
Spindle chart looks like japanese candlestick chart, open and close prices as well as minimums and maximums are present in it. However in addition to that the Volume Weighted Moving Average (VWMA) and the Volume Ratio (VR) are used, thereby forming a shape which looks like a spindle (Fig. 1).
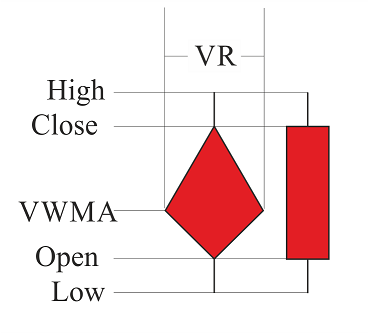
Fig. 1. Comparison of Japanese candlestick and spindle
As we can see from Figure 1, the two added parameters (VWMA — Volume Weighted Moving Average and VR — Volume Ratio) merely supplement the chart, forming a new shape that looks like whirligig that everyone knows since childhood. This is the so-called "spindle".
Consider how VR and VWMA are formed. Volume Weighted Moving Average (VWMA) is none other than a sort of a Moving Average, and is calculated using the formula (1)

where P — price, V — volume. It approximately sounds like this: "Volume Weighted Moving Average equals to the sum of all multiplications of the price by the volume of the said period, divided by the sum of the volumes of the same period".
Volume Ratio (VR) is a kind of a Moving Average, but it is diplayed differently on the chart, firstly because it doesn't have a price range value, and secondly because it is responsible for the activity of the market relative to the previous periods, that is why it is best displayed either on a separate chart as tick volumes or as the width of every spindle. It is calculated by the formula (2):
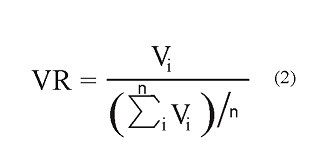
where V — volume. It comes out as "Volume ratio is equal to the current volume divided by the arithmetic mean of the volumes of the selected period."
So, after all these manipulations we get a "spindle" chart (Fig. 2).
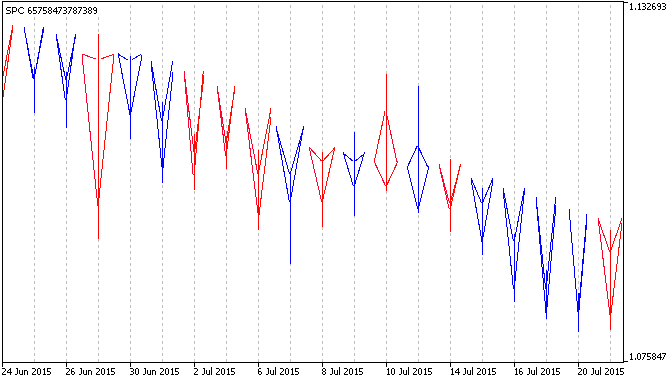
Fig. 2. Spindle chart
It is natural to wonder: "why are the spindles in Figure 2 not filled with color like they are in Figure 1"? This question will be revealed in the next chapter — Fundamentals of plotting.
Fundamentals of plotting
There are seven plotting styles for a custom indicator in MQL5 (line, section, histogram, arrow, filled area, bars and Japanese candlesticks), but none of them fully meets the requirements to plot the spindle chart. This means a custom style is needed. Unfortunately there is no built-in style designer, but there are plenty of other functions which can be used to create your own style that mainly differs from built-in ones in speed, functionality and rendering quality.
It was decided to organize the formation of style with the help of a "Bitmap" object. The disadvantages of such decision are, firstly, high memory usage and relative complexity of plotting, which leads to other drawbacks: speed and stability. The advantage of the "Bitmap" object compared to other objects is a possibility to restrict plotting to a specific space as well as the possibility to use transparency and to use a part of the object. These are the advantages necessary to organize the spindle chart plotting.
Visual representation of a "spindle" is shown in Figure 1, the body of the "Spindle" is completely filled. This plotting is quite complex and demanding to be implemented via the "Bitmap" object. The process is depicted in Figure 3:
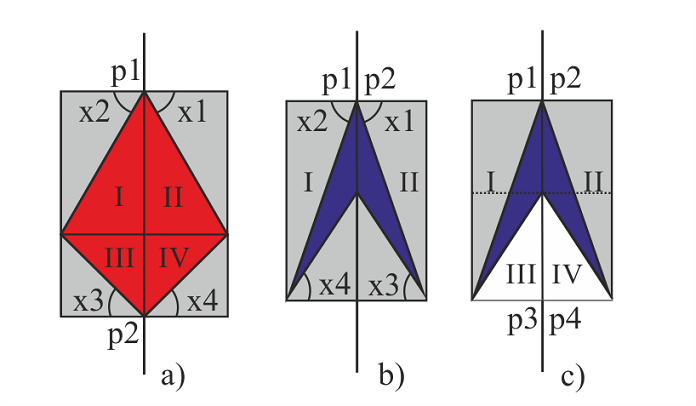
Fig. 3. Technical representation of plotting a "spindle" with the help of the "Bitmap" object
Figure 3 demonstrates three possible variants of the technical representation of the "filled spindle". where:
- p — "Bitmap" object anchor points
- x — angles of pictures used for plotting
- Roman numerals indicate the plotting parts of the "Spindle".
So, to plot the first spindle (Fig. 3, a), call it "chubby rhombus", four "Bitmap" type objects are needed (Fig. 3, a; parts: I, II, III, IV). Depending on the kind of the rhombus, its width and height (i.e., Open, Close, VWMA and VR) pictures need to be chosen at different angles 3, a; angles: x1, x2, x3, x4). Picture is a square bitmap with the format of BMP, in which a beam comes out of one corner at a specific angle relative to one of the nearest sides and splits the square into two areas: filled and transparent.
Calculation of a specific picture is discussed below. However it is already clear that plotting this model at different values of its width and height (i.e. Open, Close, VWMA and VR) will require 360 bitmaps (based on the accuracy of the plotting of one degree) for a single color, and 720 bitmaps for two colors.
It is much more complicated with the second spindle (Fig. 3, b) despite the fact that the plotting of the shape (call it "arrowhead") consists of two parts. There are much more angle combinations here, as it is necessary to consider the distance between Open and Close prices. Further plotting can be disregarded in the presence of an alternative one (рис.3, c).
In the third case (Fig.3, c) plotting is implemented in four parts, the first two (I and II) are the same as in "chubby rhombus", while the latter two (III and IV) cover the redundant parts from the first. Such implenemtation has a possibility of overlapping adjacent spindles, and also a binding to the background is present. In total there are 180 parts like in the "chubby rhombus" and 180 parts for covering.
In general the implementation of a spindle chart will require 900 bitmaps, taking a single chart background into account, which in turn is very resource intensive.
Now consider a less complex and a faster version of the ploting with unfilled "spindles" (Fig. 2). Leaping ahead, the number of bitmaps is 360 (180 of one color and 180 of the other) regardless of the chart's background.
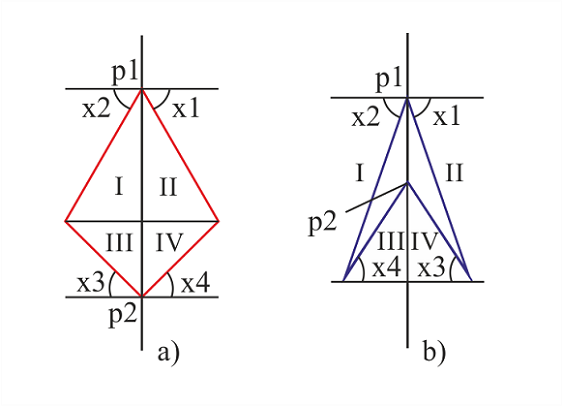
Fig. 4. Technical representation of plotting an "unfilled spindle" with the help of a "Bitmap" object.
Just as in the previous variant, "unfilled spindle" is plotted from four pictures, which represent color lines at different angles (0 to 180). There is no need to plot 360 bitmaps as the angle varies depending on the anchor point of the object. There are only two anchor points (Fig. 4, p1 and p2): two objects for one point, two for the other.
Let me explain again why less bitmaps are used here. Imagine there is a symmetrical rhombus in Figure 4 (a), then part I could be replaced by part IV. To do that it would be necessary to change the anchor point from upper right corner to the lower left corner of the object. As a result it is only needed to prepare a total of 180 objects of the same color and change the anchor point depending on the usage side.
Now a bit of mathematics, geometry to be exact. Consider the process of calculation and selection of a picture to plot an "unfilled spindle" (Fig. 5 and 6).
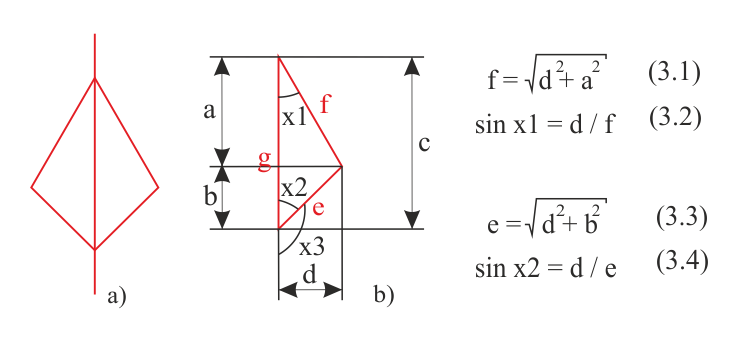
Fig. 5. Mathematical calculation of the "chubby rhombus"
Figure 5 shows the already familiar "chubby rhombus" (a) and its right-hand side (b). All marked distances (a, b, c, d) are easy to calculate when Open, Close, VWMA and VR are known, i.e.:
- a = Close - VWMA,
- b = VWMA - Open,
- c = Close - Open,
- d = VR / 2.
Knowing sides a, b, d,, it is possible to calculate hypotenuses in the right triangles e and f using the formulas 3.1 and 3.3. Accordingly, knowing that in a right triangle a cathetus divided by hypotenuse is equal to the sine of the opposite angle, calculate the sines of the angles x1 and x2 using formulas 3.2 and 3.4. Next, using a table or a calculator find angles x1 and x2, and then calcuate x3 through x2. The same system is used to plot the "arrowhead" shape.
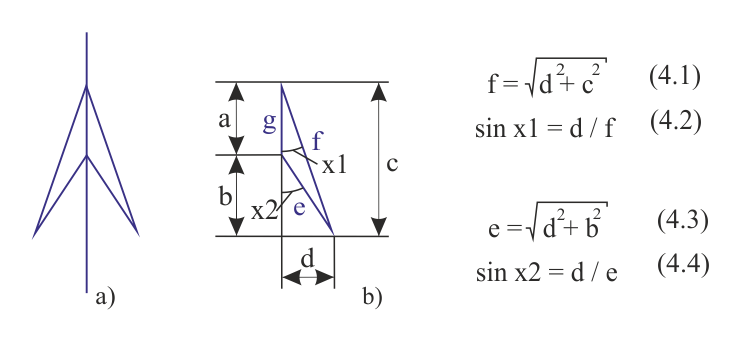
Fig. 6. Mathematical calculation of the "arrowhead"
After the basics of plotting, analyze the code of the indicator.
The code of the indicator
Before writing the code, it was necessary to prepare graphical resourses of the indicator - 540 х 540 pixel sized BMP format bitmaps with transparent backgrounds. The bitmaps contain a beam extending from a corner. In the first 89 bitmaps the beam extends from the upper left corner, tha angle varying from 1 to 89 degrees, in the second 89 bitmaps the beam extends from the lower left corner, its angle varying from 91 to 179 degrees (from 1 to 89 degrees relative to the horizontal). Bitmaps with angles of 0, 90, 180 have sizes of 1 x 540 pixels and 540 х 1 pixels, respectively, and do not require a transparent background.
In total there are 362 bitmaps — 181 bitmaps of one color and 181 bitmaps of the other (bitmaps 1 and 181 are the same). Filenames were chosen considering the colors of the line (red - first character "r", and blue - first character "b") and the angle they are positioned at.
Part One
Part One of the code reaches the OnInit fuction. Consider all the stages
- Designation of specific parameters (#property), in this case — 11 buffers and 4 types of graphical plots (one histogram and there lines).
- Inclusion of the resourses into the executable file (#resource), there are many of them — 362 files, as mentioned earlier. Please note that each file must be added on a separeate line, otherwise it will not be attached. Because of that most of the rows are replaced with ellipsis.
- Next come the input parameter menu, used variables and buffers.
//+------------------------------------------------------------------+
//|                                                          SPC.mq5 |
//|                                   Azotskiy Aktiniy ICQ:695710750 |
//|                          https://login.mql5.com/en/users/aktiniy |
//+------------------------------------------------------------------+
#property copyright "Azotskiy Aktiniy ICQ:695710750"
#property link      "https://login.mql5.com/en/users/aktiniy"
#property version   "1.00"
#property indicator_separate_window
#property indicator_buffers 11
#property indicator_plots 4
//---
#property indicator_label1  "Shadow"
#property indicator_type1   DRAW_COLOR_HISTOGRAM2
#property indicator_color1  clrRed,clrBlue,clrGray
#property indicator_style1  STYLE_SOLID
#property indicator_width1  1
//---
#property indicator_label2  "Open"
#property indicator_type2   DRAW_LINE
#property indicator_color2  clrRed
#property indicator_style2  STYLE_SOLID
#property indicator_width2  1
//---
#property indicator_label3  "Close"
#property indicator_type3   DRAW_LINE
#property indicator_color3  clrBlue
#property indicator_style3  STYLE_SOLID
#property indicator_width3  1
//---
#property indicator_label4  "VWMA"
#property indicator_type4   DRAW_LINE
#property indicator_color4  clrMagenta
#property indicator_style4  STYLE_SOLID
#property indicator_width4  1
//--- load resourse files
#resource "\\Images\\for_SPC\\b0.bmp";
#resource "\\Images\\for_SPC\\b1.bmp";
#resource "\\Images\\for_SPC\\b2.bmp";
#resource "\\Images\\for_SPC\\b3.bmp";
//...
//...
//...
#resource "\\Images\\for_SPC\\b176.bmp";
#resource "\\Images\\for_SPC\\b177.bmp";
#resource "\\Images\\for_SPC\\b178.bmp";
#resource "\\Images\\for_SPC\\b179.bmp";
#resource "\\Images\\for_SPC\\b180.bmp";
#resource "\\Images\\for_SPC\\r0.bmp";
#resource "\\Images\\for_SPC\\r1.bmp";
#resource "\\Images\\for_SPC\\r2.bmp";
#resource "\\Images\\for_SPC\\r3.bmp";
//...
//...
//...
#resource "\\Images\\for_SPC\\r176.bmp";
#resource "\\Images\\for_SPC\\r177.bmp";
#resource "\\Images\\for_SPC\\r178.bmp";
#resource "\\Images\\for_SPC\\r179.bmp";
#resource "\\Images\\for_SPC\\r180.bmp";
//+------------------------------------------------------------------+
//| Type Drawing                                                     |
//+------------------------------------------------------------------+
enum type_drawing
  {
   spindles=0,       // Spindles
   line_histogram=1, // Line and histogram
  };
//+------------------------------------------------------------------+
//| Type Price                                                       |
//+------------------------------------------------------------------+
enum type_price
  {
   open=0,   // Open
   high=1,   // High
   low=2,    // Low
   close=3,  // Close
   middle=4, // Middle
  };
//--- input parameters
input long         magic_numb=65758473787389; // Magic number
input type_drawing type_draw=0;               // Type of indicator drawing
input int          period_VR=10;              // Volume Ratio formation period
input int          correct_VR=4;              // Volume Ratio correction number
input int          period_VWMA=10;            // Volume Weighted Moving Average formation period
input int          spindles_num=1000;         // Number of spindles
input type_price   type_price_VWMA=0;         // Price type for plotting Volume Weighted Moving Average
                                              // open=0; high=1; low=2; close=3; middle=4
//--- output variables
int ext_period_VR=0;
int ext_correct_VR;
int ext_period_VWMA=0;
int ext_spin_num=0;
int long_period=0;
//--- variables of chart parameter
double win_price_max_ext=0; // maximum value of the chart
double win_price_min_ext=0; // minimum value of the chart
double win_height_pixels_ext=0; // height in pixels
double win_width_pixels_ext=0;  // width in pixels
double win_bars_ext=0; // width in bars
//--- Auxiliary variables
int end_bar;
//--- Indicator buffers
double         Buff_up[];   // Buffer of the upper points of the histogram
double         Buff_down[]; // Buffer of the lower points of the histogram
double         Buff_color_up_down[]; // Buffer of the color of the histogram
double         Buff_open_ext[];  // Open price output buffer
double         Buff_close_ext[]; // Close price output buffer
double         Buff_VWMA_ext[];  // Volume Weighted Moving Average output buffer
double         Buff_open[];  // Open price buffer
double         Buff_close[]; // Close price buffer
double         Buff_VWMA[];  // Volume Weighted Moving Average buffer
double         Buff_VR[];   // Volume Ratio buffer
double         Buff_time[]; // bar opening time buffer
You can see that there are only a few input parameters:
- Magic number — introduced to distinguish indicators;
- Type of indicator drawing — may be a classic view (spindles) or the same points in the form of lines;
- Volume Ratio formation period — the period for plotting VR;
- Volume Ratio correction number — as the VR affects the width, it can be adjusted with this parameter.
- Volume Weighted Moving Average formation period — the period for plotting VWMA;
- Number of spindles — the amount of displayed spindles can be reduced to decrease the load on the system;
- Price type for plotting Volume Weighted Moving Average — select the type of price to plot VWMA.
Output variables are necessary for validation and adjustment of the input parameters. Variables of chart parameter follow the indicator window changes. See the next section for details.
Declaration of indicator buffers concludes the Part One. There are 11 buffers here.
OnInit function
//+------------------------------------------------------------------+ //| Custom indicator initialization function | //+------------------------------------------------------------------+ int OnInit() { //--- check input variables if(period_VR<=0) { ext_period_VR=10; // change the value of the variable Alert("Volume Ratio formation period was input incorrectly and has been changed."); } else ext_period_VR=period_VR; if(correct_VR<=0) { ext_correct_VR=10; // change the value of the variable Alert("Volume Ratio correction number was input incorrectly and has been changed."); } else ext_correct_VR=correct_VR; if(period_VWMA<=0) { ext_period_VWMA=10; // change the value of the variable Alert("Volume Weighted Moving Average formation period was input incorrectly and has been changed."); } else ext_period_VWMA=period_VWMA; if(spindles_num<=0) { ext_spin_num=10; // change the value of the variable Alert("Number of spindles was input incorrectly and has been changed."); } else ext_spin_num=spindles_num; //--- search for the longest period to plot the chart if(ext_period_VR>ext_period_VWMA)long_period=ext_period_VR; else long_period=ext_period_VWMA; //--- indicator buffers mapping SetIndexBuffer(0,Buff_up,INDICATOR_DATA); SetIndexBuffer(1,Buff_down,INDICATOR_DATA); SetIndexBuffer(2,Buff_color_up_down,INDICATOR_COLOR_INDEX); SetIndexBuffer(3,Buff_open_ext,INDICATOR_DATA); SetIndexBuffer(4,Buff_close_ext,INDICATOR_DATA); SetIndexBuffer(5,Buff_VWMA_ext,INDICATOR_DATA); SetIndexBuffer(6,Buff_open,INDICATOR_CALCULATIONS); SetIndexBuffer(7,Buff_close,INDICATOR_CALCULATIONS); SetIndexBuffer(8,Buff_VWMA,INDICATOR_CALCULATIONS); SetIndexBuffer(9,Buff_VR,INDICATOR_CALCULATIONS); SetIndexBuffer(10,Buff_time,INDICATOR_CALCULATIONS); //--- set the name of the indicator IndicatorSetString(INDICATOR_SHORTNAME,"SPC "+IntegerToString(magic_numb)); PlotIndexSetString(0,PLOT_LABEL,"SPC"); //--- set the precision IndicatorSetInteger(INDICATOR_DIGITS,_Digits+1); //--- set the first bar from which to start drawing the indicator PlotIndexSetInteger(0,PLOT_DRAW_BEGIN,long_period+1); //--- prohibit the display of the results of the current values for the indicator PlotIndexSetInteger(0,PLOT_SHOW_DATA,false); PlotIndexSetInteger(1,PLOT_SHOW_DATA,false); PlotIndexSetInteger(2,PLOT_SHOW_DATA,false); PlotIndexSetInteger(3,PLOT_SHOW_DATA,false); //--- set the values that will not be displayed PlotIndexSetDouble(1,PLOT_EMPTY_VALUE,0); PlotIndexSetDouble(2,PLOT_EMPTY_VALUE,0); PlotIndexSetDouble(3,PLOT_EMPTY_VALUE,0); //--- create objects to use if(type_draw==0) { for(int x=0; x<=ext_spin_num; x++) { ObjectCreate(0,"SPC"+IntegerToString(magic_numb)+IntegerToString(x)+"1",OBJ_BITMAP,ChartWindowFind(),__DATE__,0); ObjectCreate(0,"SPC"+IntegerToString(magic_numb)+IntegerToString(x)+"2",OBJ_BITMAP,ChartWindowFind(),__DATE__,0); ObjectCreate(0,"SPC"+IntegerToString(magic_numb)+IntegerToString(x)+"3",OBJ_BITMAP,ChartWindowFind(),__DATE__,0); ObjectCreate(0,"SPC"+IntegerToString(magic_numb)+IntegerToString(x)+"4",OBJ_BITMAP,ChartWindowFind(),__DATE__,0); } } //--- return(INIT_SUCCEEDED); }
Here we check the correctness of the entered parameters, correct them using the previously declared variables (output variables) if necessary. Find out which of the previously used periods is larger, initialize buffers and configure the appearance of the indicator. Create graphical objects to work with in a small array (limited by the "number of spindles" parameter).
OnChartEvent function
//+------------------------------------------------------------------+
//| ChartEvent function                                              |
//+------------------------------------------------------------------+
void OnChartEvent(const int id,
                  const long &lparam,
                  const double &dparam,
                  const string &sparam)
  {
//--- keypress event
   if(id==CHARTEVENT_KEYDOWN)
     {
      if(lparam==82)
        {
         if(ChartGetDouble(0,CHART_PRICE_MAX,ChartWindowFind())>0)// check the presence of data on the chart
           {
            if(func_check_chart()==true)
              {
               if(type_draw==0)func_drawing(true,ext_spin_num,end_bar);
              }
           }
        }
     }
  }
This function binds the key "R" (code 82) to update (or rather to redraw) the chart. It serves to adjust (redraw) the chart in case the indicator's window size changed. It is due to the fact that images stretch when the window size changes. Naturally the chart is redrawn in case of price change event, but sometimes it is necessary to quickly update the plotting. This function serves that purpose.
The function itself consists of if-else conditional operators entirely and includes a function that checks the changes in the dimensions of the indicator window (func_check_chart), as well as a chart drawing function(func_drawing).
Indicator window checking function
//+------------------------------------------------------------------+
//| Func Check Chart                                                 |
//+------------------------------------------------------------------+
bool func_check_chart()
  {
//--- response variable
   bool x=false;
//--- find out the size of the chart
   int win=ChartWindowFind(); // define subwindow as the indicator works in a separate window
   double win_price_max=ChartGetDouble(0,CHART_PRICE_MAX,win); // maximum value of the chart
   double win_price_min=ChartGetDouble(0,CHART_PRICE_MIN,win); // minimum value of the chart
   double win_height_pixels=(double)ChartGetInteger(0,CHART_HEIGHT_IN_PIXELS,win); // height in pixels
   double win_width_pixels=(double)ChartGetInteger(0,CHART_WIDTH_IN_PIXELS,win); // width in pixels
   double win_bars=(double)ChartGetInteger(0,CHART_WIDTH_IN_BARS,win); // width in bars

//--- check if values have changed
   int factor=(int)MathPow(10,_Digits);// set the double type to int type conversion factor
   if(int(win_price_max*factor)!=int(win_price_max_ext*factor))
     {
      win_price_max_ext=win_price_max;
      x=true;
     }
   if(int(win_price_min*factor)!=int(win_price_min_ext*factor))
     {
      win_price_min_ext=win_price_min;
      x=true;
     }
   if(int(win_height_pixels*factor)!=int(win_height_pixels_ext*factor))
     {
      win_height_pixels_ext=win_height_pixels;
      x=true;
     }
   if(int(win_width_pixels*factor)!=int(win_width_pixels_ext*factor))
     {
      win_width_pixels_ext=win_width_pixels;
      x=true;
     }
   if(int(win_bars*factor)!=int(win_bars_ext*factor))
     {
      win_bars_ext=win_bars;
      x=true;
     }
   if(func_new_bar(PERIOD_CURRENT)==true)
     {
      x=true;
     }
   return(x);
  }
This function is used as a signal to change the window size of the indicator. First find out current parameters of the window (height and width in price and pixels) using chart functions (ChartGetInteger and ChartGetDouble), and then compare them to the values of previously declared global variables (variables of chart parameter).
Chart plotting control function
//+------------------------------------------------------------------+
//| Func Drawing                                                     |
//+------------------------------------------------------------------+
void func_drawing(bool type_action,// type of modification action: 0-last two, 1-all
                  int num,         // amount of rendered spindles
                  int end_bar_now) // current last bar
  {
   int begin;
   if(end_bar_now>num)begin=end_bar_now-num;
   else begin=long_period+1;
//--- find the maximum value of VR
   double VR_max=0;
   for(int x=begin; x<end_bar_now-1; x++)
     {
      if(Buff_VR[x]<Buff_VR[x+1])VR_max=Buff_VR[x+1];
      else VR_max=Buff_VR[x];
     }
//--- calculation of scale
   double scale_height=win_height_pixels_ext/(win_price_max_ext-win_price_min_ext);
   double scale_width=win_width_pixels_ext/win_bars_ext;
//--- plotting (x - part of object's name, y - plotting data array index)
   if(type_action==false)// false - update last two spindles
     {
      for(int x=num-2,y=end_bar_now-2; y<end_bar_now; y++,x++)
        {
         func_picture("SPC"+IntegerToString(magic_numb)+IntegerToString(x),Buff_open[y],Buff_close[y],datetime(Buff_time[y]),Buff_VR[y],VR_max,Buff_VWMA[y],ext_correct_VR,scale_height,scale_width);
        }
     }
//---
   if(type_action==true)// true - update all spindles
     {
      for(int x=0,y=begin; y<end_bar_now; y++,x++)
        {
         func_picture("SPC"+IntegerToString(magic_numb)+IntegerToString(x),Buff_open[y],Buff_close[y],datetime(Buff_time[y]),Buff_VR[y],VR_max,Buff_VWMA[y],ext_correct_VR,scale_height,scale_width);
        }
     }
   ChartRedraw();
  }
The function is a control structure of chart plotting. Input parameters are: modification parameter (either the last two or all at once), total amount of spindles, last spindle. Modification parameter is here to modify only the last spindle in case price only changes in it, and to make sure the other spindles are left untouched in order to increase indicator performance.
Next the bar to start with is calculated. If there is less information about the bars than the number of spindles, then the plotting starts with the largest chart formation period.
Then find the biggest Volume Ratio (required as a parameter to be passed to the func_picture function, discussed below) and calculate the scale to plot the chart. Depending on modification parameter call a modification cycle of spindles (graphical objects previously created with the help of func_picture function).
Graphical plotting function
//+------------------------------------------------------------------+
//| Func Picture                                                     |
//+------------------------------------------------------------------+
void func_picture(string name,        // name of the object
                  double open,        // Open price of the bar
                  double close,       // Close price of the bar
                  datetime time,      // bar time
                  double VR,          // value of the Volume Ratio
                  double VR_maximum,  // maximum value of the Volume Ratio
                  double VWMA,        // value of the Volume Weighted Moving Average
                  int correct,        // correction parameter of the Volume Ratio when displayed
                  double scale_height,// height scale (pixels/price)
                  double scale_width) // width scale (pixels/bars)
  {
   string first_name;// the first character of the name of the file used in plotting
   string second_name_right;// the rest of the name of the file used in plotting the right side
   string second_name_left; // the rest of the name of the file used in plotting the left side
   double cathetus_a;// cathetus a
   double cathetus_b;// cathetus b
   double hypotenuse;// hypotenuse
   int corner;// corner
//--- find bar open and close "angles"
   cathetus_b=int(VR/VR_maximum/correct*scale_width);// width in pixels
                                                     //picture 540
   if(open<=close) first_name="r";// up bar or Doji
   if(open>close) first_name="b"; // down bar
//---
   if(open<VWMA)// VWMA is above the open price
     {
      cathetus_a=int((VWMA-open)*scale_height);
      hypotenuse=MathCeil(MathSqrt(MathPow(cathetus_a,2)+MathPow(cathetus_b,2)));
      if(hypotenuse<=0) hypotenuse=1;
      corner=int(180-(MathArcsin(cathetus_b/hypotenuse)*360/(M_PI*2)));
      second_name_right=IntegerToString(corner);
      second_name_left=IntegerToString(180-corner);
      func_obj_mod(name+"1","::Images\\for_SPC\\"+first_name+second_name_right+".bmp",int(cathetus_b+1),int(cathetus_a+1),540-int(cathetus_a+2),ANCHOR_LEFT_LOWER,time,open);
      func_obj_mod(name+"2","::Images\\for_SPC\\"+first_name+second_name_left+".bmp",int(cathetus_b+1),int(cathetus_a+1),0,ANCHOR_RIGHT_LOWER,time,open);
     }
   if(open>VWMA)// VWMA is below the open price
     {
      cathetus_a=int((open-VWMA)*scale_height);
      hypotenuse=MathCeil(MathSqrt(MathPow(cathetus_a,2)+MathPow(cathetus_b,2)));
      if(hypotenuse<=0) hypotenuse=1;
      corner=int((MathArcsin(cathetus_b/hypotenuse)*360/(M_PI*2)));
      second_name_right=IntegerToString(corner);
      second_name_left=IntegerToString(180-corner);
      func_obj_mod(name+"1","::Images\\for_SPC\\"+first_name+second_name_right+".bmp",int(cathetus_b+1),int(cathetus_a+1),0,ANCHOR_LEFT_UPPER,time,open);
      func_obj_mod(name+"2","::Images\\for_SPC\\"+first_name+second_name_left+".bmp",int(cathetus_b+1),int(cathetus_a+1),540-int(cathetus_a+2),ANCHOR_RIGHT_UPPER,time,open);
     }
   if(open==VWMA)// VWMA is at the open price level
     {
      func_obj_mod(name+"1","::Images\\for_SPC\\"+first_name+"90"+".bmp",int(cathetus_b+1),2,0,ANCHOR_LEFT,time,open);
      func_obj_mod(name+"2","::Images\\for_SPC\\"+first_name+"90"+".bmp",int(cathetus_b+1),2,0,ANCHOR_RIGHT,time,open);
     }
   if(close<VWMA)// VWMA is above the close price
     {
      cathetus_a=int((VWMA-close)*scale_height);
      hypotenuse=MathCeil(MathSqrt(MathPow(cathetus_a,2)+MathPow(cathetus_b,2)));
      if(hypotenuse<=0) hypotenuse=1;
      corner=int(180-(MathArcsin(cathetus_b/hypotenuse)*360/(M_PI*2)));
      second_name_right=IntegerToString(corner);
      second_name_left=IntegerToString(180-corner);
      func_obj_mod(name+"3","::Images\\for_SPC\\"+first_name+second_name_right+".bmp",int(cathetus_b+1),int(cathetus_a+1),540-int(cathetus_a+2),ANCHOR_LEFT_LOWER,time,close);
      func_obj_mod(name+"4","::Images\\for_SPC\\"+first_name+second_name_left+".bmp",int(cathetus_b+1),int(cathetus_a+1),0,ANCHOR_RIGHT_LOWER,time,close);
     }
   if(close>VWMA)// VWMA is below the close price
     {
      cathetus_a=int((close-VWMA)*scale_height);
      hypotenuse=MathCeil(MathSqrt(MathPow(cathetus_a,2)+MathPow(cathetus_b,2)));
      if(hypotenuse<=0) hypotenuse=1;
      corner=int((MathArcsin(cathetus_b/hypotenuse)*360/(M_PI*2)));
      second_name_right=IntegerToString(corner);
      second_name_left=IntegerToString(180-corner);
      func_obj_mod(name+"3","::Images\\for_SPC\\"+first_name+second_name_right+".bmp",int(cathetus_b+1),int(cathetus_a+1),0,ANCHOR_LEFT_UPPER,time,close);
      func_obj_mod(name+"4","::Images\\for_SPC\\"+first_name+second_name_left+".bmp",int(cathetus_b+1),int(cathetus_a+1),540-int(cathetus_a+2),ANCHOR_RIGHT_UPPER,time,close);
     }
   if(close==VWMA)// VWMA is at the close price level
     {
      func_obj_mod(name+"3","::Images\\for_SPC\\"+first_name+"90"+".bmp",int(cathetus_b+1),2,0,ANCHOR_LEFT,time,close);
      func_obj_mod(name+"4","::Images\\for_SPC\\"+first_name+"90"+".bmp",int(cathetus_b+1),2,0,ANCHOR_RIGHT,time,close);
     }
  }
The "heart" of chart plotting — graphical objects' bitmap calculation and replacement function. It is in this function that the bitmap (i.e. four bitmaps) used in a bar is calculated in order to plot the spindle. Then with the help of the func_obj_mod function the bitmap of the graphical object is changed (all of the graphical objects were created at the end of the OnInit function in the very beginning of the code).
Parameters of the currently modified bar are passed to the function, among them is the previously mentioned maximum Volume Ratio, which serves as some relative parameter for so-called cathetus b calculation (Fig. 5, b; marked as size d).
Next the auxiliary variables are added (the first character is color, the rest of the left and right side filename — the angle in filename, cathetus a and b, hypotenuse and angle), the spindle's color is defined by a conditional operator if. Then depending on the opening and closing price levels relative to Volume Weighted Moving Average (WVMA) and based on the known formulas from figures 5 and 6 a calculation of the bitmap (four bitmaps) occurs , as well as a modification of the graphical object with the help of func_obj_mod function.
Object modification function
//+------------------------------------------------------------------+
//| Func Obj Mod                                                     |
//+------------------------------------------------------------------+
void func_obj_mod(string name,             // name of the object
                  string file,             // path to the file resourse
                  int pix_x_b,             // visibility in X
                  int pix_y_a,             // visibility in Y
                  int shift_y,             // shift in Y
                  ENUM_ANCHOR_POINT anchor,// anchor point
                  datetime time,           // time coordinate
                  double price)            // price coordinate
  {
   ObjectSetString(0,name,OBJPROP_BMPFILE,file);
   ObjectSetInteger(0,name,OBJPROP_XSIZE,pix_x_b);// visibility in X
   ObjectSetInteger(0,name,OBJPROP_YSIZE,pix_y_a);// visibility in Y
   ObjectSetInteger(0,name,OBJPROP_XOFFSET,0);// no shift in X axis
   ObjectSetInteger(0,name,OBJPROP_YOFFSET,shift_y);// set shift in Y axis
   ObjectSetInteger(0,name,OBJPROP_BACK,false);// diplay on foreground
   ObjectSetInteger(0,name,OBJPROP_SELECTABLE,false);// disable drag mode
   ObjectSetInteger(0,name,OBJPROP_SELECTED,false);
   ObjectSetInteger(0,name,OBJPROP_HIDDEN,true);// hide the name of graphical object
   ObjectSetInteger(0,name,OBJPROP_ANCHOR,anchor);// set anchor point
   ObjectSetInteger(0,name,OBJPROP_TIME,time);// set time coordinate
   ObjectSetDouble(0,name,OBJPROP_PRICE,price);// set price coordinate
  }
The function is very simple, it substitutes values it is passed into the object property changing function. The main changeable properties are the object's bitmap, visibility and anchor point.
OnCalculate function
//+------------------------------------------------------------------+
//| Custom indicator iteration function                              |
//+------------------------------------------------------------------+
int OnCalculate(const int rates_total,
                const int prev_calculated,
                const datetime &time[],
                const double &open[],
                const double &high[],
                const double &low[],
                const double &close[],
                const long &tick_volume[],
                const long &volume[],
                const int &spread[])
  {
//--- check availability of the period history
   if(rates_total<long_period)
     {
      Alert("VR or VWMA period is greater than history data or history data is not loaded.");
      return(0);
     }
//--- search position
   int position=prev_calculated-1;
   if(position<long_period)position=long_period; // change position
//--- main cycle of buffer calculation
   for(int i=position; i<rates_total; i++)
     {
      //--- fill in histogram buffers
      Buff_up[i]=high[i];
      Buff_down[i]=low[i];
      if(open[i]<close[i])Buff_color_up_down[i]=0;// up bar
      if(open[i]>close[i])Buff_color_up_down[i]=1;// down bar
      if(open[i]==close[i])Buff_color_up_down[i]=2;// Doji bar
      //--- fill in auxiliary buffers
      Buff_open[i]=open[i];
      Buff_close[i]=close[i];
      Buff_time[i]=double(time[i]);
      //--- calculate Volume Ratio
      double mid_vol=0;
      int x=0;
      for(x=i-ext_period_VR; x<=i; x++)
        {
         mid_vol+=double(tick_volume[x]);
        }
      mid_vol/=x;
      Buff_VR[i]=tick_volume[i]/mid_vol; // calculate VR
      //--- calculate Volume Weighted Moving Average
      long vol=0;
      double price_vol=0;
      x=0;
      switch(type_price_VWMA)
        {
         case 0:
           {
            for(x=i-ext_period_VWMA; x<=i; x++)
              {
               price_vol+=double(open[x]*tick_volume[x]);
               vol+=tick_volume[x];
              }
           }
         break;
         //---
         case 1:
           {
            for(x=i-ext_period_VWMA; x<=i; x++)
              {
               price_vol+=double(high[x]*tick_volume[x]);
               vol+=tick_volume[x];
              }
           }
         break;
         //---
         case 2:
           {
            for(x=i-ext_period_VWMA; x<=i; x++)
              {
               price_vol+=double(low[x]*tick_volume[x]);
               vol+=tick_volume[x];
              }
           }
         break;
         //---
         case 3:
           {
            for(x=i-ext_period_VWMA; x<=i; x++)
              {
               price_vol+=double(close[x]*tick_volume[x]);
               vol+=tick_volume[x];
              }
           }
         break;
         //---
         case 4:
           {
            for(x=i-ext_period_VWMA; x<=i; x++)
              {
               double price=(open[x]+high[x]+low[x]+close[x])/4;
               price_vol+=double(price*tick_volume[x]);
               vol+=tick_volume[x];
              }
           }
         break;
        }
      Buff_VWMA[i]=price_vol/vol; // calculate VWMA
      //---
      if(type_draw==1)
        {
         Buff_open_ext[i]=Buff_open[i];
         Buff_close_ext[i]=Buff_close[i];
         Buff_VWMA_ext[i]=Buff_VWMA[i];
        }
      else
        {
         //--- decrease the size of unused arrays
         ArrayResize(Buff_open_ext,1);
         ArrayResize(Buff_close_ext,1);
         ArrayResize(Buff_VWMA_ext,1);
         //--- zero out unused arrays
         ZeroMemory(Buff_open_ext);
         ZeroMemory(Buff_close_ext);
         ZeroMemory(Buff_VWMA_ext);
        }
     }
   end_bar=rates_total;// define the number of the last bar
//---
   if(ChartGetDouble(0,CHART_PRICE_MAX,ChartWindowFind())>0 && type_draw==0)// check availability of data in the indicator window to start plotting
     {
      func_drawing(func_check_chart(),ext_spin_num,end_bar);
     }
//--- return value of prev_calculated for next call
   return(rates_total);
  }
Standart function of the indicator calculates and fills the buffers with data. First VR and VWMA periods and data on bars are validated, in case of mismatch a message is shown. Then the position to start filling the buffer from is found. The buffer of the histogram denoting the highest and the lowest prices is filled. After that the Volume Ratio (VR) and the Volume Weighted Moving Average (VWMA) buffers are calculated and filled according to the formulas 1 and 2 (defined in the Introduction chapter).
Other functions
For the indicator to work more properly a function of new bar definition (func_new_bar) and a function of indicator deinitialization (OnDeinit) are present.
The func_new_bar function determines the appearance of a new bar on the chart and serves as an auxiliary in func_check_chart function.
//+------------------------------------------------------------------+
//| Func New Bar                                                     |
//+------------------------------------------------------------------+
bool func_new_bar(ENUM_TIMEFRAMES period_time)
  {
   static datetime old_times; // old values storage variable
   bool res=false;            // analysis result variable
   datetime new_time[1];      // new bar time
   int copied=CopyTime(_Symbol,period_time,0,1,new_time); // copy the time of the last bar into the new_time cell
   if(copied>0) // data copied
     {
      if(old_times!=new_time[0]) // if the bar's old time is not equal to new one
        {
         if(old_times!=0) res=true; // if it is not the first launch, true = new bar
         old_times=new_time[0];     // store the bar's time
        }
     }
   return(res);
  }
//+------------------------------------------------------------------+
This function has already been presented in previous articles and therefore needs no comments.
The OnDeinit function deletes graphical objects created earlier in the OnInit function. The function is standart for the indicator and is called when the indicator is removed from the chart.
//+------------------------------------------------------------------+
//| OnDeinit                                                         |
//+------------------------------------------------------------------+
void OnDeinit(const int reason)
  {
//--- delete used objects
   if(type_draw==0)
     {
      for(int x=0; x<=ext_spin_num; x++)
        {
         ObjectDelete(0,"SPC"+IntegerToString(magic_numb)+IntegerToString(x)+"1");
         ObjectDelete(0,"SPC"+IntegerToString(magic_numb)+IntegerToString(x)+"2");
         ObjectDelete(0,"SPC"+IntegerToString(magic_numb)+IntegerToString(x)+"3");
         ObjectDelete(0,"SPC"+IntegerToString(magic_numb)+IntegerToString(x)+"4");
        }
     }
  }
This concludes the code of the indicator. If you have any questions about the topic or definitions, please feel free to contact me via the article comments section or private messages.
Expertr advisor and trading strategy
Before considering a trading strategy, test how the advisor works on this indicator. The test will be carried out on the advisor which only uses one spindle to analyze its actions. The VR (Volume Ratio) is not used. It turns out that the analysis is going to take place in a kind of patterns consisting of a single spindle. There are 30 of such variants in total, more details in Figure 7:
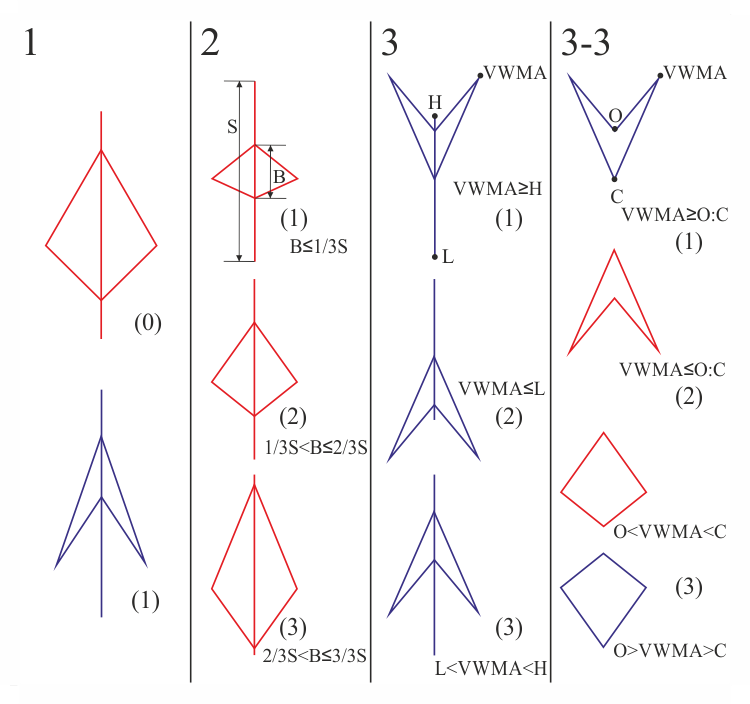
Fig. 7. Possible formations of spindles
Spindle types can be divided into three groups and one subgroup (Fig. 7). It becomes possible if we consider differences in spindles' movement directions of prices, opening and closing prices relative to the whole spindle and the Volume Weighted Moving Average level.
Suppose that the first difference of the spindles is their color, i.e. upmarket or downmarket in the reviewed period (Fig. 7, column 1). In figure 7, first column, (0) — up (red) and (1) — down (blue). The next column shows differences in body B (opening and closing prices) relative to the shadow S (the highest and lowest prices for the period). This difference in the current example is divided only into three parts (Fig. 7, column 2). The third column considers the comparison of the VWMA (Volume Weighted Moving Average) level to the highest and the lowest prices (High and Low). It can be located above (1), below(2) and between(3) the highest and the lowest prices. In the third column the spindle (3) can also differ by Open and Close prices of the period relative to the VWMA, thus another column 3-3 (derived from column 3 (3)) is formed in Figure 7.
Given all the possible combinations of the above differences we get 30 types of spindles.
All numbers in Figure 7 are assigned according to the results of a function in a trade expert with code below.
Parameters of the Expert Advisor
All code is split into functions, and to decrease the amount of code the functions are called from subfunctions, thereby forming a hierarchical tree of functions. Input variables declared at the beginning of the code are identical to the parameters of the indicator, supplemented only by lot size, stop loss and thirty patterns of spindles. Variables for indicator handle and buffers for storing data which is used to determine the pattern are declared at the end.
//+------------------------------------------------------------------+
//|                                                        EASPC.mq5 |
//|                                   Azotskiy Aktiniy ICQ:695710750 |
//|                          https://login.mql5.com/en/users/aktiniy |
//+------------------------------------------------------------------+
#property copyright "Azotskiy Aktiniy ICQ:695710750"
#property link      "https://login.mql5.com/en/users/aktiniy"
#property version   "1.00"
//+------------------------------------------------------------------+
//| Type Drawing                                                     |
//+------------------------------------------------------------------+
enum type_drawing
  {
   spindles=0,       // Spindles
   line_histogram=1, // Line and histogram
  };
//+------------------------------------------------------------------+
//| Type Price                                                       |
//+------------------------------------------------------------------+
enum type_price
  {
   open=0,   // Open
   high=1,   // High
   low=2,    // Low
   close=3,  // Close
   middle=4, // Middle
  };
//--- input parameters
input long         magic_numb=65758473787389; // Magic number
input type_drawing type_draw=1;               // Type of indicator drawing
input int          period_VR=10;              // Volume Ratio formation period
input int          correct_VR=4;              // Volume Ratio correction number
input int          period_VWMA=10;            // Volume Weighted Moving Average formation period
input int          spindles_num=10;           // Number of spindles
input type_price   type_price_VWMA=0;         // Price type for plotting Volume Weighted Moving Average
                                              // open=0; high=1; low=2; close=3; middle=4
input double lot=0.01;                        // Lot size
input int    stop=1000;                       // Stop Loss
//---
input char   p1=1;                            // Actions on patterns 1-buy, 2-sell, 3-close position, 4-do nothing
input char   p2=1;
input char   p3=1;
input char   p4=1;
input char   p5=1;
input char   p6=1;
input char   p7=1;
input char   p8=1;
input char   p9=1;
input char   p10=1;
input char   p11=1;
input char   p12=1;
input char   p13=1;
input char   p14=1;
input char   p15=1;
input char   p16=1;
input char   p17=1;
input char   p18=1;
input char   p19=1;
input char   p20=1;
input char   p21=1;
input char   p22=1;
input char   p23=1;
input char   p24=1;
input char   p25=1;
input char   p26=1;
input char   p27=1;
input char   p28=1;
input char   p29=1;
input char   p30=1;
//---
int handle_SPC; // indicator handle
long position_type; // position type
//--- buffers for indicator's copied values
double         Buff_up[3]; // buffer of the upper points of the histogram
double         Buff_down[3]; // buffer of the lower points of the histogram
double         Buff_color_up_down[3]; // buffer of the color of the histogram
double         Buff_open_ext[3]; // Open price buffer
double         Buff_close_ext[3]; // Close price buffer
double         Buff_VWMA_ext[3]; // Volume Weighted Moving Average buffer
Initialization of indicator handle happens in OnInit function.
//+------------------------------------------------------------------+
//| Expert initialization function                                   |
//+------------------------------------------------------------------+
int OnInit()
  {
//---
   handle_SPC=iCustom(_Symbol,PERIOD_CURRENT,"SPC.ex5",magic_numb,type_draw,period_VR,correct_VR,period_VWMA,spindles_num,type_price_VWMA);
//---
   return(INIT_SUCCEEDED);
  }
Functon of sending orders to the server
There are two of such functions: one for opening orders, the other for closing positions. Both functions are based on examples from MQL5 documentation and include a collaboration of trade request structure and a call to OrderSend function with further analysis of result structure.
//+------------------------------------------------------------------+
//| Func Send Order                                                  |
//+------------------------------------------------------------------+
bool func_send_order(ENUM_ORDER_TYPE type_order,// type of the placed order
                     double volume)             // lot deal volume
  {
   bool x=false; // variable for answer
//--- declare variables for sending order
   MqlTradeRequest order_request={0};
   MqlTradeResult order_result={0};
//--- set the variable for sending order
   order_request.action=TRADE_ACTION_DEAL;
   order_request.deviation=3;
   order_request.magic=555;
   order_request.symbol=_Symbol;
   order_request.type=type_order;
   order_request.type_filling=ORDER_FILLING_FOK;
   order_request.volume=volume;
   if(type_order==ORDER_TYPE_BUY)
     {
      order_request.price=SymbolInfoDouble(_Symbol,SYMBOL_ASK);
      order_request.sl=order_request.price-(_Point*stop);
     }
   if(type_order==ORDER_TYPE_SELL)
     {
      order_request.price=SymbolInfoDouble(_Symbol,SYMBOL_BID);
      order_request.sl=order_request.price+(_Point*stop);
     }
//--- send order
   bool y=OrderSend(order_request,order_result);
   if(y!=true)Alert("Order sending error.");
//--- check the result
   if(order_result.retcode==10008 || order_result.retcode==10009) x=true;
   return(x);
  }
//+------------------------------------------------------------------+
//| Func Delete Position                                             |
//+------------------------------------------------------------------+
bool func_delete_position()
  {
   bool x=false;
//--- mark the position to work with
   PositionSelect(_Symbol);
   double vol=PositionGetDouble(POSITION_VOLUME);
   long type=PositionGetInteger(POSITION_TYPE);
   ENUM_ORDER_TYPE type_order;
   if(type==POSITION_TYPE_BUY)type_order=ORDER_TYPE_SELL;
   else type_order=ORDER_TYPE_BUY;
//--- declare variables for sending order
   MqlTradeRequest order_request={0};
   MqlTradeResult order_result={0};
//--- set the variable for sending order
   order_request.action=TRADE_ACTION_DEAL;
   order_request.deviation=3;
   order_request.magic=555;
   order_request.symbol=_Symbol;
   order_request.type=type_order;
   order_request.type_filling=ORDER_FILLING_FOK;
   order_request.volume=vol;
   if(type_order==ORDER_TYPE_BUY)order_request.price=SymbolInfoDouble(_Symbol,SYMBOL_ASK);
   if(type_order==ORDER_TYPE_SELL)order_request.price=SymbolInfoDouble(_Symbol,SYMBOL_BID);
//--- send order
   bool y=OrderSend(order_request,order_result);
   if(y!=true)Alert("Order sending error.");
//--- check the result
   if(order_result.retcode==10008 || order_result.retcode==10009) x=true;
   return(x);
  }
Auxiliary function func_new_bar which determines the appearane of a new bar on the chart is also present in the code. It is described above and does not require a publication of its code.
After describing all the standart functions consider the "heart" of calculations.
The consolidation of all actions takes place in the OnTick function. First the buffers used for calculations are filled with the help of the CopyBuffer function. Next it is checked if the current symbol has any positions on it, this is necessary for another order (position) placement and removal control function. After that the sizes for defining the pattern are prepared. These are body — distance between opening and closing prices, shadow — the distance between the highest and lowest prices for the current period, and also their ratio which is later passed to the func_one function (Fig. 7, column 2).
Next the func_two and func_three functions are utilized, columns 3 and 3-3 on Figure 7, respectively. After that check the spindle's color using switch according to Figure 7, column 1. This way we get a decision tree of functions when the next switch operator switches to func_pre_work (discussed later) function depending on the value of the variable afun_1_1 and according to column 2 of Figure 7, based on the sizes of body and shadow.
//+------------------------------------------------------------------+
//| Expert tick function                                             |
//+------------------------------------------------------------------+
void OnTick()
  {
//---
   if(func_new_bar(PERIOD_CURRENT)==true)
     {
      //--- copy the indicator buffers
      CopyBuffer(handle_SPC,0,1,3,Buff_up);
      CopyBuffer(handle_SPC,1,1,3,Buff_down);
      CopyBuffer(handle_SPC,2,1,3,Buff_color_up_down);
      CopyBuffer(handle_SPC,3,1,3,Buff_open_ext);
      CopyBuffer(handle_SPC,4,1,3,Buff_close_ext);
      CopyBuffer(handle_SPC,5,1,3,Buff_VWMA_ext);
      //--- analyze the situation
      //--- check if there is an order placed
      if(PositionSelect(_Symbol)==true)
        {
         position_type=PositionGetInteger(POSITION_TYPE); // BUY=0, SELL=1
        }
      else
        {
         position_type=-1; // no position for the symbol
        }
      //--- prepare values to compare
      double body=Buff_open_ext[2]-Buff_close_ext[2];
      body=MathAbs(body);
      double shadow=Buff_up[2]-Buff_down[2];
      shadow=MathAbs(shadow);
      if(shadow==0)shadow=1;// prevent division by zero
      double body_shadow=body/shadow;
      //--- variables for function answer
      char afun_1_1=func_one(body_shadow);
      char afun_2_1=func_two(Buff_up[2],Buff_down[2],Buff_VWMA_ext[2]);
      char afun_3_1=func_three(Buff_open_ext[2],Buff_close_ext[2],Buff_VWMA_ext[2]);
      //---
      switch(int(Buff_color_up_down[2]))
        {
         case 0:
           {
            switch(afun_1_1)
              {
               case 1:
                  func_pre_work(afun_2_1,afun_3_1,p1,p2,p3,p4,p5);
                  break;
               case 2:
                  func_pre_work(afun_2_1,afun_3_1,p6,p7,p8,p9,p10);
                  break;
               case 3:
                  func_pre_work(afun_2_1,afun_3_1,p11,p12,p13,p14,p15);
                  break;
              }
           }
         break;
         case 1:
           {
            switch(afun_1_1)
              {
               case 1:
                  func_pre_work(afun_2_1,afun_3_1,p16,p17,p18,p19,p20);
                  break;
               case 2:
                  func_pre_work(afun_2_1,afun_3_1,p21,p22,p23,p24,p25);
                  break;
               case 3:
                  func_pre_work(afun_2_1,afun_3_1,p26,p27,p28,p29,p30);
                  break;
              }
           }
         break;
        }
     }
  }
The func_pre_work function continues branching the already formed function decision tree. We get a program implementation of the code based on Figure 7, columns 3 (variable f_2) and 3-3 (variable f_3), switching is performed to the last function of the tree — func_work.
//+------------------------------------------------------------------+
//| Func Pre Work                                                    |
//+------------------------------------------------------------------+
void func_pre_work(char f_2,     // result of the Func Two function
                   char f_3,     // result of the Func Three function
                   char pat_1,   // pattern 1
                   char pat_2,   // pattern 2
                   char pat_3_1, // pattern 3_1
                   char pat_3_2, // pattern 3_2
                   char pat_3_3) // pattern 3_3
  {
   switch(f_2)
     {
      case 1: //1
         func_work(pat_1);
         break;
      case 2: //2
         func_work(pat_2);
         break;
      case 3:
        {
         switch(f_3)
           {
            case 1: //3_1
               func_work(pat_3_1);
               break;
            case 2: //3_2
               func_work(pat_3_2);
               break;
            case 3: //3_3
               func_work(pat_3_3);
               break;
           }
        }
      break;
     }
  }
The func_work function decides what to do with a position by choosing one of the four options: buy, sell, close position and do nothing. Here the final control is transferred to the already known func_send_order and func_delete_position functions.
//+------------------------------------------------------------------+
//| Func Work                                                        |
//+------------------------------------------------------------------+
void func_work(char pattern)
  {
   switch(pattern)
     {
      case 1: // buy
         if(position_type!=-1)func_delete_position();
         func_send_order(ORDER_TYPE_BUY,lot);
         break;
      case 2: // sell
         if(position_type!=-1)func_delete_position();
         func_send_order(ORDER_TYPE_SELL,lot);
         break;
      case 3: // close position
         if(position_type!=-1)func_delete_position();
         break;
      case 4: // do nothing
         break;
     }
  }
The last of the previously mentioned functions are left: func_one, func_two and func_three. They convert transmitted data in the form of price values into integer data for the switch operator. If you go back to Figure 7, the func_one — is the implementation of the column 2, the func_two — of the column 3 and the func_three — of the column 3-3. Return values of these functions are integers 1, 2 and 3 which also correspond to the numbers from Figure 7.
//+------------------------------------------------------------------+
//| Func One                                                         |
//+------------------------------------------------------------------+
char func_one(double body_shadow_in)
  {
   char x=0; // response variable
   if(body_shadow_in<=(double(1)/double(3))) x=1;
   if(body_shadow_in>(double(1)/double(3)) && body_shadow_in<=(double(2)/double(3))) x=2;
   if(body_shadow_in>(double(2)/double(3)) && body_shadow_in<=1) x=3;
   return(x);
  }
//+------------------------------------------------------------------+
//| Func Two                                                         |
//+------------------------------------------------------------------+
char func_two(double up,// high [Buff_up]
              double down,// low [Buff_down]
              double VWMA) // VWMA [Buff_VWMA_ext]
  {
   char x=0; // response variable
   if(VWMA>=up) x=1;
   if(VWMA<=down) x=2;
   else x=3;
   return(x);
  }
//+------------------------------------------------------------------+
//| Func Three                                                       |
//+------------------------------------------------------------------+
char func_three(double open,// open [Buff_open_ext]
                double close,// close [Buff_close_ext]
                double VWMA) // VWMA [Buff_VWMA_ext]
  {
   char x=0; // response variable
   if(open>=VWMA && close>=VWMA) x=1;
   if(open<=VWMA && close<=VWMA) x=2;
   else x=3;
   return(x);
  }
//+------------------------------------------------------------------+
Now that the advisor is ready to use, test it. First define the parameters:
- symbol and timeframe — EURUSD, H1;
- testing period — с 01.01.2013 по 01.01.2015 (2 года);
- Stop Loss — 1000;
- server — MetaQuotes-Demo.
Optimization will only be carried out by actions (i.e. buy, sell, close position and do nothing) as well as the VWMA period. Thus we will find out which actions are the most profitable for each pattern and which VWMA period is the most suitable for work in timeframe H1.
Strategy Tester settings are displayed in Figure 8:
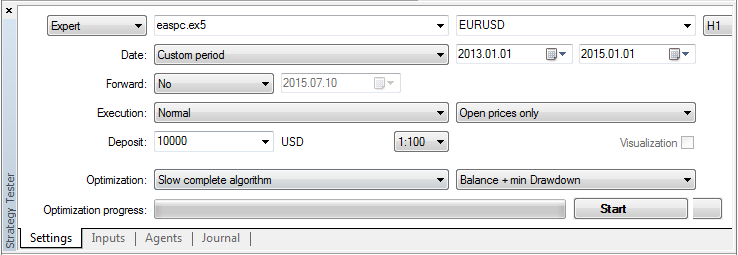
Fig. 8. Strategy Tester settings
As it was mentioned before, optimization will be carried out by action depending on the pattern and the VWMA period ranging from 10 to 500 bars, Figure 9:
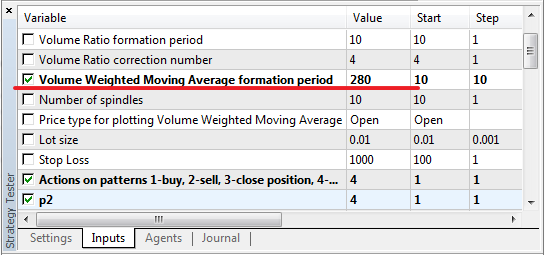
Fig. 9. Optimization Parameters
In the process of optimization we obtain a graph, Figure 10:
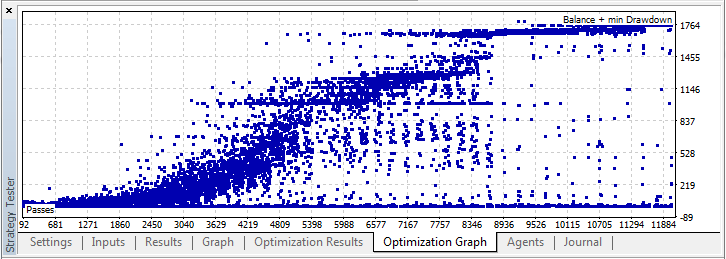
Fig. 10. Optimization graph
As a result of optimization, we receive profit of 138.71, given the lot size of 0.01 and the initial deposit of 10000, with the loss of 2.74% (approximately 28 units), Figure 11:
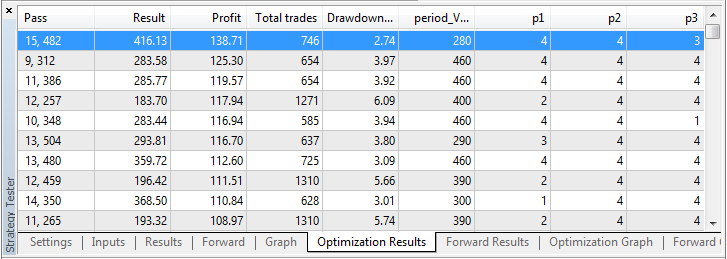
Fig. 11. Optimization Results
Let us increase the lot size to 0.1, decrease the initial deposit to 1000 and conduct a second test using parameters from the optimization result. In order to increase precision of the test, let's change the trade mode OHLC on M1, we get Figure 12:
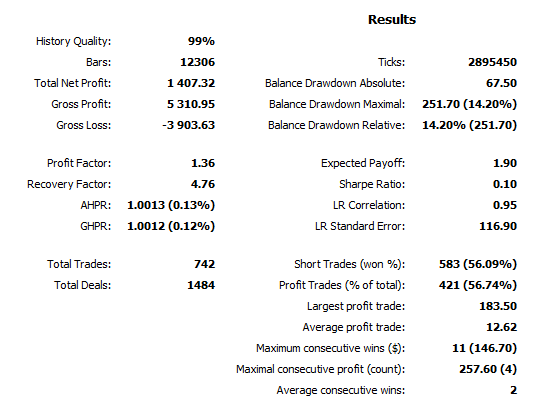
Fig. 12. Test result (backtest)
As a result in two year time 742 trades were made (about 3 trades per day), while the maximum drawdown was 252, and the net profit — 1407, about 60 (6% of total investments) per month. In theory everything works out quite nicely, but there's no guarantee it would turn out just as nicely in practice.
Of course this expert need further modernization and improvement, perhaps an introduction of an additional spindle to the pattern and addition of the VR level. This is food for further thought, but even at such small parameters the experts showed some interesting results on this indicator.
When dealing with the indicator, the trading strategy is quite simple — buy when the arrowhead points up and sell when it points down. Rhombus is a kind of Doji, it indicates a reversal. This is clearly seen in Figure 13:
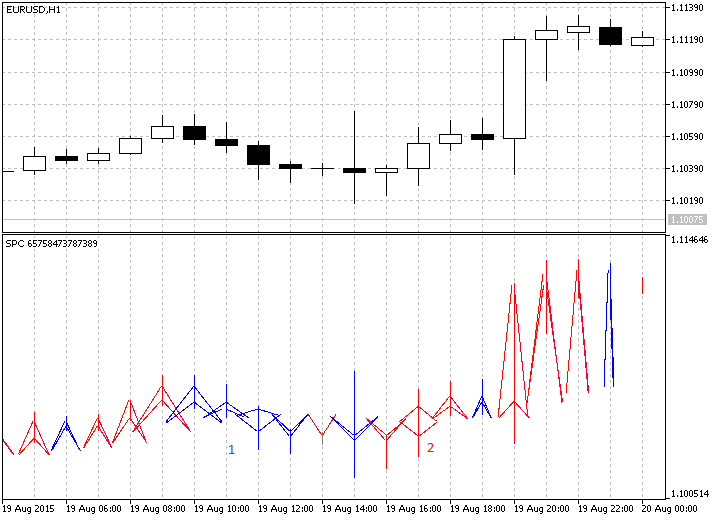
Fig. 13. The indicator in action
As it can be seen on Figure 13, the indicator draws arrowheads pointed up until the number 1, then a blue rhombus occurs, that may indicate a possible change in the trend movement direction. The trend changes, and prices go down until the number 2, after that a red rhombus occurs, that also heralds a change in the trend, and it happens so.
Conclusion
I had little information about the indicator, but it still managed to interest me with its originality. Perhaps the complexity of its implementation in the code which made me think also had an influence. Time was not spent in vain, and I hope that this indicator will be useful to many people. I can assume that the subject is not fully developed yet, as it is quite extensive, but I think this will eventually be taken care of on the forum. Particular attention should be paid to the discussion and modernization of the advisor, even in the initial phase it shows some decent results. I would welcome any comments and discussions both below the article and in private messages.
This was another article on the subject of indicators, if anyone has any ideas on new interesting indicators, write me a private message. I do not promise the implementation, but I will be sure to consider, and perhaps advise something. My next article is supposed to radically change its subject, but I will not get ahead of myself and talk about it, because this is merely an idea, and the code is only at the planning stage.
Translated from Russian by MetaQuotes Ltd.
Original article: https://www.mql5.com/ru/articles/1844
Warning: All rights to these materials are reserved by MetaQuotes Ltd. Copying or reprinting of these materials in whole or in part is prohibited.
This article was written by a user of the site and reflects their personal views. MetaQuotes Ltd is not responsible for the accuracy of the information presented, nor for any consequences resulting from the use of the solutions, strategies or recommendations described.
 Evaluation and selection of variables for machine learning models
 How to Secure Your Expert Advisor While Trading on the Moscow Exchange
- Free trading apps
- Over 8,000 signals for copying
- Economic news for exploring financial markets
You agree to website policy and terms of use
Is the topic dead or has it developed?
I don't do it, I don't have any free time. You could say canned.
Hi! Indicator give error or? You placed folder with images, in true place?
sorry to knock this dead thread again,but where can get more info on the strategy & how it predicts market entry? searched the whole internet but could get much info on "spindle charting" & "how to trade a spindle-chart"
sorry to knock this dead thread again,but where can get more info on the strategy & how it predicts market entry? searched the whole internet but could get much info on "spindle charting" & "how to trade a spindle-chart"
This topic is very new, and there is almost no information on the Internet.
To me the information came from the developer, just from his lips was given to me the site http://www.ncm.lv/. (but even there is not much information, but there are contacts of the developer)
The article was written for discussion. And the possible further development of this schedule and strategy.
Great! If you implement all this for NinjaTrader, and apply footprint, it would be worth it!!! sorry it's all up(((