
Moving Average in MQL5 from scratch: Plain and simple

Contents
- Introduction
- Simple Moving Average (SMA)
- Exponential Moving Average (EMA)
- Smoothed Moving Average (SMMA)
- Linear Weighted Moving Average (LWMA)
- Conclusion
Introduction
The moving average is the average price of a currency pair over a certain period of time, expressed in a number of bars. It is one of the oldest technical indicators and perhaps the most popular and most frequently used, as a huge number of other indicators are built on its basis.
Moving averages are widely used to solve various applied problems. Mathematically, a simple moving average is the usual arithmetic mean of a given series of numerical values. When creating various indicators or scripts and EAs for the MetaTrader 5 terminal, moving averages are used in calculations in one way or another. Moving averages are a simple and quite efficient tool for determining the direction of trends, smoothing out minor price fluctuations (noise), or creating trading strategies based on moving averages and other indicators, widely presented both in the client terminal and on mql5.com.
Interestingly, moving averages are widely used not only in financial markets, but also in other fields, such as meteorology and economics. Some machine learning models also use the concept of moving averages as one of the features for time series forecasting.
Moving averages are a powerful tool that, when used correctly, can greatly improve trading results and data analysis.
Simple Moving Average (SMA)
A simple moving average is calculated as the arithmetic mean of a given number of numerical values, such as the closing prices of bars. At each calculation point, the values of the moving average have the same weight in relation to the neighboring points of the calculated numerical series. in relation to the SMA indicator, on each bar of the indicator line (N) we see the average value of the bars adjacent to the left (N + N-1 + N-2 + N-3 + Nx) / x, where x is the averaging period (the number of calculated bars).
SMA features:
- A simple calculation method, easy to calculate and understand,
- Due to its simplicity, SMA can lag behind price changes, especially when using long calculation periods,
- Often used in combination with other indicators to confirm signals.

Fig. 1. Simple moving average SMA at Close with the calculation period of 10
Calculation
The calculation of the SMA indicator based on bar closing prices can be expressed as follows:
SMA = SUM(CLOSE(i), N) / N
where:
- SUM — sum;
- CLOSE(i) — current period close price;
- N — number of calculation periods.
In the indicator, the calculation of a simple moving average can be as follows:
double result=0;
for(int j=0; j<period; j++)
   result+=close[i-j];
result/=period;
where:
- result is a variable the result of the SMA calculation is set into
- period — SMA calculation period: the amount of data in the calculated numerical series. Here it stands for the closing prices of the bars
- i — indicator main loop
- j — loop index for calculating the average value of closing prices of bars to the left of the bar with the i index
That is, when calculating the average for the smoothing period of 5, iterate over the loop from the bar with the i index and sum all Close prices of bars with the i-j index (i-0 + i-1 + i-2 + i-3 + i-4).
After summing up all the closing prices of all the bars in the 'period' quantity, divide the result by the period value. As a result, we get the usual arithmetic mean of Close prices for period bars.
The indicator code:
//+------------------------------------------------------------------+
//|                                           SMAonPriceCloseRAW.mq5 |
//|                                  Copyright 2024, MetaQuotes Ltd. |
//|                                             https://www.mql5.com |
//+------------------------------------------------------------------+
#property copyright "Copyright 2024, MetaQuotes Ltd."
#property link      "https://www.mql5.com"
#property version   "1.00"
#property indicator_chart_window
#property indicator_buffers 1
#property indicator_plots   1

//--- plot MA
#property indicator_label1  "SMA"
#property indicator_type1   DRAW_LINE
#property indicator_color1  clrRed
#property indicator_style1  STYLE_SOLID
#property indicator_width1  1

//--- input parameters
input int      InpPeriod   =  10;   // SMA Period

//--- indicator buffers
double         MABuffer[];
//+------------------------------------------------------------------+
//| Custom indicator initialization function                         |
//+------------------------------------------------------------------+
int OnInit()
  {
//--- indicator buffers mapping
   SetIndexBuffer(0,MABuffer,INDICATOR_DATA);

//--- successful initialization
   return(INIT_SUCCEEDED);
  }
//+------------------------------------------------------------------+
//| Custom indicator iteration function                              |
//+------------------------------------------------------------------+
int OnCalculate(const int rates_total,
                const int prev_calculated,
                const datetime &time[],
                const double &open[],
                const double &high[],
                const double &low[],
                const double &close[],
                const long &tick_volume[],
                const long &volume[],
                const int &spread[])
  {
//--- in the loop from the value of InpPeriod to the current history bar
   for(int i=InpPeriod; i<rates_total; i++)
     {
      //--- calculate average close prices for InpPeriod bars
      double result=0;
      for(int j=0; j<InpPeriod; j++)
         result+=close[i-j];
      result/=InpPeriod;

      //--- Write the calculation result to the buffer
      MABuffer[i]=result;
     }
//--- return value of prev_calculated for the next call
   return(rates_total);
  }
This is the simplest indicator that allows you to see on the chart the average Close price values for the period specified in the settings for each bar of history (InpPeriod). The values are displayed as a line on the price chart.
To calculate the average price for a specified number of bars, we need to sum the required number of Close prices in a loop from the current bar (also in a loop) and divide the resulting sum by the number of bars, within which the arithmetic mean is sought.
Thus, going in a loop from the beginning of history, for each bar of the i loop, we calculate the average value of the closing prices of the bars on the left in the j loop. This is why the main loop does not start from zero, but from the value of the number of bars, for which we calculate the average - so that the required number of bars is on the left at the very beginning of the SMA calculation.
Above we looked at the simplest and mostly non-optimal code, which shows the calculation of a simple moving average. This construction of the indicator loop forces it to recalculate the entire history again, while performing another loop of calculating average prices on each bar. With the calculation presented above, sooner or later (but most likely sooner), we will receive the following message in the log:
indicator is too slow, 66141 ms. rewrite the indicator, please
Naturally, it needs to be optimized. First of all, we should implement a more resource-saving calculation of the indicator.
The SMAonPriceCloseRAW.mq5 indicator file can be found in the files attached to the article.
Optimization of calculations
A resource-saving calculation of the indicator means the following sequence of calculations:
- When the indicator is first launched (or when there are any changes in the symbol history), a full calculation of the indicator is performed for the entire available history.
- After the full calculation, all calculated data will be drawn on the chart, and now we need to calculate and change the data on each new tick only for the current bar.
The indicator calculation starts when the Calculate event is received. The OnCalculate() event handler is called.
This usually happens when a new tick is received for the symbol the indicator is calculated for.
There are two options for defining the OnCalculate() handler. Both function options cannot be used within one indicator.
The first form of call is intended for the indicators that can be calculated on a single data buffer.
int OnCalculate (const int rates_total,      // price[] array size
                 const int prev_calculated,  // handled bars at the previous call
                 const int begin,            // where significant data starts
                 const double& price[]       // array for calculation
   );
One of the price timeseries or a calculated buffer of some indicator can be passed as the price[] array.
A necessary timeseries or indicator is selected by a user as the price[] array in the Parameters tab when launching the indicator.
The second form of call is intended for all other indicators that use more than one time series for calculation.
int OnCalculate (const int rates_total,      // size of input time series
                 const int prev_calculated,  // handled bars at the previous call
                 const datetime& time[],     // Time
                 const double& open[],       // Open
                 const double& high[],       // High
                 const double& low[],        // Low
                 const double& close[],      // Close
                 const long& tick_volume[],  // Tick Volume
                 const long& volume[],       // Real Volume
                 const int& spread[]         // Spread
   );
- The open[], high[], low[] and close[] parameters contain arrays with the opening, high, low and close prices of the current timeframe.
- The time[] parameter contains an array with opening time values.
- The spread[] parameter is an array containing the spread history (if a spread is provided for this trading instrument).
- The volume[] and tick_volume[] parameters contain the history of trading and tick volumes, respectively.
- The rates_total parameter contains the number of bars available for the indicator to calculate and corresponds to the number of bars available on the chart.
- When the function is called, the prev_calculated parameter contains the value returned by the OnCalculate() function during the previous call. This makes it possible to implement resource-saving algorithms for calculating a custom indicator in order to avoid repetitive calculations for the bars that have not changed since the previous launch of this function. To do this, it is usually sufficient to return the value of the rates_total parameter, which contains the number of bars in the current function call. If the price data have been changed since the last call of the OnCalculate() function (a deeper history has been loaded or gaps in the history have been filled), the value of the prev_calculated input parameter is set to zero by the terminal itself.
As we can see, we need the value of the prev_calculated variable to arrange a resource-saving calculation. At the first launch, or change of historical data, this variable will contain a zero value. We can manage it to arrange a full calculation of the indicator during the first launch and the calculation of only the current bar after the entire indicator has been calculated and the values for the entire history have been written to its buffer.
Since the indicator loop goes through historical data, starting from a certain number and up to the rates_total-1 value, then, knowing how many bars were calculated at the last run of the indicator (the value is stored in the prev_calculated value), we can control the value to start the calculation loop from.
Suppose this is the start variable, which is to contain the index of the bar the indicator loop should be started from. On the first run, the prev_calculated variable will store zero. This means we can start a loop from zero to the number of bars of the instrument the indicator is running on.
But there is a caveat here: to calculate the value of the moving average, we should loop back to the beginning of the history from the current bar of the loop and calculate the average price value. But if we start the main loop from zero, then there is nothing to the left of the zero bar (the beginning of the historical data), and we will not be able to get the values of the missing bars of history. Therefore, the main loop should be started with an offset from the beginning of the history by the number of bars required to calculate the average. this is the indicator calculation period (for example, Period).
Setting the number of bars calculated to the start variable should look like this:
//--- If this is the first run or a change in historical data
   if(prev_calculated==0)
     {
      //--- initialize the indicator buffer with an empty value and
      //--- set the start of the calculation to the Period value
      ArrayInitialize(MABuffer,EMPTY_VALUE);
      start=Period;
     }
//--- If this is not the first run, the calculation will start at the current bar
   else
      start=prev_calculated-1;
When the indicator is first started, an initialization value is first written to its buffer. Here it is EMPTY_VALUE — empty value of the indicator buffer that does not participate in rendering. After that, the index of the bar the main loop of the indicator begins from is set to the 'start' variable. If this is not the first launch of the indicator, then the prev_calculated variable contains the number of bars already calculated in the previous call of the OnCalculate() handler. Therefore, in this case, we set the index of the current bar as the bar the loop begins from. In most cases, this is prev_calculated-1.
Since some value is returned from the OnCalculate() handler (usually rates_total), we can regulate the number of bars that need to be calculated on the next call to the handler. If we return the number of calculated bars stored in rates_total, then on the next call to OnCalculate, this value will be written to the prev_calculated variable. Accordingly, if we specify the bar number for the start of the loop as prev_calculated-1, then on the current bar this will be the index of the current bar, and when opening a new bar, this will be the index of the previous bar. This way we specify the bar index to start the loop:
- at the first launch - from the value of the indicator calculation period
- at the opening of a new bar — from the previous bar (the previous and current bar are calculated)
- on the current bar, we calculate one current bar on each new tick
Let's look at the full indicator code:
//+------------------------------------------------------------------+
//|                                           SMAonPriceCloseECO.mq5 |
//|                                  Copyright 2024, MetaQuotes Ltd. |
//|                                             https://www.mql5.com |
//+------------------------------------------------------------------+
#property copyright "Copyright 2024, MetaQuotes Ltd."
#property link      "https://www.mql5.com"
#property version   "1.00"
#property indicator_chart_window
#property indicator_buffers 1
#property indicator_plots   1

//--- plot MA
#property indicator_label1  "SMA"
#property indicator_type1   DRAW_LINE
#property indicator_color1  clrRed
#property indicator_style1  STYLE_SOLID
#property indicator_width1  1

//--- input parameters
input int      InpPeriod   =  10;   // SMA Period

//--- indicator buffers
double         MABuffer[];

//--- global variables
int   ExtPeriod;  // SMA calculation period
//+------------------------------------------------------------------+
//| Custom indicator initialization function                         |
//+------------------------------------------------------------------+
int OnInit()
  {
//--- indicator buffers mapping
   SetIndexBuffer(0,MABuffer,INDICATOR_DATA);

//--- successful initialization
   return(INIT_SUCCEEDED);
  }
//+------------------------------------------------------------------+
//| Custom indicator iteration function                              |
//+------------------------------------------------------------------+
int OnCalculate(const int rates_total,
                const int prev_calculated,
                const datetime &time[],
                const double &open[],
                const double &high[],
                const double &low[],
                const double &close[],
                const long &tick_volume[],
                const long &volume[],
                const int &spread[])
  {
//--- Adjust the entered value of the SMA calculation period
   ExtPeriod=(InpPeriod<1 ? 10 : InpPeriod);

//--- If there is not enough historical data for calculation, return 0
   if(rates_total<ExtPeriod)
      return 0;

   int start=0;   // calculation start bar

//--- If this is the first run or a change in historical data
   if(prev_calculated==0)
     {
      //--- initialize the indicator buffer with an empty value and
      //--- set the start of the calculation to ExtPeriod
      ArrayInitialize(MABuffer,EMPTY_VALUE);
      start=ExtPeriod;
     }
//--- If this is not the first run, the calculation will start at the current bar
   else
      start=prev_calculated-1;

//--- in the loop from the 'start' value to the current history bar
   for(int i=start; i<rates_total; i++)
     {
      //--- calculate average close prices for ExtPeriod bars
      double result=0;
      for(int j=0; j<ExtPeriod; j++)
         result+=close[i-j];
      result/=ExtPeriod;

      //--- Write the calculation result to the buffer
      MABuffer[i]=result;
     }

//--- return the number of bars calculated for the next OnCalculate call
   return(rates_total);
  }
The SMAonPriceCloseECO.mq5 indicator file can be found in the files attached to the article.
Now, when we run the indicator on a symbol chart, we will no longer receive a message that it is too slow. But there is still one optimization issue left: when calculating the indicator on the current bar, the loop of calculating the average price for the Period bars is still performed. Since a simple moving average is simply the sum of some number of bars divided by that number, we can eliminate this loop on the current bar.
Let's see how the SMA indicator in its current version is calculated on history. As an example, we will show the very beginning of the calculation of a simple moving average with the calculation period of 5 bars.
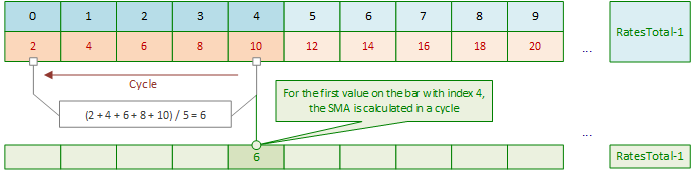
When launching, the indicator calculation starts not from the zero bar, but from the bar equal to (the number of bars in the SMA calculation period) - 1:
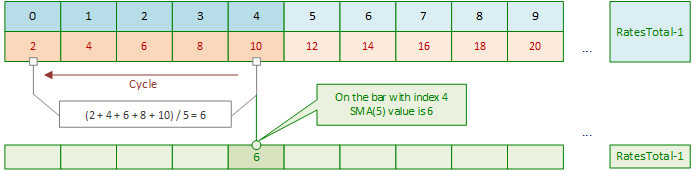
The main loop starts at the bar having the index of 4. To calculate the SMA value on this bar, a loop is performed on bars with indices 4, 3, 2, 1 and 0. The price values on these bars are added up, and then the resulting sum is divided by the number of SMA calculation periods - here it is 5. To simplify the calculations, the figure shows simple integer values 2, 4, 6, 8 and 10 on the corresponding bars as the bar price values. As a result, on the bar with index 4, the SMA value is 6 = (2+4+6+8+10)/5.
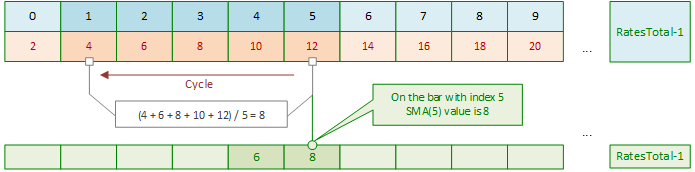
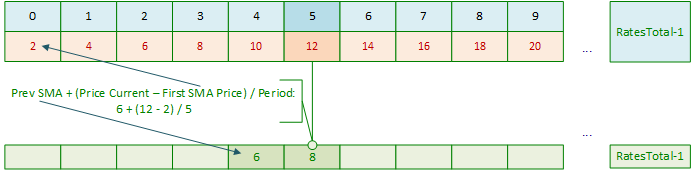
After shifting the index of the main SMA calculation loop, the SMA value for the next bar with the index 5 is calculated again in the loop:
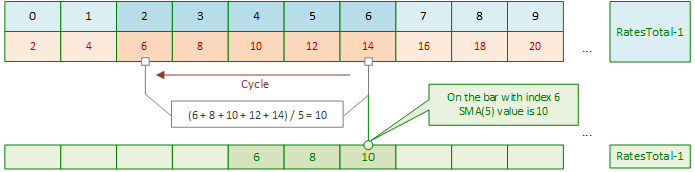
In the next iteration of the main loop, the SMA is calculated for the bar with the index 6 in the inner loop again:
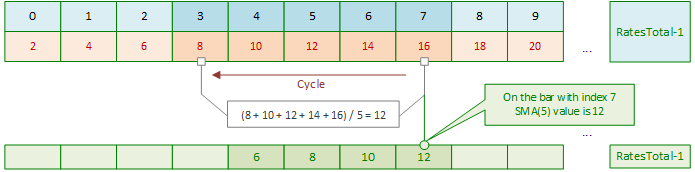
Next, we repeat the same pattern - SMA values are calculated in the internal loops for each subsequent bar at each subsequent shift of the main loop index.
And so on, until the main loop reaches the current bar:
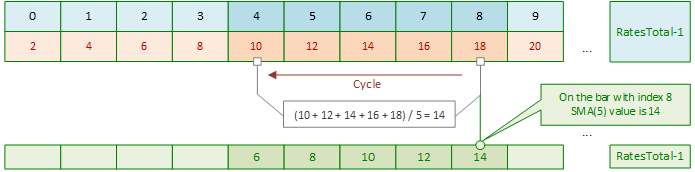
Then, when calculating the SMA on the current bar, with the arrival of each subsequent tick, an internal loop will be executed to calculate the SMA on the current bar.
What is SMA? This is the arithmetic mean of prices for a certain period. We already know that to calculate the SMA value on one bar, we need to divide the sum of the previous Period prices by the calculation Period. When launching the indicator, we can calculate the very first SMA value by adding the previous Period prices in the loop and dividing this sum by the Period. And now, when shifting the sliding window for calculating SMA to the right, it is no longer necessary to add up previous prices in the loop and divide by their Period number since we already have the calculated SMA value on the previous bar.
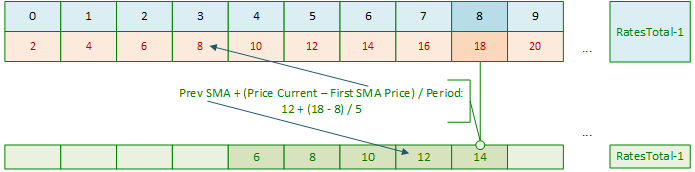
It is sufficient to subtract from this value the very first price of those involved in calculating the average value and add the current price to the result, preliminarily dividing them by Period. All is set. In other words, the very first SMA bar is calculated by adding the prices in the Period loop and dividing the result of the addition by the Period value. Then we only have the arithmetic operations of addition, subtraction and division:
Calculation of the first SMA value:
Next, when shifting the index of the main loop, we simply do the calculation:
Repeat with the new data:
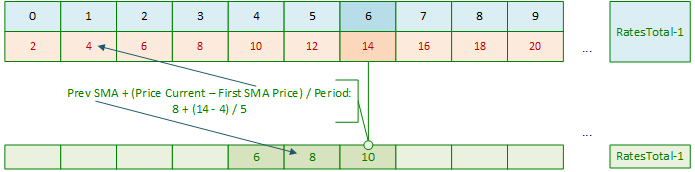
And at each offset of the main loop index
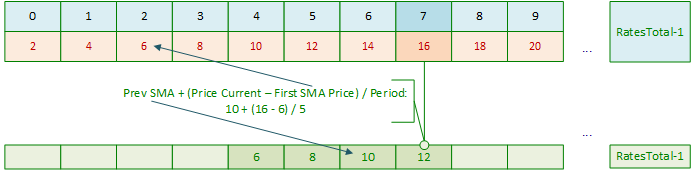
Each time we get a new SMA value from the previously calculated one
Let's consider the following indicator:
//+------------------------------------------------------------------+
//|                                              SMAonPriceClose.mq5 |
//|                                  Copyright 2024, MetaQuotes Ltd. |
//|                                             https://www.mql5.com |
//+------------------------------------------------------------------+
#property copyright "Copyright 2024, MetaQuotes Ltd."
#property link      "https://www.mql5.com"
#property version   "1.00"
#property indicator_chart_window
#property indicator_buffers 1
#property indicator_plots   1

//--- plot MA
#property indicator_label1  "SMA"
#property indicator_type1   DRAW_LINE
#property indicator_color1  clrRed
#property indicator_style1  STYLE_SOLID
#property indicator_width1  1

//--- input parameters
input int      InpPeriod   =  10;   // SMA Period

//--- indicator buffers
double         MABuffer[];

//--- global variables
int   ExtPeriod;  // SMA calculation period
//+------------------------------------------------------------------+
//| Custom indicator initialization function                         |
//+------------------------------------------------------------------+
int OnInit()
  {
//--- indicator buffers mapping
   SetIndexBuffer(0,MABuffer,INDICATOR_DATA);

//--- successful initialization
   return(INIT_SUCCEEDED);
  }
//+------------------------------------------------------------------+
//| Custom indicator iteration function                              |
//+------------------------------------------------------------------+
int OnCalculate(const int rates_total,
                const int prev_calculated,
                const datetime &time[],
                const double &open[],
                const double &high[],
                const double &low[],
                const double &close[],
                const long &tick_volume[],
                const long &volume[],
                const int &spread[])
  {
//--- Adjust the entered value of the SMA calculation period
   ExtPeriod=(InpPeriod<1 ? 10 : InpPeriod);

//--- If there is not enough historical data for calculation, return 0
   if(rates_total<ExtPeriod)
      return 0;

   int start=0;   // calculation start bar

//--- If this is the first run or a change in historical data
   if(prev_calculated==0)
     {
      //--- initialize the indicator buffer with an empty value,
      //--- set the start of the calculation to ExtPeriod and
      //--- calculate average close prices for ExtPeriod bars for the first SMA value on the start-1 bar
      ArrayInitialize(MABuffer,EMPTY_VALUE);
      start=ExtPeriod;
      double value=0;
      for(int i=0; i<start; i++)
         value+=close[i];
      MABuffer[start-1]=value/ExtPeriod;
     }
//--- If this is not the first run, the calculation will start at the current bar
   else
      start=prev_calculated-1;

//--- in the loop from the 'start' value to the current history bar
   for(int i=start; i<rates_total; i++)
     {
      //--- define prices for calculating SMA
      double ma_prev=MABuffer[i-1];             // Previous calculated SMA value
      double price_first=close[i-ExtPeriod];    // Close price ExtPeriod bars ago
      //--- Set the current SMA value to the buffer calculated as
      //--- (past SMA value + (current close price - close price ExtPeriod bars ago) / SMA ExtPeriod calculation period)
      MABuffer[i]=ma_prev+(close[i]-price_first)/ExtPeriod;
     }

//--- return the number of bars calculated for the next OnCalculate call
   return(rates_total);
  }
We can launch the indicator on a chart and compare it with the standard SMA, having previously set the same calculation periods for them. This indicator uses one loop having the length of the MA Period calculation period at startup, and then, during the first launch in the main loop, it calculates the SMA values based on the very first calculated SMA value for the entire history of the instrument. On the current bar, it performs a mathematical calculation of the SMA value for each current tick.
Find the SMAonPriceClose.mq5 indicator file below.
Exponential Moving Average (EMA)
Exponentially smoothed moving average is calculated by adding of a certain share of the current closing price to the previous value of the calculated moving average. With exponentially smoothed moving averages, the latest close prices are of more value. When calculating EMA, the price weights of the bars involved in the calculation decrease exponentially at a rate specified by the k smoothing constant (1 > k > 0). Most often, k is calculated based on the moving average calculation period: k = 2.0 / (N + 1), where N is the number of calculation periods.
EMA:
- Reacts faster to price changes, making it preferable for short-term trading,
- More effective in identifying trends, as well as Buy and Sell signals, as it takes into account fresh data,
- Often used at crossovers with other EMAs (for example, 50 and 200) to determine buy or sell points.

Fig. 2. Exponential Moving Average. EMA at Close with the calculation period of 10
Calculation
P-percent exponential moving average will look like:
EMA = (CLOSE(i) * P) + (EMA(i - 1) * (1 - P))
where:
- CLOSE(i) — current period close price;
- EMA(i - 1) — value of the Moving Average of the previous period;
- P — percentage of using the price value (smoothing constant).
Let's write a simple indicator that shows the calculation of the exponential moving average:
//+------------------------------------------------------------------+
//|                                           EMAonPriceCloseRAW.mq5 |
//|                                  Copyright 2024, MetaQuotes Ltd. |
//|                                             https://www.mql5.com |
//+------------------------------------------------------------------+
#property copyright "Copyright 2024, MetaQuotes Ltd."
#property link      "https://www.mql5.com"
#property version   "1.00"
#property indicator_chart_window
#property indicator_buffers 1
#property indicator_plots   1
//--- plot MA
#property indicator_label1  "EMA"
#property indicator_type1   DRAW_LINE
#property indicator_color1  clrRed
#property indicator_style1  STYLE_SOLID
#property indicator_width1  1

//--- input parameters
input int      InpPeriod   =  10;   // EMA Period

//--- indicator buffers
double         MABuffer[];
//+------------------------------------------------------------------+
//| Custom indicator initialization function                         |
//+------------------------------------------------------------------+
int OnInit()
  {
//--- indicator buffers mapping
   SetIndexBuffer(0,MABuffer,INDICATOR_DATA);

//--- successful initialization
   return(INIT_SUCCEEDED);
  }
//+------------------------------------------------------------------+
//| Custom indicator iteration function                              |
//+------------------------------------------------------------------+
int OnCalculate(const int rates_total,
                const int prev_calculated,
                const datetime &time[],
                const double &open[],
                const double &high[],
                const double &low[],
                const double &close[],
                const long &tick_volume[],
                const long &volume[],
                const int &spread[])
  {
//--- in the loop from zero (the beginning of history) to the current bar
   for(int i=0; i<rates_total; i++)
     {
      double result=0;
      double smf=2.0/(InpPeriod+1.0);                       // smoothing factor
      double prev_value=(i>=1 ? MABuffer[i-1] : close[i]);  // previous calculated EMA value

      //--- calculate EMA based on the Close price of the bar, the previous EMA value and the smoothing factor
      result=close[i]*smf+prev_value*(1-smf);

      //--- Write the calculation result to the buffer
      MABuffer[i]=result;
     }
//--- return value of prev_calculated for the next call
   return(rates_total);
  }
Just like for the simple moving average, here is shown the calculation of the EMA without any checks on the inputs as the calculation period and the organization of the resource-saving indicator calculation. When first launched, the indicator calculates the entire available history, and then it recalculates the entire history again at each tick. This inevitably causes the message that the indicator is too slow.
Find the EMAonPriceCloseRAW.mq5 indicator in the attachments.
Optimization of calculations
Let's implement a resource-saving indicator calculation. During the first launch, it will calculate the entire history, and then it will recalculate only the current bar on each new tick:
//+------------------------------------------------------------------+
//|                                              EMAonPriceClose.mq5 |
//|                                  Copyright 2024, MetaQuotes Ltd. |
//|                                             https://www.mql5.com |
//+------------------------------------------------------------------+
#property copyright "Copyright 2024, MetaQuotes Ltd."
#property link      "https://www.mql5.com"
#property version   "1.00"
#property indicator_chart_window
#property indicator_buffers 1
#property indicator_plots   1
//--- plot MA
#property indicator_label1  "EMA"
#property indicator_type1   DRAW_LINE
#property indicator_color1  clrRed
#property indicator_style1  STYLE_SOLID
#property indicator_width1  1

//--- input parameters
input int      InpPeriod   =  10;   // EMA Period

//--- indicator buffers
double         MABuffer[];

//--- global variables
int   ExtPeriod;  // EMA calculation period
//+------------------------------------------------------------------+
//| Custom indicator initialization function                         |
//+------------------------------------------------------------------+
int OnInit()
  {
//--- indicator buffers mapping
   SetIndexBuffer(0,MABuffer,INDICATOR_DATA);

//--- successful initialization
   return(INIT_SUCCEEDED);
  }
//+------------------------------------------------------------------+
//| Custom indicator iteration function                              |
//+------------------------------------------------------------------+
int OnCalculate(const int rates_total,
                const int prev_calculated,
                const datetime &time[],
                const double &open[],
                const double &high[],
                const double &low[],
                const double &close[],
                const long &tick_volume[],
                const long &volume[],
                const int &spread[])
  {
//--- Adjust the entered value of the EMA calculation period
   ExtPeriod=(InpPeriod<1 ? 10 : InpPeriod);

//--- If there is not enough historical data for calculation, return 0
   if(rates_total<ExtPeriod)
      return 0;

   int start=0;   // calculation start bar

//--- If this is the first run or a change in historical data
   if(prev_calculated==0)
     {
      //--- initialize the indicator buffer with an empty value and set the start of the calculation to 0
      ArrayInitialize(MABuffer,EMPTY_VALUE);
      start=0;
     }
//--- If this is not the first run, the calculation will start at the current bar
   else
      start=prev_calculated-1;

//--- in the loop from the 'start' value to the current history bar
   for(int i=start; i<rates_total; i++)
     {
      double result=0;
      double smf=2.0/(ExtPeriod+1.0);                       // smoothing factor
      double prev_value=(i>=1 ? MABuffer[i-1] : close[i]);  // previous calculated EMA value

      //--- calculate the EMA value for the current loop bar
      result=close[i]*smf+prev_value*(1-smf);

      //--- Write the calculation result to the buffer
      MABuffer[i]=result;
     }

//--- return the number of bars calculated for the next OnCalculate call
   return(rates_total);
  }
If the entered value of the calculated period is less than 1, then we set the default value for moving averages equal to 10.
The Exponential Moving Average calculation uses the previously calculated EMA value on the previous bar.
During the first launch, such a calculation was not yet performed, so we use the price value Close as the primary data .
This indicator implements resource-saving data calculation: at the first launch, all available history is calculated, and on subsequent OnCalculate() calls, only the current bar is calculated.
Find the EMAonPriceClose.mq5 indicator file below.
Smoothed Moving Average (SMMA)
The smoothed moving average, unlike the simple one, has less sensitivity to price fluctuations, placing more emphasis on the overall direction of the price movement.
SMMA:
- Less prone to fluctuations than SMA and EMA, which makes it useful for analyzing more stable trends,
- Well suited for long-term analysis, as it smooths out sharp price fluctuations,
- Can be used to generate more reliable trading signals.
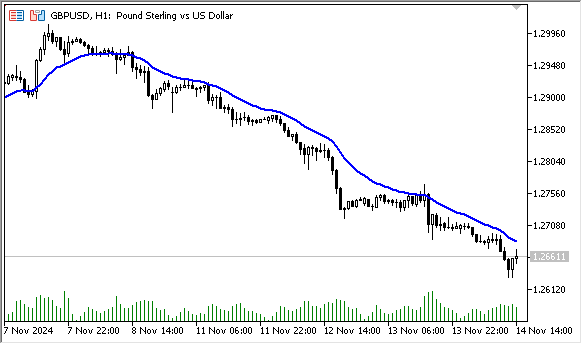
Fig. 3. Smoothed moving average. SMMA at Close with the calculation period of 10
Calculation
The first value of this smoothed moving average is calculated as the simple moving average (SMA):
SUM1  = SUM(CLOSE(i), N)
SMMA1 = SUM1 / N
The second moving average is calculated according to this formula:
SMMA(i) = (SMMA1*(N-1) + CLOSE(i)) / N All subsequent values of the moving average are calculated using the following equation:
PREVSUM = SMMA(i - 1) * N
SMMA(i) =(PREVSUM - SMMA(i - 1) + CLOSE(i)) / N
where:
- SUM — sum;
- SUM1 — total sum of the close prices for N periods starting from the previous bar;
- PREVSUM — smoothed sum of the previous bar;
- SMMA(i-1) — smoothed moving average of the previous bar;
- SMMA(i) — smoothed moving average of the current bar (except for the first bar);
- CLOSE(i) — current close price;
- N — smoothing period.
The formula can be simplified by applying arithmetic transformation:
SMMA(i) = (SMMA(i - 1) * (N - 1) + CLOSE(i)) / N
Let's write a simple indicator that calculates a smoothed moving average:
//+------------------------------------------------------------------+
//|                                          SMMAonPriceCloseRAW.mq5 |
//|                                  Copyright 2024, MetaQuotes Ltd. |
//|                                             https://www.mql5.com |
//+------------------------------------------------------------------+
#property copyright "Copyright 2024, MetaQuotes Ltd."
#property link      "https://www.mql5.com"
#property version   "1.00"
#property indicator_chart_window
#property indicator_buffers 1
#property indicator_plots   1

//--- plot MA
#property indicator_label1  "SMMA"
#property indicator_type1   DRAW_LINE
#property indicator_color1  clrRed
#property indicator_style1  STYLE_SOLID
#property indicator_width1  1

//--- input parameters
input int      InpPeriod=10;  // SMMA Period

//--- indicator buffers
double         MABuffer[];
//+------------------------------------------------------------------+
//| Custom indicator initialization function                         |
//+------------------------------------------------------------------+
int OnInit()
  {
//--- indicator buffers mapping
   SetIndexBuffer(0,MABuffer,INDICATOR_DATA);

//---
   return(INIT_SUCCEEDED);
  }
//+------------------------------------------------------------------+
//| Custom indicator iteration function                              |
//+------------------------------------------------------------------+
int OnCalculate(const int rates_total,
                const int prev_calculated,
                const datetime &time[],
                const double &open[],
                const double &high[],
                const double &low[],
                const double &close[],
                const long &tick_volume[],
                const long &volume[],
                const int &spread[])
  {
//---
   double result=0.0;
   for(int i=InpPeriod-1; i<rates_total; i++)
     {
      //--- first calculation
      if(i==InpPeriod-1)
        {
         //--- calculate a simple moving average for the InpPeriod first bars
         for(int j=0; j<InpPeriod; j++)
           {
            double price=close[i-j];
            result+=price;
           }
         result/=InpPeriod;
         //--- write the first displayed SMMA value calculated as SMA
         MABuffer[InpPeriod-1]=result;
        }
      //--- all subsequent calculations
      else
         result=(MABuffer[i-1]*(InpPeriod-1)+close[i])/InpPeriod;

      //--- Write the calculation result to the buffer
      MABuffer[i]=result;
     }
//--- return value of prev_calculated for the next call
   return(rates_total);
  }
The indicator only displays the SMMA calculation, at the first launch and on each new tick, fully calculating all the bars on the entire available history. This is not optimal and incorrect, as the indicator will be too slow. We should optimize the calculation.
Optimization of calculations
We need to control the input value of the SMMA calculation period, a full calculation of the entire history at the first launch, and then perform the calculation only on the current bar on each new tick:
//+------------------------------------------------------------------+
//|                                             SMMAonPriceClose.mq5 |
//|                                  Copyright 2024, MetaQuotes Ltd. |
//|                                             https://www.mql5.com |
//+------------------------------------------------------------------+
#property copyright "Copyright 2024, MetaQuotes Ltd."
#property link      "https://www.mql5.com"
#property version   "1.00"
#property indicator_chart_window
#property indicator_buffers 1
#property indicator_plots   1
//--- plot MA
#property indicator_label1  "SMMA"
#property indicator_type1   DRAW_LINE
#property indicator_color1  clrRed
#property indicator_style1  STYLE_SOLID
#property indicator_width1  1

//--- input parameters
input int      InpPeriod=10;

//--- indicator buffers
double         MABuffer[];

//--- global variables
int   ExtPeriod;  // SMMA calculation period
//+------------------------------------------------------------------+
//| Custom indicator initialization function                         |
//+------------------------------------------------------------------+
int OnInit()
  {
//--- indicator buffers mapping
   SetIndexBuffer(0,MABuffer,INDICATOR_DATA);

//--- successful initialization
   return(INIT_SUCCEEDED);
  }
//+------------------------------------------------------------------+
//| Custom indicator iteration function                              |
//+------------------------------------------------------------------+
int OnCalculate(const int rates_total,
                const int prev_calculated,
                const datetime &time[],
                const double &open[],
                const double &high[],
                const double &low[],
                const double &close[],
                const long &tick_volume[],
                const long &volume[],
                const int &spread[])
  {
//--- Adjust the entered value of the SMMA calculation period
   ExtPeriod=(InpPeriod<1 ? 10 : InpPeriod);

//--- If there is not enough historical data for calculation, return 0
   if(rates_total<ExtPeriod)
      return 0;

   double result=0;
   int    start =0;

//--- If this is the first run or a change in historical data
   if(prev_calculated==0)
     {
      //--- initialize the indicator buffer with an empty value and set the start of the calculation to ExtPeriod
      ArrayInitialize(MABuffer,EMPTY_VALUE);
      start=ExtPeriod;

      //--- calculate a simple moving average for the ExtPeriod first bars
      for(int i=0; i<start; i++)
         result+=close[i];
      result/=ExtPeriod;
      //--- write the first displayed SMMA value calculated as SMA
      MABuffer[start-1]=result;
     }
   else
      start=prev_calculated-1;

//--- in the loop from the 'start' value to the current history bar
//--- calculate the SMMA value for the loop current bar
   for(int i=start; i<rates_total; i++)
      MABuffer[i]=(MABuffer[i-1]*(ExtPeriod-1)+close[i])/ExtPeriod;

//--- return the number of bars calculated for the next OnCalculate call
   return(rates_total);
  }
Now the indicator will economically calculate the history and the current bar. Find the SMMAonPriceClose.mq5 indicator file below.
Linear Weighted Moving Average (LWMA)
In the case of weighted moving average, the latest data is of more value than more early data. This allows LWMA to be more sensitive to recent price changes. In this moving average, the weight of bar prices decreases linearly - for the zero (current) bar it is maximum, for the bar with the number of N-1 it is equal to 0.
LWMA:
- Reacts more actively to price changes compared to traditional SMA,
- Allows you to analyze data in such a way that the latest changes have the greatest impact on calculations,
- Can be used to create various trading strategies, especially in high volatility conditions.
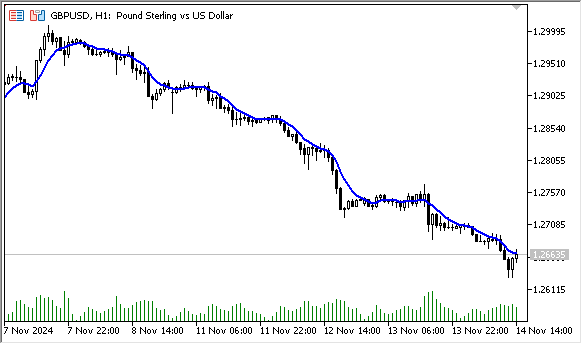
Fig. 4. Linear Weighted Moving Average LWMA at Close with the calculation period of 10
Calculation
Weighted moving average is calculated by multiplying each one of the closing prices within the considered series, by a certain weight coefficient:
LWMA = SUM(CLOSE(i) * i, N) / SUM(i, N)
where:
- SUM — sum;
- CLOSE(i) — current close price;
- SUM(i, N) — sum of weight coefficients;
- N — smoothing period.
Let's write a simple indicator that shows the calculation of the linear weighted moving average:
//+------------------------------------------------------------------+
//|                                          LWMAonPriceCloseRAW.mq5 |
//|                                  Copyright 2024, MetaQuotes Ltd. |
//|                                             https://www.mql5.com |
//+------------------------------------------------------------------+
#property copyright "Copyright 2024, MetaQuotes Ltd."
#property link      "https://www.mql5.com"
#property version   "1.00"
#property indicator_chart_window
#property indicator_buffers 1
#property indicator_plots   1
//--- plot MA
#property indicator_label1  "LWMA"
#property indicator_type1   DRAW_LINE
#property indicator_color1  clrRed
#property indicator_style1  STYLE_SOLID
#property indicator_width1  1
//--- input parameters
input int      InpPeriod=10;  // LWMA Period
//--- indicator buffers
double         MABuffer[];
//+------------------------------------------------------------------+
//| Custom indicator initialization function                         |
//+------------------------------------------------------------------+
int OnInit()
  {
//--- indicator buffers mapping
   SetIndexBuffer(0,MABuffer,INDICATOR_DATA);

//---
   return(INIT_SUCCEEDED);
  }
//+------------------------------------------------------------------+
//| Custom indicator iteration function                              |
//+------------------------------------------------------------------+
int OnCalculate(const int rates_total,
                const int prev_calculated,
                const datetime &time[],
                const double &open[],
                const double &high[],
                const double &low[],
                const double &close[],
                const long &tick_volume[],
                const long &volume[],
                const int &spread[])
  {
//--- in the loop from InpPeriod-1 to the current bar
   double result=0.0;
   for(int i=InpPeriod-1; i<rates_total; i++)
     {
      //--- calculate weights (wsum) and the sum of weight coefficients (sum) of InpPeriod bars
      double sum =0.0;
      int    wsum=0;
      for(int j=InpPeriod; j>0; j--)
        {
         wsum+=j;
         sum +=close[i-j+1]*(InpPeriod-j+1);
        }
      //--- get the LWMA value for the current bar of the loop
      result=sum/wsum;
      //--- Write the calculation result to the buffer
      MABuffer[i]=result;
     }
//--- return value of prev_calculated for the next call
   return(rates_total);
  }
The indicator displays the result of the LWMA calculation for each bar in history on the chart. A complete recalculation of all historical data occurs at each new tick. This is a very slow and sub-optimal calculation. We will optimize it by performing a resource-saving calculation of the indicator and adding a check of the entered inputs.
THe LWMAonPriceCloseRAW.mq5 indicator file can be found in the files attached to the article.
Optimization of calculations
Optimize the indicator calculation so that the entire history is not recalculated on each tick, and add a check for the entered value of the LWMA calculation period:
//+------------------------------------------------------------------+
//|                                             LWMAonPriceClose.mq5 |
//|                                  Copyright 2024, MetaQuotes Ltd. |
//|                                             https://www.mql5.com |
//+------------------------------------------------------------------+
#property copyright "Copyright 2024, MetaQuotes Ltd."
#property link      "https://www.mql5.com"
#property version   "1.00"
#property indicator_chart_window
#property indicator_buffers 1
#property indicator_plots   1
//--- plot MA
#property indicator_label1  "LWMA"
#property indicator_type1   DRAW_LINE
#property indicator_color1  clrRed
#property indicator_style1  STYLE_SOLID
#property indicator_width1  1

//--- input parameters
input int      InpPeriod   =  10;   // LWMA Period

//--- indicator buffers
double         MABuffer[];

//--- global variables
int   ExtPeriod;  // LWMA calculation period
//+------------------------------------------------------------------+
//| Custom indicator initialization function                         |
//+------------------------------------------------------------------+
int OnInit()
  {
//--- indicator buffers mapping
   SetIndexBuffer(0,MABuffer,INDICATOR_DATA);

//--- successful initialization
   return(INIT_SUCCEEDED);
  }
//+------------------------------------------------------------------+
//| Custom indicator iteration function                              |
//+------------------------------------------------------------------+
int OnCalculate(const int rates_total,
                const int prev_calculated,
                const datetime &time[],
                const double &open[],
                const double &high[],
                const double &low[],
                const double &close[],
                const long &tick_volume[],
                const long &volume[],
                const int &spread[])
  {
//--- Adjust the entered value of the LWMA calculation period
   ExtPeriod=(InpPeriod<1 ? 10 : InpPeriod);

//--- If there is not enough historical data for calculation, return 0
   if(rates_total<ExtPeriod)
      return 0;

   double result=0;
   int    start =0;

//--- If this is the first run or a change in historical data
   if(prev_calculated==0)
     {
      //--- initialize the indicator buffer with an empty value and set the start of the calculation to ExtPeriod-1
      ArrayInitialize(MABuffer,EMPTY_VALUE);
      start=ExtPeriod-1;
     }
//--- If this is not the first run, the calculation will start at the current bar
   else
      start=prev_calculated-1;

//--- in the loop from the 'start' value to the current history bar
//--- calculate the LWMA value for the loop current bar
   for(int i=start; i<rates_total; i++)
     {
      //--- calculate weights (wsum) and the sum of weight coefficients (sum) of ExtPeriod bars
      double sum =0.0;
      int    wsum=0;
      for(int j=ExtPeriod; j>0; j--)
        {
         wsum+=j;
         sum +=close[i-j+1]*(ExtPeriod-j+1);
        }
      //--- get the LWMA value for the current bar of the loop
      result=sum/wsum;
      //--- Write the calculation result to the buffer
      MABuffer[i]=result;
     }

//--- return the number of bars calculated for the next OnCalculate call
   return(rates_total);
  }
The principles of source-saving calculation of indicators are described in detail in the section about simple moving average optimization.
Find the indicator file below.
Pros and cons of the four types of moving averages
Over time, different types of moving averages have emerged, such as simple, exponential, weighted, and many other moving averages, some using their own unique calculations, others based on SMA, each serving different purposes and can open up new and interesting perspectives on the data being analyzed.
Here is a brief summary of the pros and cons of the four basic moving averages:
- SMA (simple moving average) is often used to determine the general direction of a trend and identify support and resistance levels. Popular among long-term traders and investors as it smooths out price fluctuations, allowing for a better view of the overall trend.
Pros:
- Ease of calculation and interpretation,
- Smooths out price fluctuations, providing a clear view of trends,
- Useful for identifying long-term trends.
Cons:
- Reacts slowly to changes, which can lead to delayed signals,
- Equally sensitive to price fluctuations over the entire range of the calculation period (the weights of all prices are the same).
- EMA (exponential moving average) gives more weight to recent prices, making it more sensitive to new price changes. Used for faster signals to open and close positions. Preferred by short term traders and scalpers looking for quicker entries and exits in the market.
Pros:
- Aimed at a faster response to price changes due to the greater weight given to the latest data.
- Usually used in combination with other indicators for more accurate signals.
- Provides more up-to-date information on the current trend.
Cons:
- May give false signals during sharp market fluctuations.
- More difficult to calculate than SMA.
- SMMA (smoothed moving average) is considered a smoother version of EMA and SMA, which allows to avoid sharp fluctuations while maintaining the relevance of the information. Suitable for traders who want to avoid false signals, convenient for trend analysis and confirmation.
Pros:
- Smoothes data more than SMA and EMA.
- Less prone to fluctuations, which can be useful in volatile markets.
- Stores information about previous values allowing for better trend analysis.
Cons:
- May be slow to react to market changes, similar to SMA.
- There may be delays in detecting trends.
- LWMA (linear weighted moving average) gives different weight to each price value depending on its age, adding weight to newer data. Used for more detailed analysis (for example, in strategies using multiple timeframes), when traders want to react to changes faster.
Pros:
- Gives more weight to recent prices, allowing them to more accurately reflect recent changes.
- More flexible than SMA and EMA, allowing for better response to new data,
- May be useful for short-term strategies.
Cons:
- More difficult to calculate, especially compared to SMA and EMA.
- May also give false signals in volatile markets.
Conclusion
We have reviewed the principles of calculating the main types of moving averages available in the settings of the standard Moving Average indicator in the client terminal. The calculations presented in the article can be used both in indicators with calculation optimization (which is also shown in the article), while the presented codes can be used as an independent calculation of average values of a sequential data set in your programs.
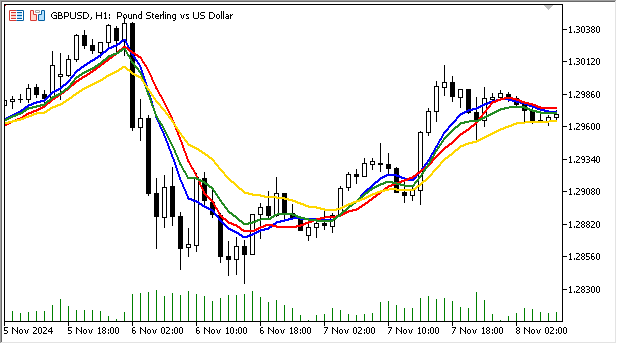
The figure above shows the difference between moving averages with the same calculation period (10), but different types:
Red - SMA, green - EMA, golden - SMMA, blue - LWMA.
It is clear that the smoothed moving average is less susceptible to the influence of small price fluctuations than the others, and displays the general trend of price movement more clearly.
Exponential and linear weighted moving averages are more responsive to market fluctuations because they place the greatest weight on current data in their calculations.
Let's sum it all up:
A moving average (SMA) is a statistical method used to analyze time series and smooth data, which allows identifying trends and short-term directional movements, dynamic support/resistance levels, channel boundaries, etc. The first applications of the moving average concept date back to the early 20th century, when economists and engineers began using it to analyze data and predict future values. Interestingly, in World War II, anti-aircraft gun crews used SMA calculation methods for target designation.
Moving averages became widely used in financial analysis, especially with the development of stock market trading in the mid-20th century. At this time, investors began to look for methods to smooth out fluctuations in stock prices and identify long-term trends. Since then, moving averages have become a standard tool in technical analysis considered both by both traders and analysts.
Moving averages with the same calculation period but different types will display data differently on the same price chart:
- SMA will be smoother and will show the level of support or resistance, but with a delay,
- EMA will follow the prices, staying closer to the price and reacting faster to trend changes,
- SMMA will be a smoother line than SMA, with less reaction to sudden changes,
- LWMA will also react quickly to changes, but its behavior will be more volatile compared to EMA and SMMA.
The choice between these types of moving averages depends on the specific strategy and market conditions. It is important to consider your trading objectives, timeframe, and asset volatility when using moving averages in trading. Traders often combine different types of moving averages to maximize the efficiency of their analysis.
Attached files:
| # | Type | Name | Description |
|---|---|---|---|
| 1 | Indicator | SMAonPriceCloseRAW.mq5 | SMA calculation example. Only rough calculation, no resource-saving calculation, no optimization |
| 2 | Indicator | SMAonPriceCloseECO.mq5 | SMA calculating indicator. Resource-saving indicator calculation, no optimization |
| 3 | Indicator | SMAonPriceClose.mq5 | SMA calculating indicator. Resource-saving indicator calculation with optimization |
| 4 | Indicator | EMAonPriceCloseRAW.mq5 | EMA calculation example. Only rough calculation, no resource-saving calculation |
| 5 | Indicator | EMAonPriceClose.mq5 | EMA calculating indicator. Resource-saving indicator calculation |
| 6 | Indicator | SMMAonPriceCloseRAW.mq5 | SMMA calculation example. Only rough calculation, no resource-saving calculation |
| 7 | Indicator | SMMAonPriceClose.mq5 | SMMA calculating indicator. Resource-saving indicator calculation |
| 8 | Indicator | LWMAonPriceCloseRAW.mq5 | LWMA calculation example. Only rough calculation, no resource-saving calculation |
| 9 | Indicator | LWMAonPriceClose.mq5 | LWMA calculating indicator. Resource-saving indicator calculation |
Translated from Russian by MetaQuotes Ltd.
Original article: https://www.mql5.com/ru/articles/16308
Warning: All rights to these materials are reserved by MetaQuotes Ltd. Copying or reprinting of these materials in whole or in part is prohibited.
This article was written by a user of the site and reflects their personal views. MetaQuotes Ltd is not responsible for the accuracy of the information presented, nor for any consequences resulting from the use of the solutions, strategies or recommendations described.

- Free trading apps
- Over 8,000 signals for copying
- Economic news for exploring financial markets
You agree to website policy and terms of use
Thanks for the good article. But I can't help but criticise it. I'm in such a mood today.
The article pays special attention not so much to coding as to formulas and optimisation of calculations. But I think it will be more useful for novice programmers and those who have recently started to pay attention to the possibility of using different loop operators. I hope that the next articles will reflect this. After all, there are at least 3 loop operators in MQL5. And any of them can be used to build an indicator.
useful information, all at once in one place,
and finally the i++ loop
A good article for beginners to show the code behind the standard 4 MQ averages.
You should also discuss importance of simple optimization and its impact as 99% of the ticks occur between the bar changes. Minimizing the calculations between each bar change will provide much higher efficiency at the cost of a little complexity. Thus by calculating the base values once on the bar change and saving the values will produce significant reductions in calculation time. for example with a SAM the standard calculation for N periods is:
Consider
double sm=0;
for(int bar=0;bar<N;bar++) sum+=Close[CurrentBar-bar];
SMA=sum/N;
versus
static double partialsum;
double sum=0;
On the Bar Change{
partialsum=0;
for(int bar=0;bar<N-1;bar++) partialsum+=Close[CurrentBar-bar];
partialsum/=(N-1);
}
SMA =partialsum +Close[CurrentBar]/N;
If there are 1000 ticks in a bar period and N=10 then this optimization saves about 90,000 calculations of sum+=Close[EndingBar-bar] for each bar. If your chart contains 1,000 bars, then the savings are over 90 Million unneeded calculations. With modern cpus this savings generated by this example are trivial and probably not noticeable, eventually they will add up as your programs get more complex in Expert Advisors.
The importance of manual optimization is that you are developing better programming techniques that will become second nature for you in future projects.
Thank you for your article, but it is not clear why, after using the OnCalculate() function, I can no longer use the OrderSend() transaction function, I do not know how the author solved this problem, I have no choice but to use the indicators in the standard library in the following way: