Price Action Analysis Toolkit Development (Part 38): Tick Buffer VWAP and Short-Window Imbalance Engine

Contents
- Introduction
- In-Depth Overview of the Key Features of the Tool
- Implementation into MQL5
- Outcomes
- Conclusion
Introduction
Most traders quickly learn that price charts don’t tell the whole story. What really moves the market is hidden just beneath the surface—in the order book, where bids and asks reveal who is waiting to buy, who is ready to sell, and where liquidity is stacked. Professional traders use this information every day to pinpoint supply and demand zones, detect imbalances, and anticipate short-term price shifts with remarkable precision.
Retail traders, however, rarely see this picture. Many platforms don’t provide direct access to the order book at all, while others limit it to delayed or incomplete data, often behind an extra paywall. On common retail platforms like MetaTrader 5, transparency depends entirely on the broker, and most traders are left navigating markets without the microstructural insights that professionals take for granted.
The Slippage Tool was built to address this gap. While it doesn’t attempt to replicate a full order book or raw tape, it reconstructs the most actionable insights traders usually extract from market depth—using only tick data that every broker provides. It calculates VWAP (Volume Weighted Average Price) to highlight where activity is clustering, measures short-term order imbalances to capture directional pressure, and aggregates tick volumes to paint a clearer view of recent participation. These metrics are then paired with spread and ATR context to help traders recognize when conditions favor their directional bias.
Displayed directly on the chart with alerts and trade markers, the tool gives retail traders a practical proxy for order flow—making it possible to observe liquidity shifts, identify imbalances, and time entries more effectively, even without access to a professional market book.
The diagram below illustrates this in action. Notice the bearish move from point E to F. The decline is not a straight drop; the market swings, creating temporary highs and lows while sweeping liquidity. A trader entering a sell at point C may be right about direction, but with poor risk management or an oversized lot, the retracement toward D could stop them out. The Slippage Tool reframes this by suggesting a countermove: entering a buy at C and closing at D, turning a potential loss into a managed opportunity. In the same way, when the price rises from A, the tool highlights B as a favorable sell zone, helping traders trade with the swings rather than being shaken out by them.

Trading will always involve volatility, reversals, and liquidity traps. The key difference is whether these movements take traders out of the market or become opportunities to manage risk and execution more effectively. The Slippage Tool doesn’t eliminate uncertainty, but it brings a layer of structural clarity to the retail trader’s chart, narrowing the gap between retail platforms and professional trading infrastructure.
The subsequent sections will detail the operational mechanics of the tool, elucidate the significance of each core metric, and demonstrate how these features can be employed to improve trading decisions. Whether you are a discretionary trader seeking more precise entries or an algorithmic developer exploring new signal sources, the Slippage Tool offers a streamlined, lightweight solution to one of retail trading’s most persistent limitations: limited access to reliable market depth data.
In-Depth Overview of the Key Features of the Tool
The Slippage Tool is an MetaTrader 5 on-chart system that reconstructs order-flow signals from the live tick stream (VWAP, tick/volume imbalance, spread and ATR context), surfaces tradable edges via alerts and markers, and optionally factors an expected slippage allowance into risk/lot sizing, serving as a practical proxy for market-book insight when DOM is unavailable.
Below are the mathematical calculations and detailed explanations of the key features of this system.
1. VWAP (Volume-Weighted Average Price)
In a prior discussion, I provided an in-depth analysis of VWAP (Volume Weighted Average Price). VWAP is a sophisticated benchmark that combines both price and volume data to produce a weighted average price over a specified time frame. Unlike a simple arithmetic average—which treats each price point equally—VWAP assigns greater significance to price levels where higher trading volume has occurred. This approach ensures that the VWAP accurately reflects the price levels at which the majority of trading activity took place, effectively capturing the true market consensus during the period.
By integrating volume into its calculation, VWAP offers a more meaningful measure of the market’s “fair value,” as it accounts for the intensity of trading at different price levels. Traders and institutional participants often use VWAP to assess market conditions, identify potential entry and exit points, and gauge the overall direction of the market relative to this benchmark. Its dynamic nature allows it to serve as a reliable reference point for evaluating intraday price movements and liquidity conditions, making it an essential tool in both execution strategies and broader market analysis.

Where:
𝑃(i) = price of the i-th tick𝑉(i) = tick volume of the i-th tick
When the price trades above VWAP, it indicates that the market is trading at a premium relative to its average, signifying bullish sentiment. Conversely, if the price trades below VWAP, it suggests a discount, reflecting bearish tendencies. Traders frequently utilize VWAP as a dynamic support or resistance level, anchoring their decisions to this benchmark.

Given that not all brokers offer comprehensive market book data, this tool reconstructs a VWAP line derived solely from incoming tick data. This approach enables traders to access insights comparable to those gained from order book “fair value zones,” providing a valuable proxy for market equilibrium and aiding in informed decision-making.
2. Imbalance
Imbalance gauges whether aggressive buyers or sellers are prevailing in trading activity. In a traditional order book, this is typically assessed by comparing the volume of resting orders on the bid versus the ask. However, when direct order book data is unavailable, the tool infers market imbalance indirectly by analyzing tick behavior, providing an alternative means to gauge directional pressure and market sentiment.

Where:
BuyVolume = sum of tick volumes where the price moved upward
SellVolume = sum of tick volumes where the price moved downward
A positive imbalance indicates buying pressure, reflecting dominance by more aggressive buyers, while a negative imbalance signifies selling pressure, dominated by more aggressive sellers.

The tool monitors price movements on a tick-by-tick basis. Each upward movement (uptick) is counted as buying activity, whereas each downward movement (downtick) is associated with selling. This continuous, real-time calculation provides an ongoing measure of which side currently exerts greater influence on the market, offering valuable insight into short-term directional dynamics.
3. Spread
The spread is one of the most fundamental and essential measures of market microstructure. It represents the cost of immediacy, indicating how much traders must "pay" to execute an instant market order. This metric provides critical insight into liquidity conditions and the overall efficiency of the market, reflecting the transaction costs associated with rapid execution.
![]()
A narrow spread typically indicates liquid and efficient market conditions, facilitating smoother and more cost-effective trading. Conversely, a widespread suggests reduced liquidity, higher transaction costs, and may sometimes signal market stress or uncertainty.

The tool continuously monitors the spread in real time. Its signals can be filtered against predefined spread thresholds, helping traders avoid entries during periods when transaction costs are unusually elevated. This approach simulates the behavior of order book observers who refrain from trading when market depth is thin, thereby promoting more favorable execution conditions.
4. Flow
Flow functions as a short-term sentiment indicator, capturing whether recent ticks are predominantly bullish or bearish within a specified rolling window. It serves as a real-time pulse check on order flow pressure, providing traders with immediate insight into prevailing market momentum.

- Where:
Flow greater than zero indicates that the majority of volume is associated with upward price movements, signifying buy pressure. Conversely, a flow less than zero suggests that most volume corresponds to downward price movements, reflecting sell pressure.
By aggregating signed volumes in real time, the tool constructs a dynamic picture of short-term order flow pressure. This approach closely mirrors how a trader interprets shifting imbalances within a market book ladder, providing valuable insight into immediate market sentiment and directional bias.

Collectively, these four features (VWAP, Imbalance, Spread, and Flow)—capture the essential insights of a market order book. They accomplish this by deriving key market dynamics solely from raw tick data, thereby providing valuable microstructure information even on brokers that do not offer full order book support.
Implementation Into MQL5
In this section, I will provide a step-by-step guide on how to create the Slippage Tool using the MQL5 programming language.
File header, includes and forward declarations.
At the top of the file the script sets metadata (#property) and includes Trade.mqh, then declares the signatures of VWAP and Flow so they can be used before their definitions. The header serves three practical purposes: it documents authorship/version for later maintenance, it enables the compiler’s strict mode which enforces safer modern MQL5 semantics, and it declares dependencies so the EA can call trade routines if/when automated entries are added. The forward declarations are a small stylistic convenience — they let you place the human-friendly high-level functions anywhere in the file without worrying about textual ordering. From a maintenance perspective, this top block is the roadmap users expect: it tells what external capabilities (indicator handles, trading helpers) are available and prepares the user to find the main metrics implemented later.
// File metadata and includes
#property copyright "Copyright 2025, MetaQuotes Ltd."
#property link      "https://www.mql5.com/en/users/lynnchris"
#property version   "1.0"
#property strict

#include <Trade\Trade.mqh>    // CTrade utility for possible auto-trade usage
Enums and input parameters (configuration surface).
The enum definitions and the long list of input variables form the tool’s public API: these are the knobs a trader uses to tune behavior without changing code. The enumerations offer readable names for UI options (corners for the panel, alert modes). The inputs expose the critical signal parameters — VWAP window in minutes, imbalance window in seconds, spread-to-ATR fraction for “cheap” spread detection, flow threshold and hysteresis for alerts, risk percentage and ATR multiplier for stops, and many UI/layout options. Exposing these as input values is an important design choice: it makes the EA versatile across instruments and trading styles.
In a production article explain each input’s recommended range and trade-off: for example, longer VWAP windows yield stability but lose short-term responsiveness; a larger InpImbWindowSec smooths flow but blunts microstructure signals. Also highlight that sensible defaults are provided, but users should be guided to tune them for tick rate and market microstructure of each instrument.
// Enums (UI choices) and user-exposed inputs (tuning knobs)
enum eCorner { COR_LT=0, COR_LB=1, COR_RT=2, COR_RB=3 };
enum eAlertMode { AM_SINGLE=0, AM_ROLLING_CLEAR=1, AM_POOL_REUSE=2 };

input int    InpVWAPminutes     = 1440;   // VWAP window in minutes (rolling)
input int    InpImbWindowSec    = 30;     // Imbalance/flow window in seconds
input double InpCheapSpreadFrac = 0.50;   // Spread < ATR * this fraction => "cheap"
input double InpFlowTh         = 0.30;    // flow threshold for alerts
input double InpFlowHystFactor = 0.80;    // hysteresis factor for flow reset
input double InpRiskPct        = 1.0;     // risk per trade as % of balance
input double InpStopATRmult    = 1.2;     // stop = ATR * this multiplier
input uint   InpRingSize       = 20000;   // tick ring buffer size
input uint   InpTimerSec       = 2;       // UI refresh / aggregation cadence
Global state and naming conventions.
The global variables initialize the operational state: symbol settings, market parameters (g_point, g_tickVal), the ATR indicator handle, a CTrade object, and a set of arrays that implement a circular tick buffer. The code uses a g_ prefix for chart bject names; this namespacing is crucial for safe object cleanup — it ensures the EA only manipulates its own labels and won’t accidentally remove other indicators’ drawings.
The ring-buffer arrays (g_time, g_bid, g_ask, g_last, g_vol) plus indices g_head, g_used, g_size are the backbone of all aggregated calculations; storing ticks locally prevents repeated calls to platform APIs, improves determinism, and allows time-windowed aggregation. The globals also hold previous values for change-detection to reduce UI thrash. In articles emphasize that global state must be carefully managed in MQL5 because the terminal runs a single thread and memory leaks from indicator handles or orphaned objects are common gotchas.
// Globals: symbol settings, ring-buffer arrays and indices
string    g_sym="";
double    g_point=0.0, g_tickVal=0.0, g_tickSize=0.0;
double    g_volMin=0, g_volMax=0, g_volStep=0;
int       g_atrHandle = INVALID_HANDLE;
MqlTick   g_latestTick;
datetime  g_time[];           // ring buffer timestamps
double    g_bid[], g_ask[], g_last[], g_vol[]; // ring buffer data
int       g_head = -1;        // index of most recent slot
int       g_used = 0;         // number of filled slots
int       g_size = 0;         // capacity (InpRingSize)
Small helpers (SafeDiv, ARGB, RR).
A few tiny helper functions improve correctness and readability. SafeDiv is a defensive wrapper that avoids divide-by-zero errors — an important pattern when dealing with live data that can contain zeros or uninitialized values. ARGB composes an alpha-blended color integer for the panel backgrounds; choosing an alpha routine centralizes color math and keeps UI code concise. RR computes a risk/reward ratio in a single expression while guarding a zero denominator. These helpers are short but essential: they keep the main logic focused on trading semantics rather than repeated plumbing and protect against runtime exceptions which are hard to debug in live trading.// Defensive helpers used across the codebase double SafeDiv(double a, double b) { return (b == 0.0 ? 0.0 : a/b); } uint ARGB(color c, int a) // produce ARGB color integer { if(a<0) a=0; if(a>255) a=255; return ((uint)a<<24) | (c & 0x00FFFFFF); } double RR(double entry,double stop,double tp) // simple R/R guard { return (entry - stop != 0.0 ? (tp - entry) / (entry - stop) : 0.0); }
Ring buffer initialization and append (BufInit / BufAdd).
The ring-buffer design is deliberate: BufInit enforces a minimum capacity and resizes arrays, while BufAdd writes the latest tick into the next slot and wraps around using modulus arithmetic. This yields O(1) insertion time and a compact fixed-memory footprint. Practically, this pattern is chosen over unbounded pushes (like ArrayResize on every tick) to avoid memory churn on high-frequency instruments. BufAdd also normalizes volume using volume_real when present and falls back to volume or 1.0, because many retail feeds either omit realistic volumes or represent them differently. A larger InpRingSize preserves more history for long VWAP windows but consumes more memory. This trade-off affects responsiveness and RAM usage.// Initialize ring buffer with minimum capacity void BufInit(int n) { if(n < 128) n = 128; g_size = n; ArrayResize(g_time, n); ArrayResize(g_bid, n); ArrayResize(g_ask, n); ArrayResize(g_last, n); ArrayResize(g_vol, n); g_head = -1; g_used = 0; } // Append a tick into the circular buffer (O(1) insertion) void BufAdd(const MqlTick &q) { if(g_size <= 0) return; g_head = (g_head + 1) % g_size; g_time[g_head] = q.time; g_bid[g_head] = q.bid; g_ask[g_head] = q.ask; g_last[g_head] = q.last; double vol = (q.volume_real > 0 ? q.volume_real : q.volume); g_vol[g_head] = (vol > 0 ? vol : 1.0); // safe fallback if(g_used < g_size) g_used++; }
Price accessor (Mid function).
The Mid function returns the best available price for a stored tick: preferring the last (last trade) if present and otherwise using the midpoint of bid and ask. This layered approach is pragmatic: trade prints are the most direct evidence of executed price, but some tick updates only contain quotes, so midpoint approximates fair value. Returning 0 for unusable slots signals callers to skip those entries. Mind preference of last vs midpoint influences sensitivity: a last-centric VWAP or flow will react only when trades occur, whereas using midpoints increases density but may introduce quote noise.// Prefer last trade price; fallback to midpoint if last absent double Mid(int idx) { if(idx < 0 || idx >= g_size) return 0.0; if(g_last[idx] > 0.0) return g_last[idx]; if(g_bid[idx] > 0.0 && g_ask[idx] > 0.0) return 0.5 * (g_bid[idx] + g_ask[idx]); return 0.0; }
Spread and ATR accessors.
SpreadPips and ATR encapsulate two orthogonal measures: immediate transaction cost and market volatility. SpreadPips calls SymbolInfoTick and divides ask - bid by g_point to express spread in pips (or points), which makes comparisons with ATR straightforward. ATR() reads the most recent ATR value using CopyBuffer on an iATR handle, while ATR_Avg computes a short rolling mean. This separation is important: ATR is treated as a volatility baseline used for stop sizing and the “tight spread” test (spread < ATR * fraction). It is important to consider the computational cost: CopyBuffer does I/O and should be used sparingly; also clarify that ATR is calculated on a timeframe determined by InpTF, so picking InpTF affects ATR and therefore both stops and cheapness decisions.// Spread in pips (points normalized by g_point) double SpreadPips() { MqlTick t; if(!SymbolInfoTick(g_sym, t) || g_point == 0.0) return 0.0; return (t.ask - t.bid) / g_point; } // Latest ATR (indicator handle must be created beforehand) double ATR() { if(g_atrHandle == INVALID_HANDLE) return 0.0; double buf[]; if(CopyBuffer(g_atrHandle, 0, 0, 1, buf) == 1) return buf[0]; return 0.0; } // Average ATR across 'bars' (caps at 200 to limit work) double ATR_Avg(int bars) { if(g_atrHandle == INVALID_HANDLE || bars <= 0) return 0.0; int cap = MathMin(bars, 200); double buf[]; int copied = CopyBuffer(g_atrHandle, 0, 0, cap, buf); if(copied <= 0) return 0.0; double s = 0.0; for(int i=0; i<copied; i++) s += buf[i]; return s / copied; }
The aggregator (Acc) — the core data collector.
Acc is the single, central aggregation routine that the VWAP and Flow functions call. Given a since timestamp, it walks backwards through the ring buffer from the newest tick and accumulates price*volume (for VWAP numerator), total volume (VWAP denominator), and — optionally when flowNeeded is true — counts of upticks and downticks. The loop stops when it encounters a tick older than since, making the function window aware. Implementation subtleties matter: prev is initialized to DBL_MAX to skip the first comparison; ticks with invalid prices are skipped; the index wraps around when it reaches the start.
The function intentionally counts up and dn as occurrences (tick-count) rather than summing signed volumes — this is a design choice driven by simplicity and robustness on feeds lacking reliable volume. It is important to clearly state that: Acc enables both volume-weighted VWAP and tick-based flow, but the chosen flow metric here counts events not volumes — that difference has practical consequences for signal behavior.
// Accumulate price*volume and volume; optionally compute up/dn tick counts
void Acc(datetime since, double &pxVol, double &vol, int &up, int &dn, bool flowNeeded)
{
  pxVol = 0.0; vol = 0.0; up = 0; dn = 0;
  if(g_used == 0) return;

  int idx = g_head;
  double prev = DBL_MAX;

  for(int i = 0; i < g_used; ++i)
  {
    if(g_time[idx] < since) break;
    double p = Mid(idx);
    if(p <= 0.0) { idx--; if(idx < 0) idx = g_size - 1; continue; }
    double w = (g_vol[idx] > 0.0 ? g_vol[idx] : 1.0);
    pxVol += p * w;      // VWAP numerator
    vol   += w;          // VWAP denominator

    if(flowNeeded && prev != DBL_MAX)
    {
      if(p > prev) up++;
      else if(p < prev) dn++;
    }
    prev = p;
    idx--;
    if(idx < 0) idx = g_size - 1;
  }
}
VWAP implementation (VWAP function).
The VWAP function converts the general-purpose Acc into the familiar formula. It computes since from TimeCurrent() minus the configured minutes, passes that to Acc to obtain px and v, and returns px / v. The function returns zero when no volume is present, preventing NaNs. From a conceptual standpoint VWAP in this tool is a rolling, time-windowed VWAP (not session VWAP by default), which gives you control over responsiveness via InpVWAPminutes. VWAP is typically used in two ways: a long-window VWAP as a fair-value anchor and short-window VWAPs for intraday microstructure — and show how to modify since to compute session-based VWAP if desired.// Rolling VWAP over last 'minutes' minutes double VWAP(int minutes) { if(minutes <= 0) return 0.0; datetime since = TimeCurrent() - (datetime)minutes * 60; double px = 0.0, v = 0.0; int u, d; Acc(since, px, v, u, d, false); return (v > 0.0 ? px / v : 0.0); }
Flow implementation (Flow function).
Flow uses Acc with flowNeeded=true to get uptick and downtick counts and returns (up - dn) / (up + dn), a normalized tick-count imbalance in [-1,1]. This simple ratio provides an immediate sense of directional activity: values near +1 indicate almost all ticks were upticks in the window, suggesting aggressive buying by ticks, while -1 indicates selling bias.
The explicit choice of tick-count rather than volume-weighted signed volume merits strong emphasis: counting ticks gives equal weight to all price moves and is robust to abnormal single large trades; volume-weighted flow instead measures the mass behind moves and can be more informative when true trade sizes are reliable. Both approaches are valid; the example below demonstrates the implementation currently used.
// Tick-count based flow (implemented in base tool)
double Flow(int sec)
{
  if(sec <= 0) return 0.0;
  datetime since = TimeCurrent() - sec;
  double px = 0.0, v = 0.0;
  int up = 0, dn = 0;
  Acc(since, px, v, up, dn, true);
  int tot = up + dn;
  return (tot ? double(up - dn) / tot : 0.0);  // normalized [-1,1]
}

// Alternative: volume-weighted flow (replace Acc's tick-count mode)
// *Requires modifying Acc to accumulate signedVol and totalVol*
double VolumeWeightedFlow(int sec)
{
  if(sec <= 0) return 0.0;
  datetime since = TimeCurrent() - sec;
  int idx = g_head;
  double signedVol = 0.0, totalVol = 0.0;
  double prev = DBL_MAX;

  for(int i = 0; i < g_used; ++i)
  {
    if(g_time[idx] < since) break;
    double p = Mid(idx);
    if(p <= 0.0) { idx--; if(idx < 0) idx = g_size - 1; continue; }
    double w = (g_vol[idx] > 0.0 ? g_vol[idx] : 1.0);
    if(prev != DBL_MAX)
    {
      if(p > prev) signedVol += w;
      else if(p < prev) signedVol -= w;
    }
    totalVol += w;
    prev = p;
    idx--; if(idx < 0) idx = g_size - 1;
  }
  return (totalVol ? signedVol / totalVol : 0.0); // normalized to [-1,1]
}
Object, panel and label helpers (EnsureObj, SetLabelIfChanged, SetRectIfChanged).
The UI helpers abstract repetitive object creation and property updates, and they smartly avoid unnecessary ObjectSet* calls by comparing current values before changing them. This reduces flicker and CPU usage because the terminal API calls to create or set object properties are not free. EnsureObj centralizes object creation semantics, and SetLabelIfChanged and SetRectIfChanged standardize property updates for labels and rectangle backgrounds. From a software-engineering perspective, this is good practice — isolate platform quirks and keep the main logic crisp. In documentation, point out that these helpers also consistently set objects as not selectable, preventing accidental chart manipulation and making the panel behave as a dashboard rather than interactive chart elements.// Create object if missing void EnsureObj(string name, ENUM_OBJECT type) { if(ObjectFind(0, name) == -1) ObjectCreate(0, name, type, 0, 0, 0); } // Update label text & position only if changed (reduces redraws) void SetLabelIfChanged(string name, int corner, int xdist, int ydist, string text, int fontsize, color col, string font) { EnsureObj(name, OBJ_LABEL); if(ObjectGetInteger(0,name,OBJPROP_CORNER) != corner) ObjectSetInteger(0,name,OBJPROP_CORNER,corner); if(ObjectGetInteger(0,name,OBJPROP_XDISTANCE) != xdist) ObjectSetInteger(0,name,OBJPROP_XDISTANCE,xdist); if(ObjectGetInteger(0,name,OBJPROP_YDISTANCE) != ydist) ObjectSetInteger(0,name,OBJPROP_YDISTANCE,ydist); if(ObjectGetString(0,name,OBJPROP_TEXT) != text) ObjectSetString(0,name,OBJPROP_TEXT,text); if(ObjectGetInteger(0,name,OBJPROP_FONTSIZE) != fontsize) ObjectSetInteger(0,name,OBJPROP_FONTSIZE,fontsize); if(ObjectGetInteger(0,name,OBJPROP_COLOR) != (int)col) ObjectSetInteger(0,name,OBJPROP_COLOR,col); if(ObjectGetString(0,name,OBJPROP_FONT) != font) ObjectSetString(0,name,OBJPROP_FONT,font); ObjectSetInteger(0, name, OBJPROP_SELECTABLE, false); } // Update rectangle only when a property changed void SetRectIfChanged(string name,int corner,int xdist,int ydist,int xsize,int ysize,uint bgARGB) { EnsureObj(name, OBJ_RECTANGLE_LABEL); if(ObjectGetInteger(0,name,OBJPROP_CORNER) != corner) ObjectSetInteger(0,name,OBJPROP_CORNER,corner); if(ObjectGetInteger(0,name,OBJPROP_XDISTANCE) != xdist) ObjectSetInteger(0,name,OBJPROP_XDISTANCE,xdist); if(ObjectGetInteger(0,name,OBJPROP_YDISTANCE) != ydist) ObjectSetInteger(0,name,OBJPROP_YDISTANCE,ydist); if(ObjectGetInteger(0,name,OBJPROP_XSIZE) != xsize) ObjectSetInteger(0,name,OBJPROP_XSIZE,xsize); if(ObjectGetInteger(0,name,OBJPROP_YSIZE) != ysize) ObjectSetInteger(0,name,OBJPROP_YSIZE,ysize); if((uint)ObjectGetInteger(0,name,OBJPROP_BGCOLOR) != bgARGB) ObjectSetInteger(0,name,OBJPROP_BGCOLOR,bgARGB); if((uint)ObjectGetInteger(0,name,OBJPROP_COLOR) != bgARGB) ObjectSetInteger(0,name,OBJPROP_COLOR,bgARGB); ObjectSetInteger(0,name,OBJPROP_SELECTABLE,false); }
Panel creation and layout (CreatePanelObjects and UpdatePanelObjects).
CreatePanelObjects instantiates the set of labels and rectangles that form the info panel; UpdatePanelObjects is a layout engine that calculates text widths, bar sizes, and positions, then updates properties to visually reflect the latest metrics. It uses a character-width constant to estimate label widths, computes available space for bars, and draws proportional foreground bars for spread, ATR, and flow.
The code chooses a compact visual vocabulary — a header, summary lines, three horizontal bars, and a footer timestamp — so traders get essential signals at a glance. The panel layout corresponds to the following metrics: link each UI element to its underlying variable (spPips - spread bar, flow - flow bar) and explain the design trade-offs: precomputed approximate text widths avoid complex font metrics calls but may slightly misalign in rare fonts; the chosen alpha-blending helps the UI be readable without obscuring the chart.
// Minimal set of dashboard objects used by UpdatePanelObjects
void CreatePanelObjects()
{
  EnsureObj("ESGP_bg", OBJ_RECTANGLE_LABEL);
  EnsureObj("ESGP_hdr", OBJ_LABEL);
  EnsureObj("ESGP_lbl", OBJ_LABEL);
  EnsureObj("ESGP_vwap", OBJ_LABEL);
  EnsureObj("ESGP_spbar", OBJ_RECTANGLE_LABEL);
  EnsureObj("ESGP_spbar_fg", OBJ_RECTANGLE_LABEL);
  EnsureObj("ESGP_flow_lbl", OBJ_LABEL);
  // Make them non-selectable by default
  string objs[] = {"ESGP_bg","ESGP_hdr","ESGP_lbl","ESGP_vwap","ESGP_spbar","ESGP_spbar_fg","ESGP_flow_lbl"};
  for(int i=0;i<ArraySize(objs);i++) ObjectSetInteger(0,objs[i],OBJPROP_SELECTABLE,false);
}
Alert management and visual markers.
The alert subsystem supports three modes: single replacement, rolling clear (timestamp-based unique names), and a pooled circular set of markers. Alerts are optionally drawn only when the cheap spread test is satisfied and the flow crosses configured thresholds, incorporating hysteresis to avoid flapping. The code stores a timestamp in OBJPROP_TOOLTIP for each marker and AutoClearOldAlerts deletes stale markers older than InpAlertMaxAgeSec. This is an elegant, low-dependency approach to on-chart journaling: it avoids the need for external storage while giving traders a visible audit trail of signal events. These design choices improve practical usability for traders: having persistent markers simplifies review and backtesting by visual comparison, while hysteresis reduces noise and false retriggers.// Draw a simple buy/sell alert label in the panel corner void DrawAlertMarker(bool isBuy) { string nm = (isBuy ? "ESGP_alert_buy" : "ESGP_alert_sell"); if(ObjectFind(0, nm) != -1) ObjectDelete(0, nm); ObjectCreate(0, nm, OBJ_LABEL, 0, 0, 0); ObjectSetInteger(0, nm, OBJPROP_CORNER, COR_LT); ObjectSetInteger(0, nm, OBJPROP_XDISTANCE, 8); ObjectSetInteger(0, nm, OBJPROP_YDISTANCE, isBuy ? 60 : 80); ObjectSetString(0, nm, OBJPROP_TEXT, isBuy ? "▲ BUY" : "▼ SELL"); ObjectSetInteger(0, nm, OBJPROP_FONTSIZE, 12); ObjectSetInteger(0, nm, OBJPROP_COLOR, isBuy ? clrLime : clrRed); ObjectSetInteger(0, nm, OBJPROP_SELECTABLE, false); ObjectSetString(0, nm, OBJPROP_TOOLTIP, IntegerToString((int)TimeCurrent())); // store timestamp }
OnInit and OnDeinit lifecycle management.
OnInit performs all necessary startup tasks: symbol selection, optional chart timeframe change, fetch of symbol parameters (SYMBOL_POINT, SYMBOL_VOLUME_STEP, etc.), creation of the ATR indicator with iATR, ring-buffer initialization, panel object creation, and timer setup with EventSetTimer. Each step checks for errors (e.g., invalid ATR handle) and returns INIT_FAILED when critical initialization fails — an important safety pattern.int OnInit() { g_sym = (_Symbol); if(!SymbolSelect(g_sym, true)) return INIT_FAILED; g_point = SymbolInfoDouble(g_sym, SYMBOL_POINT); g_tickVal = SymbolInfoDouble(g_sym, SYMBOL_TRADE_TICK_VALUE); g_tickSize= SymbolInfoDouble(g_sym, SYMBOL_TRADE_TICK_SIZE); g_volMin = SymbolInfoDouble(g_sym, SYMBOL_VOLUME_MIN); g_volMax = SymbolInfoDouble(g_sym, SYMBOL_VOLUME_MAX); g_volStep = SymbolInfoDouble(g_sym, SYMBOL_VOLUME_STEP); // create ATR handle for InpTF and InpATRperiod (example uses default TF & period) g_atrHandle = iATR(g_sym, PERIOD_M1, 14); if(g_atrHandle == INVALID_HANDLE) return INIT_FAILED; BufInit((int)InpRingSize); CreatePanelObjects(); EventSetTimer((int)InpTimerSec); return INIT_SUCCEEDED; }
OnDeinit cleans up: it kills the timer, removes panel and alert objects, and releases indicator handles. Failing to release indicator handles or leaving timers active can produce hidden memory/handle leaks in the terminal and unexpected behavior when the EA is reattached.
void OnDeinit(const int reason)
{
  EventKillTimer();
  // remove panel objects (prefix "ESGP_")
  int total = ObjectsTotal(0);
  for(int i=total-1; i>=0; --i)
  {
    string nm = ObjectName(0, i);
    if(StringFind(nm, "ESGP_", 0) == 0) ObjectDelete(0, nm);
  }
  if(g_atrHandle != INVALID_HANDLE) { IndicatorRelease(g_atrHandle); g_atrHandle = INVALID_HANDLE; }
}
OnTick ingestion strategy.
OnTick is intentionally light: it reads the latest tick with SymbolInfoTick and appends it to the ring buffer via BufAdd. Heavy processing is deferred to OnTimer. This is an important architectural choice: some instruments generate hundreds or thousands of ticks per second, and doing expensive UI updates or indicator reads inside OnTick can saturate the main thread and slow the terminal. By decoupling ingestion and processing, the EA remains responsive and deterministic. This architecture also simplifies testing because: OnTimer runs at a controlled cadence, so measured behavior is easier to reproduce.void OnTick() { MqlTick q; if(SymbolInfoTick(g_sym, q)) { g_latestTick = q; // store latest tick BufAdd(q); // append into ring buffer (fast) } }
OnTimer main loop — calculations, decisioning, UI and alerts.
OnTimer is the orchestrator: it ensures the buffer is up to date, enforces a refresh cadence, computes spread and ATR in pips, applies the “cheap spread” test, calls VWAP and Flow, computes position-sizing and risk parameters, decides whether to refresh the panel (via change thresholds), and evaluates alert logic. The risk sizing routine computes a stop based on ATR and InpStopATRmult, converts stop distance to ticks and cash per lot, and derives a lot size that caps account risk according to InpRiskPct, rounding to the broker’s g_volStep and clamping between min and max allowed volumes. The alert decision requires both a cheap spread and a flow exceeding threshold, with hysteresis via InpFlowHystFactor to prevent rapid toggling. Present this paragraph in your article as the “decision engine” explanation — it demonstrates how cost filtering (spread vs ATR), directional confirmation (flow), and money-management (risk/lot computation) combine to form a practical trading signal.
It is vital to state explicitly that Flow in the current implementation is tick-count-based: it measures frequency of upticks vs downticks, not the total volume behind those moves. This choice makes the metric robust on feeds that lack reliable per-tick volume but also means the metric can be skewed by many small ticks versus a single large trade. VWAP is implemented as a time-windowed rolling VWAP (minutes-based), not session VWAP, which affects interpretation: rolling VWAP is reactive, session VWAP provides an intraday benchmark.
Spread is normalized to pips using g_point, while ATR is read in points and converted to pips so that comparisons are consistent. Both the implemented formulas and alternative versions can be considered. You can also switch to a volume-weighted flow (modify Acc to accumulate signed volumes and divide by total volume).
void OnTimer()
{
  // 1) ensure buffer has latest tick (sometimes needed)
  MqlTick t; if(SymbolInfoTick(g_sym, t)) { if(g_used == 0 || g_time[g_head] != t.time) BufAdd(t); }

  // 2) compute metrics
  double spPips = SpreadPips();
  double atrPts = ATR();                          // ATR in price units (points)
  double atrPips = (atrPts > 0 && g_point > 0) ? atrPts / g_point : 0.0;
  bool cheap = (atrPts > 0 && spPips < atrPips * InpCheapSpreadFrac);
  double vwap = VWAP(InpVWAPminutes);
  double flow = Flow(InpImbWindowSec);            // tick-count flow

  // 3) Example risk sizing (conservative)
  double bal = AccountInfoDouble(ACCOUNT_BALANCE);
  double bid = SymbolInfoDouble(g_sym, SYMBOL_BID);
  double stop = bid - InpStopATRmult * atrPts;
  double riskPx = bid - stop;
  double ticks = (g_tickSize > 0 ? riskPx / g_tickSize : 0.0);
  double cashPerLot = ticks * g_tickVal;
  double maxLoss = bal * InpRiskPct / 100.0;
  double rawLot = (cashPerLot > 0.0 ? maxLoss / cashPerLot : 0.0);
  double lot = (g_volStep > 0.0 ? MathFloor(rawLot / g_volStep) * g_volStep : 0.0);

  // 4) Alerting with hysteresis
  double resetThresh = InpFlowTh * InpFlowHystFactor;
  static bool buyF=false, sellF=false;
  if(cheap)
  {
    if(flow >= InpFlowTh && !buyF) { Alert("BUY edge: cheap spread + buy flow"); buyF = true; sellF = false; DrawAlertMarker(true); }
    else if(flow < resetThresh) buyF = false;

    if(flow <= -InpFlowTh && !sellF) { Alert("SELL edge: cheap spread + sell flow"); sellF = true; buyF = false; DrawAlertMarker(false); }
    else if(flow > -resetThresh) sellF = false;
  }
}
Finally, stress testing considerations: strategy tester tick granularity may not reflect live feed behavior, so tick-replay or historical tick data is needed to validate tick-based logic. Logging should be judicious (avoid Print flooding on active instruments) and profiling for CPU usage is recommended when InpTimerSec is small. Recommended parameter presets (e.g., InpVWAPminutes of 60–240 for intraday use, InpImbWindowSec of 10–60 for microstructure detection, InpCheapSpreadFrac 0.3–0.7 depending on instrument). A staged tuning approach is recommended: begin with conservative thresholds, verify signals with visual markers first, and only enable auto-trading after rigorous forward testing. Suggest improvements such as providing an option to use session-based VWAP, making flow volume-weighted, adding EMA smoothing for flow to reduce whipsaw, and offering recording of tick history for reproducible offline analysis.
Outcomes
After developing the EA, the next step was deployment for testing, which can be conducted either on a demo account or through backtesting. I will share a series of images captured during the testing process on the MetaTrader 5 terminal to illustrate the system's performance and behavior.
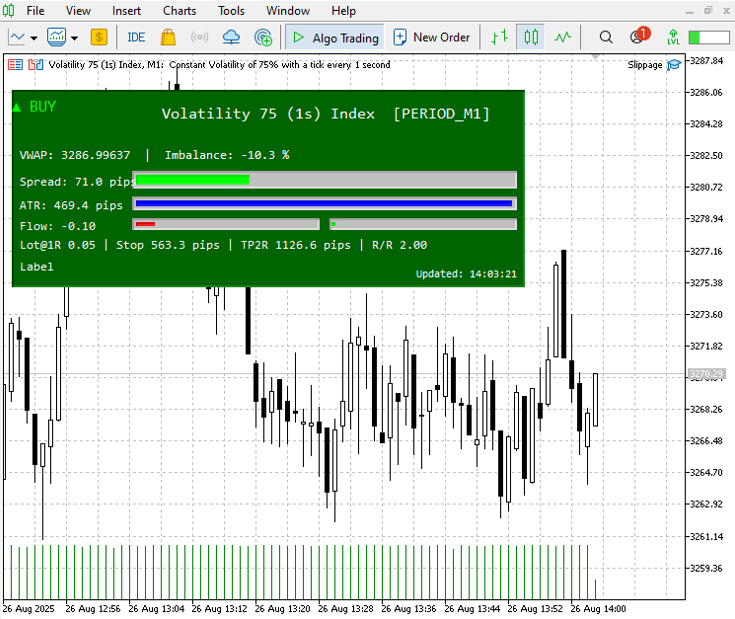
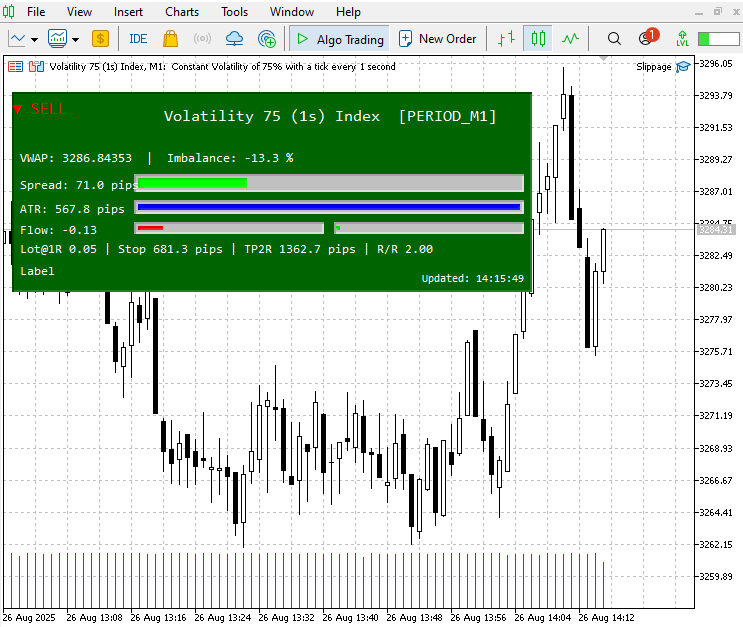
In the diagram below, the panel displays a previously issued BUY alert (green header /BUY marker). However, the current short-window flow is slightly negative, with Imbalance approximately -10.3% and Flow at -0.10.
The spread of 71.0 pips is relatively small compared to the prevailing volatility, which the system considers "cheap" (the spread cheapness condition is met). Given the ATR is quite large at 469.4 pips, protective stops calculated based on ATR produce wide stop and take-profit distances—approximately 563.3 pips for the stop and 1,126.6 pips for the TP2R, resulting in a risk/reward ratio of 2.00.
Overall, the EA’s cost filter (indicating a cheap spread) is satisfied. However, the directional confirmation via flow is slightly bearish at this moment, so the system does not generate a new buy trigger despite the existing buy marker from the earlier signal.
Following the initial buy signal, the market moved in favor of the trade over time. The corresponding diagram illustrates this positive movement. Currently, a new sell signal has been indicated, reflecting the evolving market conditions.
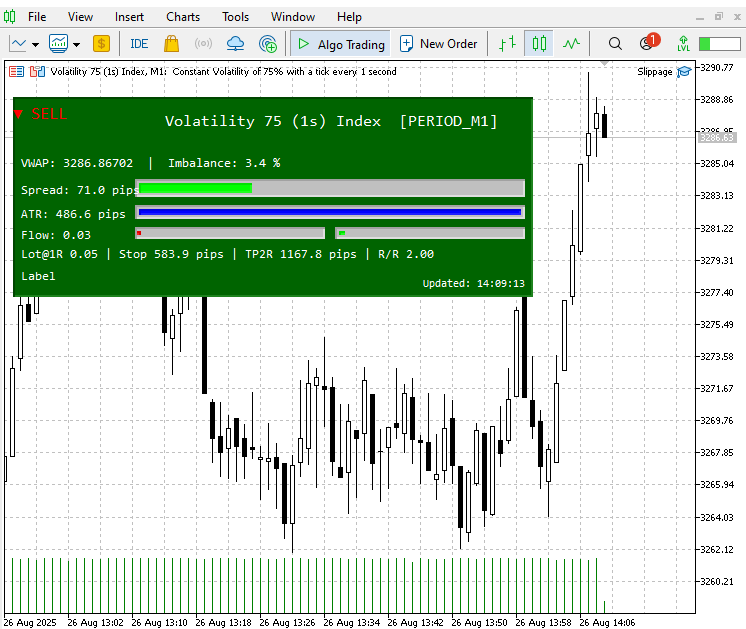
Subsequently, the market reversed downward, confirming the validity of the signal. Please see the illustration below for visual confirmation of this movement.
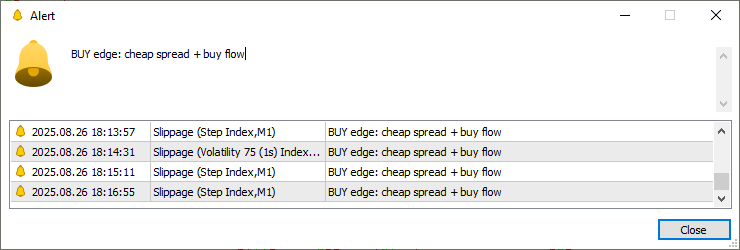
Each and every signal is accompanied by an alert notification and is logged in the MetaTrader 5 Experts tab for comprehensive tracking and record-keeping.
Conclusion
The Slippage Tool was developed to address a practical and common challenge faced by retail traders: limited access to reliable market book data while still needing order-flow signals to identify higher-probability entry points. Rather than attempting to replace a comprehensive depth ladder, this system extracts the most actionable microstructure insights from the available tick stream. It utilizes a rolling VWAP as a fair-value anchor, a short-window imbalance and flow metric to highlight directional pressure, and spread plus ATR context to ensure signals are both tradable and risk-aware. Coupled with on-chart visualization, alerts, and automated position sizing logic, the tool transforms raw tick data into decision-ready information in real time.
What differentiates the Slippage Tool is its pragmatic focus on robustness and user-friendliness. Features such as a ring buffer and lightweight OnTick ingestion help maintain terminal performance on high-tick instruments; defensive helpers and change detection prevent unnecessary redraws; and alerts include hysteresis and configurable marker modes to minimize noise and false signals. The integrated risk-sizing logic links signal generation to actual money management, evaluating each potential trade against ATR-based stops and account risk, thereby promoting disciplined sizing over reckless position-taking.
It is important to acknowledge the tool’s limitations. It serves as a proxy for order-book information, not a direct DOM feed: flow is derived from tick counts (or optionally volume-weighted), and VWAP is reconstructed from prints and midpoints. Consequently, signals should be validated within the context of charts, multiple timeframes, and replayed tick data. Parameters such as VWAP window, imbalance window, spread fraction, and flow thresholds should be tuned to suit each instrument’s tick rate and volatility; there is no universal configuration.
For practitioners seeking to implement the system confidently, a staged approach is recommended: (1) visually validate signals using the panel and markers in replay or demo mode, (2) conservatively tune thresholds and verify performance in forward testing, and (3) only then consider automating entries with robust stop and timeout rules, along with comprehensive logging. Future enhancements may include a selectable session VWAP mode, optional volume-weighted flow calculation, EMA smoothing to reduce whipsaws, and an exportable event log to facilitate reproducible analysis.
See my other articles.
Warning: All rights to these materials are reserved by MetaQuotes Ltd. Copying or reprinting of these materials in whole or in part is prohibited.
This article was written by a user of the site and reflects their personal views. MetaQuotes Ltd is not responsible for the accuracy of the information presented, nor for any consequences resulting from the use of the solutions, strategies or recommendations described.

- Free trading apps
- Over 8,000 signals for copying
- Economic news for exploring financial markets
You agree to website policy and terms of use
why is there no panel?
sir,
why is there no panel?
Reduce the panel dashboard size and make it more professional by adding strength cloums then this flow indicator lines meter