
Indicators with on-chart interactive controls
Introduction
I have been trading since 2008 accumulating a decent amount of knowledge along the way. Now I use this knowledge to develop my products. Having tried dozens of different trading strategies over the years, as well as having tested hundreds of different indicators, I have come to some conclusions I want to share with you in this article. Now, just as before, the quality of the MetaTrader trading platforms is beyond doubt. But in modern conditions, users are becoming more demanding of the products provided to them. So, I thought that it would be nice to create a principle that can be easily applied to any indicator. That principle aims at more interaction between a user and a program.
About indicators
MetaTrader platforms offer various types of trading programs. These are Expert Advisors (EAs), scripts and indicators. I am going to talk about indicators.
There are different types of indicators: support/resistance lines, candlestick fractals or patterns, volumes or other data on trading operations on the stock exchange, oscillators or histograms. We need all of them in order to show a certain price movement pattern, which, in turn, forms a trading signal. The more often the pattern occurs, the stronger the signal.
A pattern is a repetitive or very similar price movements occurring at certain indicator readings. For example, if the fast Moving Average crosses the slow one upwards, while the price crosses it downwards, then the price is more likely to bounce off this line and continue to rise. Such patterns can be found while using any indicator.
Each indicator, regardless of its purpose, shows patterns for a certain period of time. This means that a signal is formed based on past price movements in some area of historical data. It can be 10 H1 bars or 1000 D1 bars. A time period, in which we are looking for a pattern, is called the indicator "period".
Since all indicators are calculated on historical data, any indicator has a calculation period. If we set the period value to 100 and place the indicator on H1 chart, then we will get the indicator calculation result for the last 100 H1 candles. The indicator period remains unchanged till we change it on our own. If the nature of the price movement changes, for example, the movement becomes more volatile, then we will have to increase the period in order for the indicator to correspond to the current market situation.
To do this, we will need to go to the indicator settings and select a new period value. The parameter will have to be changed stepwise. The step should be selected intuitively — it should not be too large so as not to miss the desired signal, but also not too small — so as not to spend too much time on it. If you do it often during a day, then you can spend a significant amount of time on it. In fact, working with indicators is a kind of compromise between the desired result, its accuracy and the time a trader is willing to spend.
Another option is opening all the necessary charts at once with different indicator settings. In this case, the entire working space is cluttered with windows containing same-type indicators that are different from one another only in period settings. This solution is also not perfect in terms of workspace arrangement. Unfortunately, both options are far from convenient.
The heart of the issue
I want to highlight the issue using a trading strategy I have been using in my trading for a long time. I think, many traders face the same issue every day. Someone simply does not realize it and takes it for granted, while for someone it creates discomfort, just like it did for me. The strategy is based on the indications of Moving Average lines. It works well in trend movements. Its essence lies in the fact that if a trend has begun, then most likely it will continue, and the trading signal is the return of the price to the slow line during the correction.
In order to calculate the slow line period, we need to find a certain position of the fast and slow Moving Averages during the previous correction.
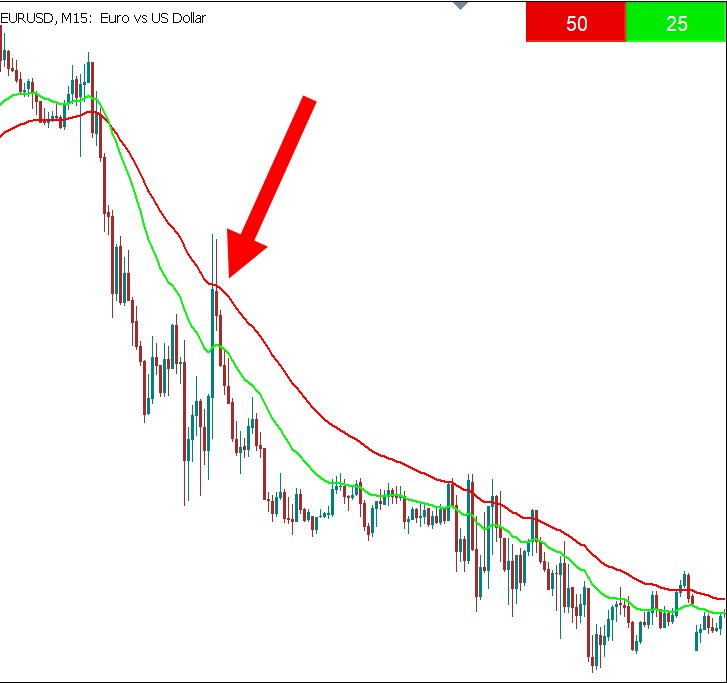
To find a necessary period, you need to perform a number of repetitive operations. The peculiarity of this strategy is that the line periods should always differ two times. For example, if the fast line period is 20, the period of the slow one should be equal to 40. In this case, you need to find the minimum value for the line periods, at which the fast line will not cross the slow one during the correction. The image shows period lines of 25 and 50, respectively. As we can see, the lines have not crossed during the previous correction. So we can further reduce their periods. Open the fast line settings and change the period. Then open the slow line settings and also change the period. We will have to do this operation several times until the lines converge as close as possible.
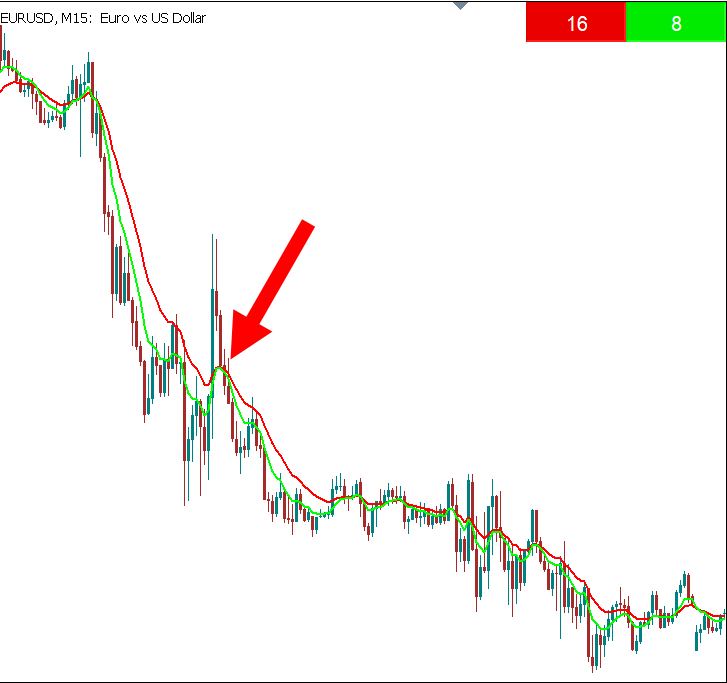
The lines are not crossing yet. But we first need to find the extreme position at which the lines intersect, and then increase their period by one step. So, we again change the period settings to 7 and 14, respectively.
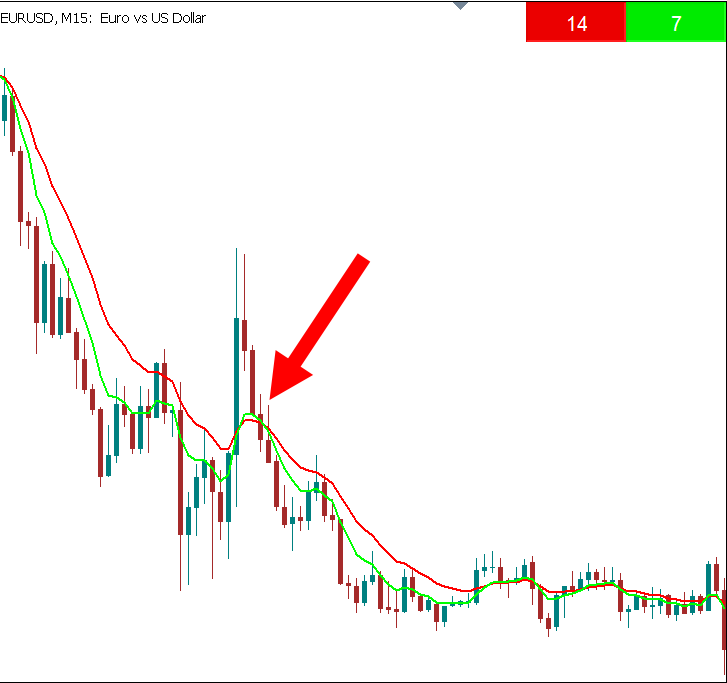
Now we have the intersection. This means an extreme position has been found and now it is necessary to increase the periods by one step. Open the settings for each line again and change the period values.
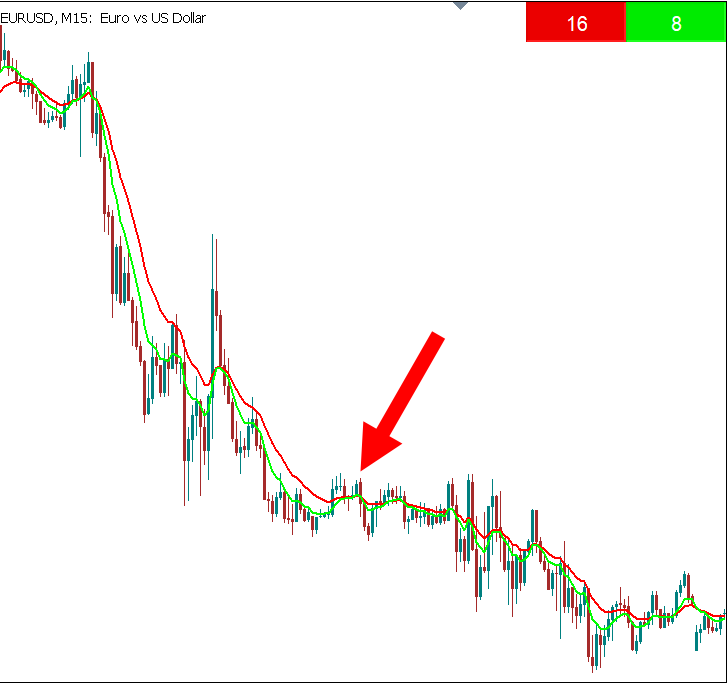
As a result, the desired combination of line parameters was found and the signal was successfully generated. However, the preparation for the search took a certain time and forced me to engage in monotonous, even tedious, actions. Do not forget that this is only one timeframe on a single currency pair. In order to follow several currency pairs on different timeframes, such actions will have to be performed very often. My experience shows that the process takes at least half of the working time when using minute timeframes. This strategy is probably quite popular. I think, many traders use something similar in their daily trading.
The drawbacks of the strategy are obvious. In addition to the fact that such constant manipulations with indicator settings take a lot of time, they also distract from the main activity - trading. While you select a new line parameters, an already formed signal on another currency pair or another timeframe may simply go unnoticed. Additionally, you may fail to close a deal in time, with maximum profit or minimum loss. In addition to this, after several hours of such work, any person begins to get tired. Monotonous actions let trader's guard down increasing the risk of an error to say nothing of spent time. after several years of working at a computer monitor, you begin to value your time and understand the importance of such seemingly trifle things.
Interface principle
The idea behind the interface is to scroll the indicator period with the mouse wheel directly from the chart without going into the settings. We are going to use the button to activate the scrolling mode.
Download the source code of the Button CCI indicator in the attached file to try it or download the latest free version with additional features and see a detailed description of its settings by following the link.
The issue is clear. Obviously, we need to somehow accelerate setting the period. There is only one way to do this — automating the process. It is possible to create an algorithm that will select the period values on its own. But the algorithm still needs its own calculation period! This means we have to manually set the number of candles used by the algorithm to select the Moving Average period! This is a sort of a Meta period. This will solve the problem with the time spent on the selection of the desired period, but this solution has its drawbacks due to its complexity. This approach is implemented in the free Dynamic Double Moving Averages indicator. In the future, I plan to improve it so that it is more manageable and responsive to changes in the settings entered by a user.
Another method is, in my opinion, simpler and at the same time more interactive. It involves changing the period by a trader, albeit in a more convenient form. After all, no matter how smart the algorithm is, traders still know better what indicator settings they need, and our task is to help them and facilitate the process. To change the period, we will use scrolling with the mouse wheel. The scrolling mode itself will be activated by turning on the button right on the chart.
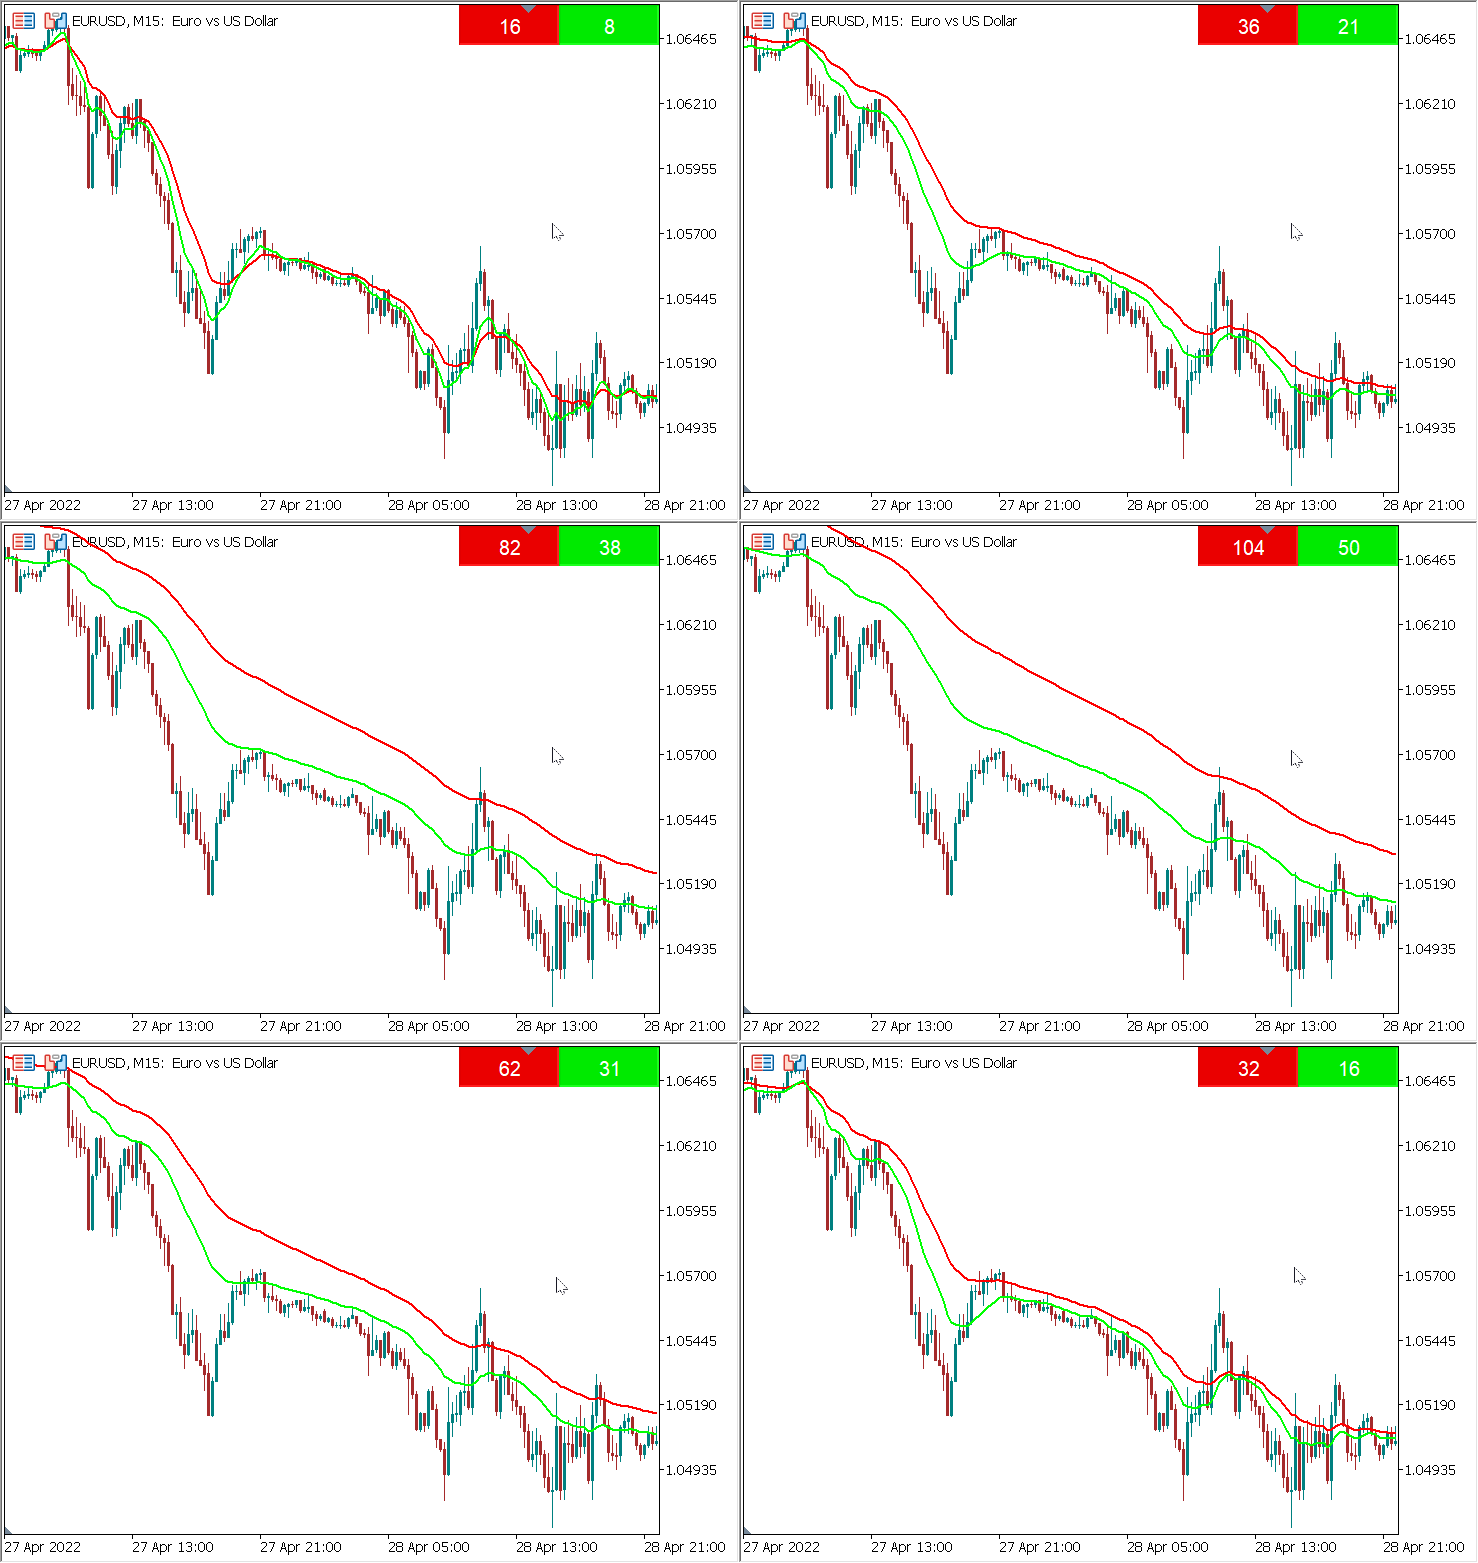
The image shows how easy it is to change the indicator period with a single movement. Simply activate the button of the necessary indicator and scroll the mouse wheel in the desired direction. You can also set a necessary period change step. You can also change the period of several indicators at once by simply activating the necessary buttons. These features are great for the strategy described above. For example, you can set the step for changing the fast line to 1 and the slow line to 2, enable scrolling for both lines, and easily change their periods at the same time keeping the ratio 1/2.
Advantages
- First, traders can adjust the indicator period as they usually do, albeit spending much less time and effort.
- Second, such an interface is intuitive and easy to use. After prolonged use of such an indicator, you no longer want to return to the standard interface.
- In addition, the use of such an indicator allows you to use only one window replacing several same-type indicators with one. This will free the working screen from clutter.
- Another advantage is improvement in the quality of trading due to the increased concentration on the process itself, rather than on the indicator settings.
- Searching for signals in a rapidly changing market is accelerated as well, which helps increasing the trader's productivity.
Disadvantages
With all these advantages, such an interface has its drawbacks.
- First, it is difficult to reproduce it for MetaTrader 4 due to technical constraints of the MQL4 language.
- Second, when performing calculations on a large amount of data (more than 20,000 bars), indicators noticeably slow down.
But history analysis is not needed so often, and you can limit the amount of data for calculation for everyday use. These shortcomings are not critical and do not interfere with everyday use of such indicators in MetaTrader 5.
Creating an indicator with a period scrolling based on Moving Average
Based on the above, I decided that it would be useful to create an indicator with the most convenient interface that saves users from routine actions. Also, the goal was to create the most simple principle for most indicators, so that a similar interface can be easily reproduced on any other indicator.
I decided to take the most popular indicator — Moving Average — as an example. The complexity of the idea lies in the fact that if we want to dynamically change the period, then we have to use dozens and even hundreds of indicators at the same time. Since the system distinguishes indicators used in one window by a short name and a set of parameters, the set of parameters will always differ in the "period" parameter at each change step, and a new indicator handle will be created for each period, which can significantly slow down the work. While looking for a solution, I came across criticism of this method on the forums. Experienced programmers said that such an implementation is prohibited at the language level and is generally impossible since memory overflow is inevitable (which I constantly encountered in MetaTrader 4). Indeed, for MetaTrader 4 the issue is unsolvable.
However, in MQL5, a handle is created for each indicator on the chart once and then accessed when necessary. In other words, even if we create a new handle on each tick, it is not created anew but instead we access the already created one. This already makes things easier for the memory. But it is possible to create all the necessary handles in OnInit in advance, so that we can completely forget about this issue. The only limitation lies in the fact that we need to predefine within what limits the period will change in order to create all the necessary handles when initializing the indicator. The maximum period is limited in advance by the trader in the settings via the period_ma_max parameter. Using the step, we save even more memory by avoiding the calculation of unnecessary handles. The step is set by a trader as well. The default value is 1.
int OnInit()
{
//Create all necessary handles
for(int i=1; i<=period_ma_max; i+=step)
    handle=iMA(_Symbol,_Period,i,0,method_MA,price_MA);

}
Now we need to create the functionality for implementing period scrolling. To do this, let's create an on-chart button activating the period scrolling mode using the mouse wheel.
//+------------------------------------------------------------------+
//|              CREATING BUTTON IN OnInit()
//+------------------------------------------------------------------+

   ObjectDelete(0,name);
   ObjectCreate(0,name,OBJ_BUTTON,0,0,0);
   ObjectSetString(chart_ID,name,OBJPROP_TEXT,text);
   ObjectSetInteger(chart_ID,name,OBJPROP_COLOR,clr_Text_Button);
   ObjectSetInteger(chart_ID,name,OBJPROP_BGCOLOR,clr_Button);
   ObjectSetInteger(chart_ID,name,OBJPROP_CORNER,CORNER_RIGHT_UPPER);
   ObjectSetInteger(chart_ID,name,OBJPROP_XDISTANCE,distance_X);
   ObjectSetInteger(chart_ID,name,OBJPROP_YDISTANCE,distance_Y);
   ObjectSetInteger(chart_ID,name,OBJPROP_XSIZE,size_X);
   ObjectSetInteger(chart_ID,name,OBJPROP_YSIZE,size_Y);
   ObjectSetInteger(chart_ID,name,OBJPROP_STATE,true);
   ObjectSetInteger(chart_ID,name,OBJPROP_SELECTABLE,true);
   ObjectSetInteger(chart_ID,name,OBJPROP_SELECTED,true);
   ObjectSetInteger(chart_ID,name,OBJPROP_STATE,press_Button);
   ObjectSetInteger(chart_ID,name,OBJPROP_ZORDER,1);

   ChartRedraw();
When loading two or more indicators on a chart, their buttons are created in the same place, which is inconvenient. Therefore, when adding each subsequent indicator, we need to shift the button along some axis. To do this, you first need to calculate exactly how many of our indicators have already been uploaded on the chart. First, let's find the total number of indicators in the window:
int      total_Indicators=ChartIndicatorsTotal(0,0),
         this_indicators=0;
Next, choose our indicators from them:
for(int i=0; i<total_Indicators; i++)
     {
      if(ChartIndicatorName(0,0,i)=="Button_MA")
         this_indicators++;
     }
IndicatorSetString(INDICATOR_SHORTNAME,"Button_MA")
When searching for an indicator by a short name in this way, we should always remember that if we create a short indicator name after the loop, then the name of the current indicator that we add to the chart will correspond to its file name. In this case, if the file name differs from INDICATOR_SHORTNAME, the current indicator in the loop is not calculated.
Now move the button by X axis:
distance_X=size_X*this_indicators;
After that, the buttons of all indicators added to the chart appear in a row. Unfortunately, a user will have to rename the button when adding more than one indicator to one chart or at least change other indicator inputs in the settings. This happens because it is forbidden to add indicators with the same inputs to one window in MetaTrader 5. Nothing can be done about this, so we will have to shift the manual change of settings to the trader. Since changing the settings is not always necessary, let's move the button name to the indicator settings. This way we will kill two birds with one stone: we will change the indicator inputs and provide different names for objects on the same chart. What is more, buttons with different names are more informative and convenient.
input string  name_Line = "MA_1";
string   name = name_Line,
         text = name_Line;
Now, when a user renames each button, indicators and buttons themselves are easily added to the window, and the text displayed on the buttons corresponds to their names. The buttons are ready. Now we need to create a mechanism for scrolling the period. Activate the wheel scrolling and mouse button click events.
ChartSetInteger(0,CHART_EVENT_MOUSE_WHEEL,1);
ChartSetInteger(0,CHART_EVENT_MOUSE_MOVE,1);
Next, we work in the OnChartEvent() function. Check if the button is pressed. If not, display its name on it. If the button is pressed, activate the mode of scrolling the indicator period and disable the scrolling of the chart itself. Accordingly, if the button is not pressed, enable the chart scrolling back.
void OnChartEvent(const int id,
                  const long &lparam,
                  const double &dparam,
                  const string &sparam)
  {
//---
   if(!press_Button)
      ObjectSetString(chart_ID,name,OBJPROP_TEXT,text);
   if(id==CHARTEVENT_OBJECT_CLICK)
     {
      if(sparam==name)
        {
         press_Button=ObjectGetInteger(chart_ID,name,OBJPROP_STATE);
         if(press_Button)
           {
            scroll_Button=true;
            ChartSetInteger(0,CHART_MOUSE_SCROLL,0);
            ChartRedraw();
           }
         else
           {
            scroll_Button=false;
            ChartSetInteger(0,CHART_MOUSE_SCROLL,1);
            ChartRedraw();
           }
        }
     }
  }
If the period scrolling mode is activated, check the mouse wheel status. Depending on its scrolling direction, we add or subtract the period. The total wheel scroll value is triggered when it reaches +120 or -120.
if(scroll_Button)
      if(id==CHARTEVENT_MOUSE_WHEEL)
        {
         int delta = (int)dparam;
         if(delta>119)
            if(period_ma<period_ma_max)
              {
               period_ma+=step;
               ChartRedraw();
              }
         //
         if(delta < -119)
            if(period_ma>step)
              {
               period_ma-=step;
               ChartRedraw();
              }
Here we access the indicator handle with a new period and redraw the indicator line ('total' is defined in OnCalculate). Also, change the button text from the name to the current period.
handle = iMA(_Symbol,_Period,period_ma,0,method_MA,price_MA);

         ArraySetAsSeries(Label1Buffer,true);
         for(int i = 0; i<total; i++)
           {
            double MA[];
            CopyBuffer(handle,0,i,1,MA);
            Label1Buffer[i]=MA[0];

            ChartRedraw();

           }
         ArraySetAsSeries(Label1Buffer,false);
         if(press_Button)
            ObjectSetString(chart_ID,name,OBJPROP_TEXT,IntegerToString(period_ma));
        }
Here we redraw the line so that we do not have to wait for a new tick to display the indicator line with a new period. Thus, the line is always rebuilt instantly regardless of the new tick arrival.
Another limitation that cannot be bypassed concerns the button. If the drag and drop mode is enabled, the button pressing mode is disabled, and vice versa. Therefore, we can drag the button to a more convenient place only once. After disabling the drag and drop mode, we will no longer enable it. During the next initialization, the button will not remember its position and return to its original place in the general row.
if(id==CHARTEVENT_OBJECT_CLICK)
     {
      if(sparam==name)
        {
         long select = ObjectGetInteger(chart_ID,name,OBJPROP_SELECTED);
         if(select==0)
           {
            ObjectSetInteger(chart_ID,name,OBJPROP_SELECTABLE,false);
            ObjectSetInteger(chart_ID,name,OBJPROP_SELECTED,false);
            flag_drag=false;
           }
         ChartRedraw();
         }
      }
The main indicator line is made in OnCalculate(); as usual
total=rates_total-1;
   if(Limit_for_Calc)
      if(total>Limit)
         total=Limit;
   handle = iMA(_Symbol,_Period,period_ma,0,method_MA,price_MA);
   if(handle==INVALID_HANDLE)
     {
      Print("invalid handle ");
      return(rates_total);
     }
   ResetLastError();
   while(BarsCalculated(handle)<=0)
     {
      // indicator values are not calculated yet, try next time
      return(0);
     }

   for(int i = prev_calculated>0?prev_calculated-1:0; i<rates_total; i++)
     {
      double MA[];
      CopyBuffer(handle,0,time[i],1,MA);
      Label1Buffer[i]=MA[0]+level;
     }
Here we can limit the calculation of the line when scrolling only on the latest data to save computational resources. To do this, let a trader select whether they want to enable the calculation limit in the settings and how many bars are to be taken for the calculations.
input bool    Limit_for_Calc = false;
input int     Limit = 20000;
Result
We have analyzed the main points of the indicator development. The result is a full-fledged indicator which is in no way inferior to the standard one, while being more convenient. However, it still has some drawbacks. For example, I experienced a slowdown on the history of more than 20,000 bars. But history analysis is not needed so often, and you can limit the number of bars for calculation for everyday use. Renaming the buttons manually and the inability to drag a button more than once are also pretty inconvenient.
Generally, the goals have been achieved — the indicator smoothly changes the period when scrolling the mouse wheel, while the scrolling function is turned on and off by pressing just one button right on the chart.
Conclusion
Such an interface, although not without flaws, can still be called more convenient than the standard one. It allows traders to get the necessary indicator settings with minimal effort and time, removes same-type indicators from the workspace and provides more accurate signals within a limited period of time in a rapidly changing market.
Indicators created using such an interface are easy to use, intuitive and time-saving. They allow you to concentrate on trading, thereby improving its quality and increasing your productivity.
In addition, this approach allows you to get not only period but also any other settings you want to place on a button or a panel. Such settings may include color, line width, object size, etc. In addition to scrolling, you can use dragging objects, hot keys or simply hovering the cursor over an object or chart area. One of the functions is implemented in the Button MA indicator. It allows you to use period scrolling not only by pressing the button, but also by simply hovering over it. In addition, it remembers the button positions after dragging even if you change the timeframe.
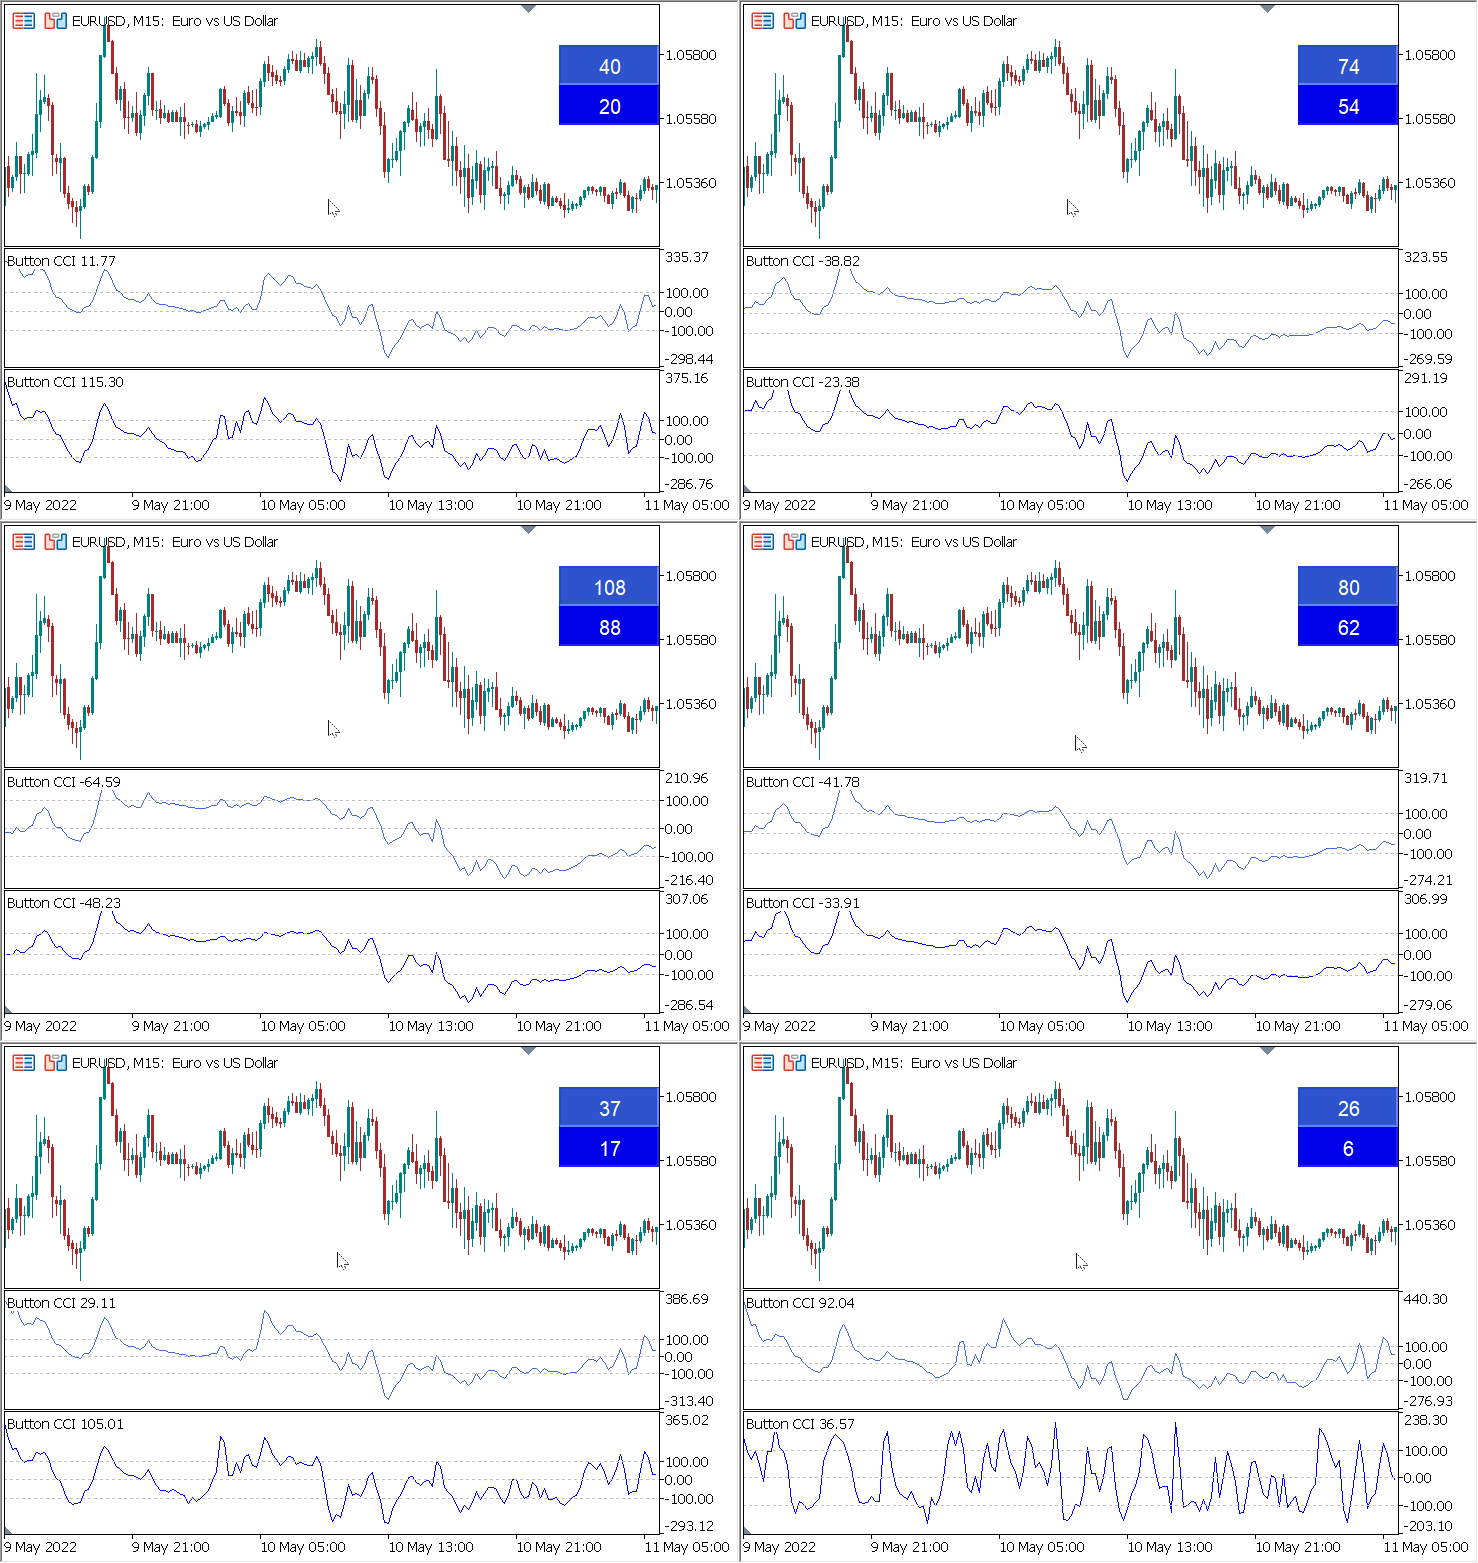
The article covered the basic steps for creating an indicator with period scrolling based on the Moving Average. In the attachment below, you can find the code of the ready-made indicator based on CCI. It is even simpler since the buttons on one chart do not require renaming regardless of their number. Their names are indexed automatically, according to the number of set buttons.
Translated from Russian by MetaQuotes Ltd.
Original article: https://www.mql5.com/ru/articles/10770
Warning: All rights to these materials are reserved by MetaQuotes Ltd. Copying or reprinting of these materials in whole or in part is prohibited.
This article was written by a user of the site and reflects their personal views. MetaQuotes Ltd is not responsible for the accuracy of the information presented, nor for any consequences resulting from the use of the solutions, strategies or recommendations described.
 Neural networks made easy (Part 14): Data clustering
 Learn how to design a trading system by Williams PR
 MQL5 Wizard techniques you should know (Part 02): Kohonen Maps
 Developing a trading Expert Advisor from scratch (Part 13): Time and Trade (II)
- Free trading apps
- Over 8,000 signals for copying
- Economic news for exploring financial markets
You agree to website policy and terms of use