
William Gann methods (Part II): Creating Gann Square indicator

Introduction
William Delbert Gann, a legendary trader and technical analyst of the early 20th century, left behind a rich legacy of market analysis tools and techniques. Among his numerous developments, the Square of 9 occupies a special place. It is a mysterious and multifaceted tool that combines elements of geometry, numerology and astrology.
Gann's Square of 9 is a spiraling number sequence arranged in a 9x9 square. This tool is used to forecast important price levels and time cycles in financial markets. Despite its esoteric nature, Square of 9 continues to attract the attention of modern traders looking for unconventional approaches to market analysis.
In this article, we will dive into the world of Gann's Square of 9 and attempt to bring its concept into the digital age by creating an indicator for the MetaTrader 5 platform using the MQL5 programming language. Our goal is to develop a tool that will allow traders to visualize and apply the principles of the Square of 9 in their trading, combining Gann's wisdom with modern technology.
We will review the theoretical basis of Square of 9, walk through the process of creating the indicator step by step and discuss its practical application and potential limitations. Whether you are an experienced trading system developer or just interested in unconventional methods of market analysis, this article will provide you with valuable information and practical skills to expand your analytical toolbox.
Let's take a fascinating journey in the footsteps of William Gann and create a bridge between his brilliant ideas and the modern world of algorithmic trading.
Theoretical basis of Gann's Square of 9
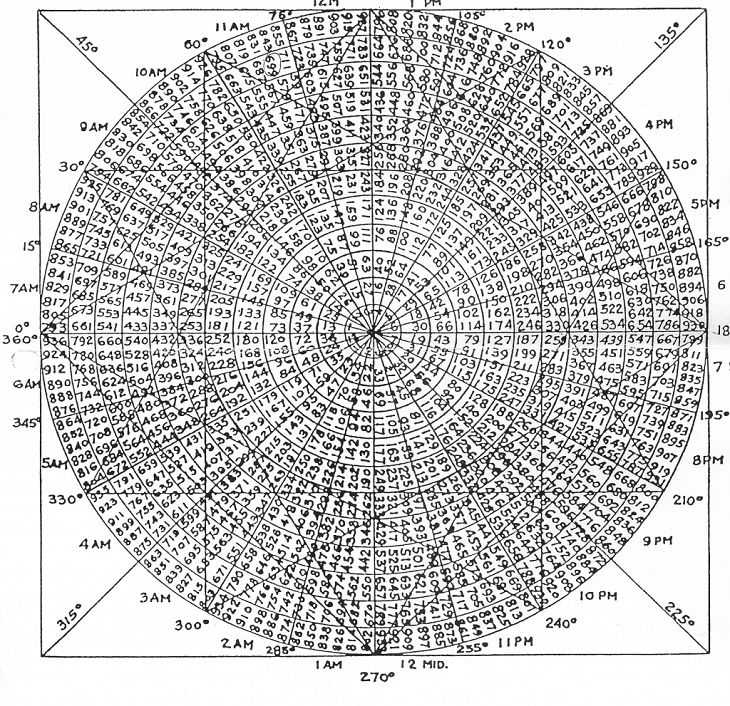
Gann's Square of 9 is a unique technical analysis tool that combines elements of geometry, numerology and astrology. The method is based on the idea that prices and time in financial markets move in spiral patterns that can be represented as a numerical sequence located in a 9x9 square.
The construction of Square 9 begins with the central cell, which is assigned the number 1. The numbers are then arranged in a counter-clockwise spiral, filling the square up to 81 (9x9). Every ninth number in this sequence forms a "cardinal cross" - a key point that Gann considered especially important for market analysis.
According to Gann theory, the numbers in Square of 9 correspond to price levels and time intervals. He believed that the market tended to react to these levels, creating turning points, support or resistance. Particular importance is given to numbers that are on the same line or in harmonious relationships with each other.
Gann also linked the Square of 9 to astrological concepts, stating that the angles between the numbers in the square correspond to certain planetary aspects. This adds a time dimension to the analysis, allowing us to forecast not only price levels but also potential dates of significant market events.
It is important to note that the interpretation of Square of 9 is often subjective and requires experience. Traders use this tool in different ways: some focus on price levels, others on time cycles, and still others combine both approaches.
Despite its esoteric nature, Gann's Square of 9 continues to attract the attention of modern traders. Its value lies in its ability to provide a unique perspective on market movements that can complement traditional technical analysis methods.
In the context of creating a MetaTrader 5 indicator, our task will be to transform these theoretical concepts into algorithms capable of generating specific trading signals and visual representations. This will allow traders to integrate Gann's ideas into the modern digital trading environment.
Mathematical apparatus of Gann's Square of 9
Despite its esoteric roots, Gann's Square of 9 has a clear mathematical structure. Understanding this structure is critical to creating an accurate and efficient indicator. Let's look at the basic mathematical principles underlying the Square of 9:
- Construction of the square - the Square of 9 is a spiral sequence of numbers from 1 to 81, arranged in a 9x9 matrix. Mathematically, this can be represented as a function of the (x, y) coordinates squared.
- Spiral sequence - numbers are arranged in a counter-clockwise spiral. This can be described by parametric equations of the spiral in discrete form.
- Angular relationships - Gann placed special emphasis on angular relationships between numbers. These relationships can be expressed through trigonometric functions, taking into account the position of the squared numbers.
- Price projections - Various mathematical transformations, often involving logarithmic or square roots, are used to convert square numbers into price levels.
- Time cycles - The time aspect of Square of 9 can be expressed through modular arithmetic, where each complete revolution of the spiral corresponds to a certain cycle.
- Cardinal cross - The numbers that form the cardinal cross (every ninth number) can be expressed as an arithmetic progression with a step of 9.
- Harmonic relationships - Harmonic relationships between numbers in a square can be described in terms of simple numerical ratios or angles in degrees.
- Square root of price - Gann often used the square root of price in his calculations, which adds another level of mathematical manipulation.
- Modular arithmetic - Many calculations in Square of 9 are based on the principles of modular arithmetic, especially with modulo 9.
To create an indicator in MQL5, we need to transform these mathematical concepts into specific algorithms. This includes developing functions to generate the Square of 9, calculate angular relationships, project numbers onto a price scale, and determine time cycles.
It is important to note that while the mathematics of the Square of 9 is accurate, its interpretation and application to the markets remains largely subjective. Our goal in creating the indicator is to provide users with a flexible tool that will allow them to experiment with various aspects of Gann Theory, based on precise mathematical calculations.
Preparing to create an indicator
Let's start by defining the basic functions of our Gann's Square of 9 indicator. We will need to plot the square itself on the chart, calculate important price levels and display time cycles. Then we will think about the settings provided to users. These can be: the initial number for Square 9, the scale for converting to prices, and the choice of colors for lines and text.
It is important to plan how we will store data. We will need an array for the Square of 9 numbers, as well as lists to store the calculated prices and dates.
The next step is to develop the basic algorithms. We will need to create functions to generate the Square of 9, translate its numbers into price levels, and calculate dates for time cycles. Let's think about how best to display all this information on the chart. We need to decide how to display Square of 9 itself and where to place price levels and dates.
Let's not forget about testing. Let's prepare methods for checking the accuracy of our calculations and test the indicator on different timeframes. It is also important to study the features of working in MQL5, especially in relation to creating graphical elements and available mathematical functions.
This preparation will lay a solid foundation for creating an efficient and user-friendly Gann's Square of 9 indicator.
Gann's Square of 9 indicator code structure
When developing the Gann's Square of 9 indicator for MetaTrader 5, it is important to create a clear and logical code structure. This will make it easier to understand, debug and further improve the indicator. Let's look at the main components that need to be included in our code.
First, we need to declare and initialize the variables. Let's define global variables to store the indicator settings and create arrays to store Square of 9 data and calculated values.
- The OnInit() function will be used to initialize the indicator parameters and create the necessary graphical objects.
- The OnDeinit() function will clear all created graphical objects when the indicator is deleted.
- The OnCalculate() function is the main function of the indicator, called at every tick. This is where the main calculations will be performed and the display will be updated.
Implementation of the indicator key components
Let's look at the "blank" code for Square of 9:
//+------------------------------------------------------------------+
//|                                                      GannSquare9 |
//|                                          Copyright 2024, Shtenco |
//|                          https://www.mql5.com/ru/users/koshtenko |
//+------------------------------------------------------------------+
#property copyright "Copyright 2023, Evgeniy Koshtenko"
#property link      "https://www.mql5.com/ru/users/koshtenko"
#property version   "1.00"
#property description "Gann Square of 9 Price and Time Levels Indicator"
#property indicator_chart_window

// Input parameters
input double StartNumber = 1;  // Starting number for the Gann Square
input color PriceLevelColor = clrDodgerBlue;  // Color of the price levels
input color TimeLevelColor = clrRed;  // Color of the time levels
input int LevelsToShow = 50;  // Number of levels to display
input datetime EndDate = D'2024.08.14 00:00';  // End date for calculations
input double PriceStepDivisor = 10.0;  // Divisor for price step (higher value = more levels)

// Global variables
double price_levels[];
datetime time_levels[];
double price_scale;
int time_scale;

//+------------------------------------------------------------------+
//| Custom indicator initialization function                         |
//+------------------------------------------------------------------+
int OnInit()
  {
// Validate inputs
   if(StartNumber <= 0 || LevelsToShow <= 0 || EndDate <= 0 || PriceStepDivisor <= 0)
     {
      Print("Invalid input parameters");
      return INIT_PARAMETERS_INCORRECT;
     }

// Calculate scales
   CalculateScales();

// Calculate and draw levels
   CalculateLevels();
   DrawLevels();

   return(INIT_SUCCEEDED);
  }

//+------------------------------------------------------------------+
//| Custom indicator iteration function                              |
//+------------------------------------------------------------------+
int OnCalculate(const int rates_total,
                const int prev_calculated,
                const datetime &time[],
                const double &open[],
                const double &high[],
                const double &low[],
                const double &close[],
                const long &tick_volume[],
                const long &volume[],
                const int &spread[])
  {
// No calculations needed for this indicator
   return(rates_total);
  }

//+------------------------------------------------------------------+
//| Calculate price and time scales                                  |
//+------------------------------------------------------------------+
void CalculateScales()
  {
   double current_price = SymbolInfoDouble(_Symbol, SYMBOL_BID);
   price_scale = current_price / (StartNumber * StartNumber);

   datetime current_time = TimeCurrent();
   time_scale = (int)MathMax(1, (EndDate - current_time) / (86400 * StartNumber * StartNumber));  // in days
  }

//+------------------------------------------------------------------+
//| Calculate price and time levels                                  |
//+------------------------------------------------------------------+
void CalculateLevels()
  {
   ArrayResize(price_levels, LevelsToShow);
   ArrayResize(time_levels, LevelsToShow);

   for(int i = 0; i < LevelsToShow; i++)
     {
      double price_square = MathPow(StartNumber + i / PriceStepDivisor, 2);
      int time_square = (StartNumber + i) * (StartNumber + i);

      price_levels[i] = price_scale * price_square;
      time_levels[i] = EndDate - time_scale * time_square * 86400;  // Convert days to seconds
     }
  }

//+------------------------------------------------------------------+
//| Draw levels on the chart                                         |
//+------------------------------------------------------------------+
void DrawLevels()
  {
   for(int i = 0; i < LevelsToShow; i++)
     {
      // Draw price level
      string price_name = "GannPriceLevel_" + IntegerToString(i);
      ObjectCreate(0, price_name, OBJ_HLINE, 0, 0, price_levels[i]);
      ObjectSetInteger(0, price_name, OBJPROP_COLOR, PriceLevelColor);
      ObjectSetInteger(0, price_name, OBJPROP_STYLE, STYLE_SOLID);
      ObjectSetInteger(0, price_name, OBJPROP_WIDTH, 1);
      ObjectSetString(0, price_name, OBJPROP_TOOLTIP, "Gann Price Level " + DoubleToString(price_levels[i], _Digits));

      // Draw time level
      string time_name = "GannTimeLevel_" + IntegerToString(i);
      ObjectCreate(0, time_name, OBJ_VLINE, 0, time_levels[i], 0);
      ObjectSetInteger(0, time_name, OBJPROP_COLOR, TimeLevelColor);
      ObjectSetInteger(0, time_name, OBJPROP_STYLE, STYLE_DOT);
      ObjectSetInteger(0, time_name, OBJPROP_WIDTH, 1);
      ObjectSetString(0, time_name, OBJPROP_TOOLTIP, "Gann Time Level " + TimeToString(time_levels[i], TIME_DATE|TIME_MINUTES));
     }
  }

//+------------------------------------------------------------------+
//| Custom indicator deinitialization function                       |
//+------------------------------------------------------------------+
void OnDeinit(const int reason)
  {
   ObjectsDeleteAll(0, "GannPriceLevel_");
   ObjectsDeleteAll(0, "GannTimeLevel_");
  }
//+------------------------------------------------------------------+
This indicator is a modern interpretation of William Gann's Square of 9 concept, adapted for the MetaTrader 5 platform. It visualizes price and time levels based on Gann principles, providing traders with a unique tool for market analysis and trading decisions.
Indicator inputs:
- StartNumber — initial number for constructing Square of 9,
- PriceLevelColor and TimeLevelColor — colors for displaying price and time levels, respectively,
- LevelsToShow — number of levels to display,
- EndDate — end date for calculations and testing on historical data,
- PriceStepDivisor — frequency of price levels.
Global variables are used to store and process data. The price_levels[] and time_levels[] arrays store the calculated price and time levels, respectively. The price_scale and time_scale variables are used to scale price and time values.
The CalculateScales() function automatically determines the scales for price and time based on the current price of the instrument and the specified end date. CalculateLevels() performs price and time level calculations. Price levels are calculated using a quadratic function and an additional divisor to increase the frequency of levels, while time levels are based on the square of a number, which is in line with Gann Theory. DrawLevels() is responsible for visualizing the data by creating horizontal lines for price levels and vertical lines for time levels on the chart.
The indicator provides traders with a visual representation of price and time levels based on the principles of Gann's Square of 9. This can be especially useful for traders interested in non-traditional technical analysis methods and looking for additional tools to confirm their trading ideas.
The features of this implementation include the ability to customize the frequency of price levels for more detailed analysis, flexibility in choosing the end date for historical analysis, and a combination of price and time levels on a single chart.
Possible improvements to the indicator may include adding alerts when price or time reaches key levels, implementing automatic updating of levels when price changes significantly, integration with other Gann analysis methods to create a comprehensive trading system, and optimizing performance to work on larger timeframes and with a large number of levels.
Visualizing Square of 9 levels on the chart
Price levels are displayed as horizontal lines on the chart. Each line represents a potential support or resistance level calculated based on the principles of Gann's Square of 9. The color of these lines is determined by the custom PriceLevelColor parameter, allowing traders to customize the display to their preferences and chart style. The horizontal lines are distributed along the vertical axis of the chart, with their density controlled by the PriceStepDivisor parameter. This allows traders to adjust the number of price levels displayed, finding a balance between detail and chart readability.
Time levels are visualized as vertical lines on the chart. These lines represent key time points based on the quadratic progression of Gann numbers. The color of the time lines is set by the TimeLevelColor parameter, which makes it easy to distinguish them from the price levels. Vertical lines are distributed along the horizontal axis of the chart, starting from the specified end date (the EndDate parameter) and moving backwards in time. This gives traders the ability to see potential reversal points or significant dates in the future, as well as analyze historical data.
Time squaring and time cycles
Time squaring and time cycles are key concepts in William Gann's theory, which are reflected in the Square of 9. These ideas are based on the assumption that market movements follow certain time patterns that can be predicted and used to make trading decisions.
time_scale = (int)MathMax(1, (EndDate - current_time) / (86400 * StartNumber * StartNumber)); // in days
The concept of time squaring suggests that significant market events often occur at intervals that are squares of whole numbers. For example, major market turns may occur at 4, 9, 16, 25, 36, 49, 64, 81 days or longer periods based on these numbers. In the context of Square of 9, these numbers correspond to key points of the spiral.
The equation is the key element in calculating the time scale for the Gann's Square of 9 indicator. Let's take a look at its components and meaning:
- EndDate − current_time: This is the difference between the specified end date and the current time. The result is expressed in seconds.
- 86400: this is the number of seconds in one day (24 hours * 60 minutes * 60 seconds).
- StartNumber * StartNumber: This is the square of the starting number that is used to scale the timeline.
- (EndDate − current_time) / (86400 * StartNumber * StartNumber): This part of the equation converts the time difference from seconds to days, then divides it by the square of the starting number. This creates a non-linear time scale consistent with the principles of Gann's Square of 9.
- MathMax(1, ...): This function ensures that the result is at least 1. This prevents division by zero or negative values.
- (int): Casting the result to an integer type, since the timeline should be expressed in whole days.
The idea behind this equation is to create a timeline that gets shorter as it gets closer to the current date. This reflects Gann's concept of the acceleration of time and market cycles.
The larger the StartNumber, the more compressed the timeline will be. This allows traders to customize the indicator for different trading time horizons.
Using the square of StartNumber (StartNumber * StartNumber) in the denominator creates a non-linear distribution of time levels, which is consistent with the principles of Gann's Square of 9, where the importance of numbers increases quadratically.
Acceleration of time cycles along with acceleration of market cycles
One of the interesting features of this indicator is that the time cycles, based on the principles of Gann's Square of 9, are positioned closer to each other as they approach the current date. This phenomenon can be interpreted as a reflection of the acceleration of market cycles observed in the modern financial environment.
In recent decades, we have indeed seen a significant acceleration of market processes. Stock market crashes, which used to happen every few years or even decades, are now happening much more frequently. This can be attributed to a number of factors, including the globalization of financial markets, the development of information technology and algorithmic trading, and the increased speed of information dissemination. Perhaps, this happens due to the gradual movement towards technological singularity.
Gann's Square of 9 indicator indirectly reflects this acceleration by displaying time cycles that are compressing closer to the present time. This visual representation can help traders better understand and adapt to today's fast-paced market environment where cycles occur at an ever-increasing rate.
This acceleration can be seen as a sign of technological development and the evolution of financial markets. With the advent of high-frequency trading, instant news dissemination via social media, and the increased availability of trading platforms for retail investors, markets have become more responsive to events than ever before. Trends used to be much longer lasting and more predictable.
It is important to note that while the indicator reflects this acceleration, it does not directly predict it. Rather, it provides a visual tool that can help traders understand and integrate the concept of accelerating market cycles into their analysis.
Indicator testing
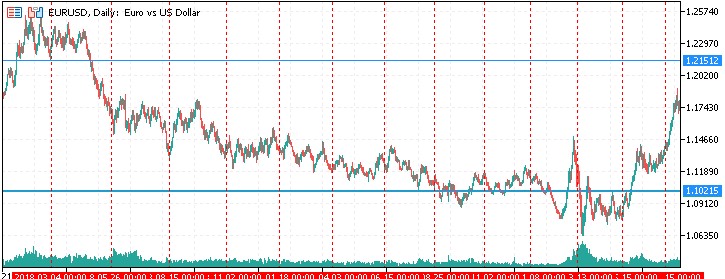
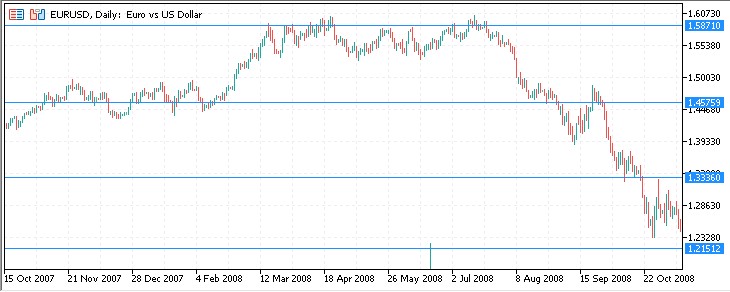
Let's look at the results of the indicator on historical data. We chose EURUSD as an asset, and 1.00 as the starting point for calculating levels.
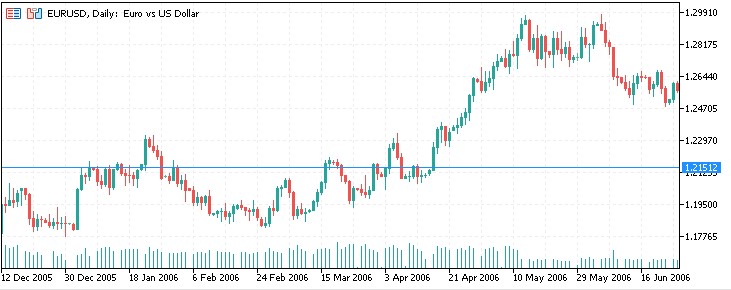
Another segment:

And one more:
2008:
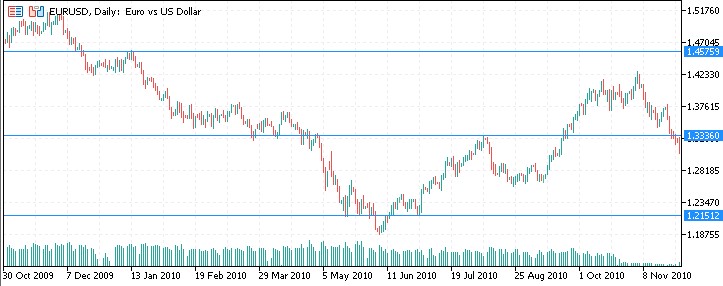
2010, we see a reaction to the levels again:
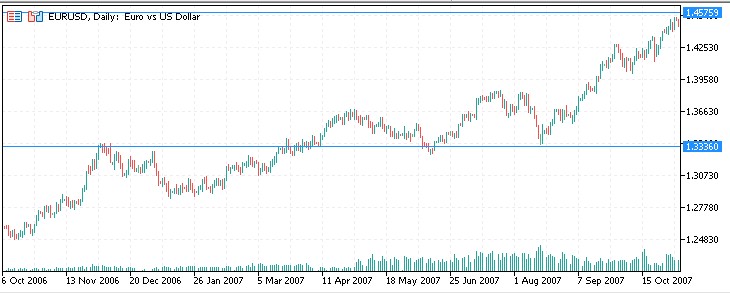
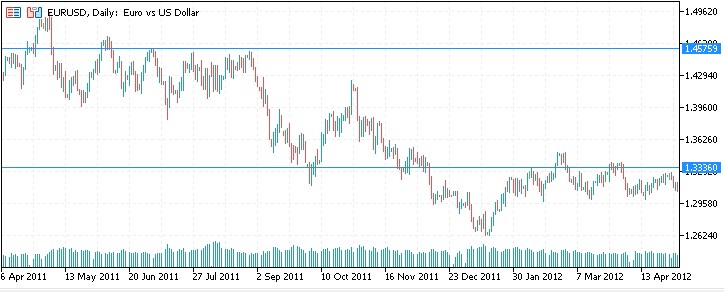
2011:
2012:

2020:
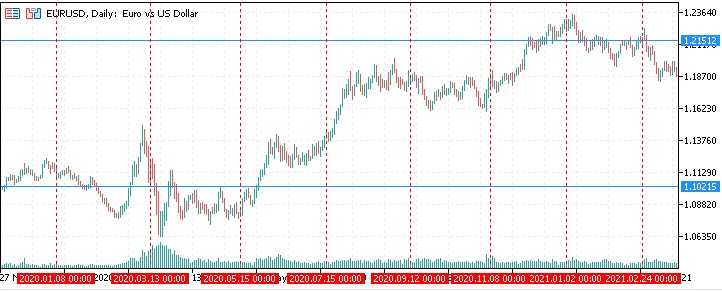
Current period: Right now EURUSD is right at the level of Gann's Square of 9.
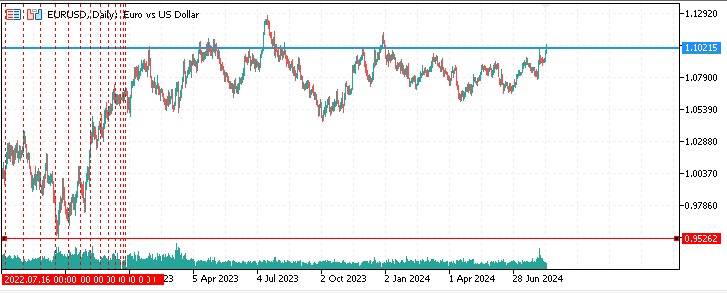
As for time cycles by time squaring, I did not notice any statistically significant price reactions to them.
Possible improvements
An interesting option seems to be adding alerts when the price touches the Square of 9 level. It is also possible to add auto-recalculation of square levels when updating prices.
It would also be interesting to implement the Gann box and the Gann grid in the form of indicators, and combine all the developments into one complex system.
Prospects for creating an EA based on Square of 9
It is also possible to create an EA based on a rebound from the square levels. I see it as a semi-automatic EA possibly linked to chart objects. Such an EA could make the traders' work easier by following their trading instructions from one level or another.
Conclusion
The development of the Gann's Square of 9 indicator for the MetaTrader 5 platform is an interesting and ambitious project that combines classical ideas of technical analysis with modern trading technologies. This indicator provides traders with a unique market analysis tool that combines elements of price and time analysis.
The implementation of the Square of 9 concept in the form of a digital indicator makes this complex theory more accessible and applicable to a wide range of traders. The ability to visualize price and time levels on a single chart allows for a comprehensive analysis of market movements, which can be especially useful in the context of today's rapidly changing markets.
It is important to note that despite its mathematical basis, the interpretation of Gann's Square of 9 signals remains largely subjective.
Overall, this project demonstrates how historical methods of technical analysis can be adapted to modern trading technologies, creating new tools for traders. This highlights the enduring value of classical ideas and their potential in the context of modern financial markets.
Translated from Russian by MetaQuotes Ltd.
Original article: https://www.mql5.com/ru/articles/15566
Warning: All rights to these materials are reserved by MetaQuotes Ltd. Copying or reprinting of these materials in whole or in part is prohibited.
This article was written by a user of the site and reflects their personal views. MetaQuotes Ltd is not responsible for the accuracy of the information presented, nor for any consequences resulting from the use of the solutions, strategies or recommendations described.

- Free trading apps
- Over 8,000 signals for copying
- Economic news for exploring financial markets
You agree to website policy and terms of use