
Price Action Analysis Toolkit Development (Part 53): Pattern Density Heatmap for Support and Resistance Zone Discovery

Introduction
In part 51 of our Price Action Analysis Toolkit Development series, we introduced a tool that scans and highlights candlestick patterns directly on the chart. The logic was simple yet powerful—type a pattern name, press the search button, and the tool would locate all historical occurrences within a defined lookback period, continue monitoring, and alert in real time whenever the pattern re‑formed. At that time, the focus was purely on identifying patterns themselves. Little did I realize that those historical detections could serve a much greater purpose: revealing price levels where the market has shown repeated reactions. Over time, such levels often behave as support—a floor where price tends to bounce upwards—or resistance—a ceiling where price tends to reverse downwards. Knowing these levels in advance allows traders to anticipate market behavior, refine entry and exit timing, place stops more strategically, and avoid trading blindly into high‑reaction areas.
Recognizing this, the next logical step was to develop a system that transforms past candlestick detections into price density zones, then monitors how upcoming price movement interacts with them. This can help traders act proactively when price approaches a statistically significant level instead of reacting too late.
In this article, we introduce the Pattern Density Heatmap, a tool that automatically creates and visualizes these zones from prior candlestick activity, tracks future price movements around them, and triggers alerts when price nears each zone. We begin with an overview and purpose, then examine the MQL5 implementation, discuss the outcomes, and finally draw our conclusion.
Below is the Table of Contents, followed by detailed coverage of each section.
Overview and Purpose
In trading, recognizing a single candlestick pattern can be useful, but it’s the story told by repeated patterns at the same prices that reveals the more in-depth market structure.
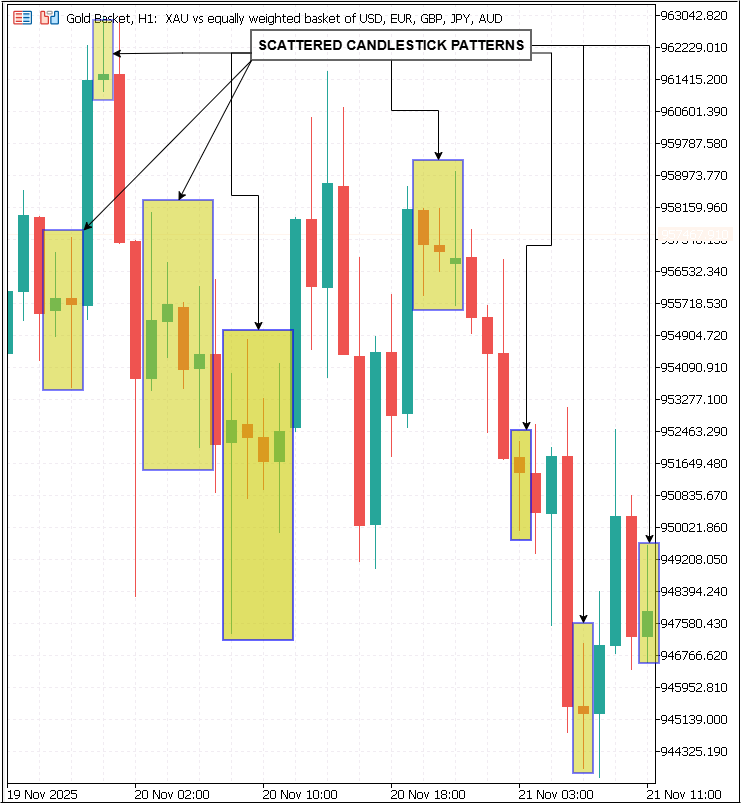
The Pattern Density Heatmap is built around that idea. Rather than marking each formation as an isolated event, it captures and visualizes the price zones where multiple patterns have clustered over time.
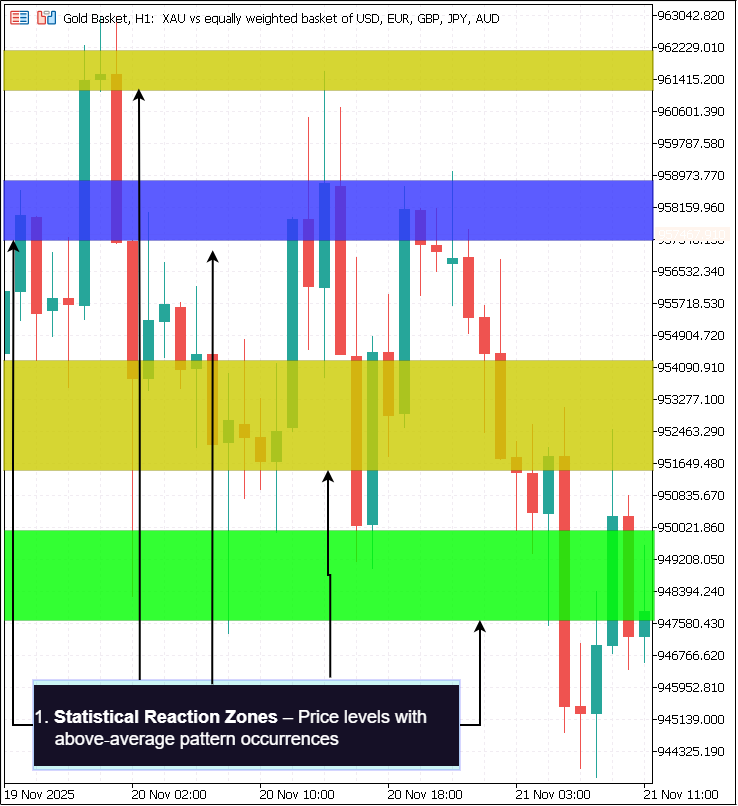
These clusters are rarely accidental; they form around levels where order flow has consistently shifted, creating areas that act as dynamic support or resistance. Because the map adapts to recent market behavior, it reflects where participants have historically committed to positions with conviction—and where they may do so again.
From Pattern Detection to Price Mapping
Most pattern recognition tools simply mark individual candles where a pattern has appeared. While helpful, this “point-and-mark” approach lacks more profound market context, offering no information about how often similar reactions occur at comparable price levels. The Pattern Density Heatmap addresses this gap by scanning extensive historical data—often thousands of bars—and logging every detection price from multiple pattern checks. These raw detection points are then aggregated into discrete price bins, grouping them into ranges that represent repeat-response levels in the market.
Once grouped, each bin is scored based on
- The raw number of detections inside it.
- How recent those detections were, giving extra weight to fresh market reactions.
This creates a statistical “map” of market responses that turns raw visual pattern spotting into quantified market behavior.
Why These Zones Matter
Price zones derived from repeated market reactions provide several trading advantages that single detections cannot match.
- Anticipation over reaction—High-density zones allow traders to prepare in advance. If price approaches such an area, one can anticipate potential rejection or breakout behavior and plan entries or exits accordingly.
- Better risk placement—Stop-loss orders positioned beyond strong zones are less likely to be caught by random volatility spikes, improving both trade survivability and risk-adjusted return.
- Synergy with other tools—Many statistically strong zones align naturally with other analytical frameworks such as Fibonacci retracements, moving averages, pivot points, or trendlines. This alignment, known as confluence, can dramatically increase the probability that the zone holds.
- Objectivity—Because these zones are formed from actual historical responses rather than subjective visually drawn lines, they reduce bias. Traders across skill levels see the same data-driven levels.
Higher‑Timeframe Integration
Market structure is multi-layered, with significant levels visible on broader timeframes sometimes acting as dominant forces over intraday action. The heatmap can verify its zones using candlestick patterns detected on a higher timeframe (HTF). When a zone appears both in the trading timeframe and in a larger context—for example, a daily chart confirming a zone seen on H1—it gains added significance. This multi‑timeframe confluence is often a deciding factor in professional trade planning, signaling areas of strong order clustering across different market participants.
Purpose Across Trading Styles
Because it is parameter-driven and output-agnostic, the Pattern Density Heatmap adapts well to different trading approaches
1. Swing Trading
- Traders working on Daily or 4‑hour charts can scan wide historical ranges, mapping medium‑term market reaction zones. Alerts can notify them hours or days ahead when the price is approaching these areas, giving ample time to plan position entries or exits.
2. Scalping
- Short-term traders benefit from rapidly updated density zones on intraday charts. These zones identify high-probability turning points invisible on larger frames but critical for quick trade decisions.
3. Algorithmic Trading
- The tool’s ability to export full detection datasets as CSV files makes it highly attractive for systematic modeling. Quantitative developers can feed the exported data into statistical engines or machine learning models, scoring zones, optimizing entries, and integrating them into automated execution logic.
| Style | LookbackBars | Bincount | HTF Confirm | Benefit |
|---|---|---|---|---|
| Swing Trader | 2000 | 40 | Yes | Plan days ahead |
| Scalper | 500 | 25 | No | Intraday reversal points |
| Algo Trader | 3000 | 50 | Yes | Quantitative integration |
Replacing Subjectivity with Data-Driven Precision
Perhaps the most valuable contribution of the Pattern Density Heatmap is its ability to remove guesswork from support/resistance mapping. Where traditional discretionary trading relies heavily on “eyeballing” historical highs and lows, this tool produces levels derived entirely from quantifiable repeated behaviors in the price history. The trader still benefits from the intuitive clarity of a heatmap overlay, but behind every highlighted band and zone is a numerical record of how often, how recently, and with what diversity the market has reacted there.
By bringing statistical rigor to a traditionally visual discipline, the heatmap bridges the gap between classic price action trading and modern quantitative analysis—giving traders a repeatable, empirically based map of where to expect the market’s next significant move.
MQL5 Implementation
Developing the Pattern Density Heatmap as an EA in MQL5 starts with a methodical design: defining the user-configurable parameters, preparing the runtime environment, building an interactive chart-based control interface, implementing the pattern scanning engine, and supporting it with higher-timeframe confirmation, real-time alerting, precise visual rendering, and optional data export. The source code reflects this workflow through clearly segmented functions that work together seamlessly.
The process begins in MetaEditor, which is launched from MetaTrader 5 via the F4 shortcut. We create a new Expert Advisor template, name it PatternDensityHeatmap.mq5, then define basic properties such as copyright, link, and version using #property directives. These metadata entries are important for intellectual property attribution, version tracking, and linking readers back to updates or the author’s page on MQL5.com.
#property copyright "Copyright 2025, MetaQuotes Ltd."
#property link      "https://www.mql5.com/en/users/lynnchris"
#property version   "1.00"
Next, we establish the EA’s input parameters—these are the settings traders can adjust from the EA properties dialog before attaching it to a chart. The parameters are organized into functional groups to improve user clarity. Detection-related inputs include the PatternName string, which may hold multiple comma-separated pattern identifiers (e.g., "hammer,doji"), a LookbackBars integer specifying how many historical bars to search, and BinCount determining the resolution of vertical segmentation of the price range into discrete bins. MinHitsToShow sets the threshold number of pattern hits required for a bin to qualify as a visible zone.
input string PatternName  = "hammer,doji";
input int    LookbackBars = 2000;
input int    BinCount     = 40;
input int    MinHitsToShow= 2;
Display and weighting controls specify how the resulting zones appear, starting from ZoneBaseColor for their base tone to ShowSeparateLayers for displaying each pattern type separately, and UseRecencyDecay with DecayHalfLife to apply statistical decay weighting that prioritizes recent detections over older ones.
input color ZoneBaseColor      = clrDodgerBlue;
input bool  ShowSeparateLayers = true;
input bool  UseRecencyDecay    = true;
input double DecayHalfLife     = 250.0;
Higher-timeframe and alert parameters define optional multi-timeframe confirmation (HTF_Timeframe and HTF_ConfirmZones), proximity sensitivity (ApproachThresholdPips), and cooldown times (ZoneAlertCooldown).
input ENUM_TIMEFRAMES HTF_Timeframe = PERIOD_H1;
input bool HTF_ConfirmZones         = false;
input int  ApproachThresholdPips    = 8;
input int  ZoneAlertCooldown        = 300;
Marker styling inputs, such as ShowPatternMarkers, MarkerColor, and MarkerOpacity, tune the exact candle markers drawn when detections occur. Finally, export options (ExportCSV, CSVFileName, AppendCSV) allow the EA to save its detection records for offline analysis, appending to or overwriting existing data.
input bool   ShowPatternMarkers = true;
input color  MarkerColor        = clrGold;
input int    MarkerOpacity      = 30;
input bool   ExportCSV          = true;
input string CSVFileName        = "pattern_detections.csv";
input bool   AppendCSV          = true;
Following the parameter declarations, the code sets up runtime variables to store the current state. These include boolean toggles mirroring the inputs, ensuring that when a user clicks a button on the chart to enable or disable a feature, the change is registered immediately without removing and reattaching the EA. Arrays are declared to store market data (MqlRates g_rates[]), the detected pattern names (g_patterns[]), per-pattern hit counters (g_pattern_hits[]), and bin tallies (g_bins_flat[]). Detection logs are managed in the Detection g_detections[] structure, containing each pattern’s name, time, price, and decay weight. The code also keeps track of alert history in an array g_alert_sent[] to avoid repeated notifications for the same zone on each tick.
bool runtime_UseRecencyDecay;
MqlRates g_rates[];
string   g_patterns[];
int      g_pattern_hits[];
int      g_bins_flat[];
Detection g_detections[];
bool     g_alert_sent[];
The initialization routine OnInit() is called when the EA starts. It first synchronizes runtime toggles with the values set in the input parameters, adjusts the alert tracking arrays to match the maximum zones available, and calls ParsePatternList() to convert the comma-separated pattern string into a usable array of lowercase names, assigning each a distinct color from a preset palette. It then builds the on-chart control panel by invoking CreateCompactUI(), which lays out small clickable buttons along the chart’s edge, allowing the trader to rescan, clear zones, toggle features, and show or hide the legend or markers at will. If the AutoRescanOnStart option is enabled, the EA sleeps briefly (to ensure chart readiness) and runs its scanning engine immediately, so that results are visible as soon as it is attached.
int OnInit()
{
   runtime_UseRecencyDecay = UseRecencyDecay;
   ArrayResize(g_alert_sent, MaxZonesToDraw);
   ParsePatternList();
   CreateCompactUI();
   if(AutoRescanOnStart) { Sleep(100); ScanAndDraw(); }
   return INIT_SUCCEEDED;
}
Interactivity is handled by OnChartEvent(), which listens for object click events and compares them against known button names, such as OBJ_BTN_RESCAN or OBJ_TG_DECAY. When a match is found, the corresponding runtime toggle is flipped, the status text is updated, and AutoRescanIfAllowed() runs if the user has enabled instant rescanning upon toggle changes. This architectural choice turns the EA into a live, user-driven system where each parameter can be changed mid-session from the chart without diving back into the properties dialog.
void OnChartEvent(int id, const long &lparam, const double &dparam, const string &sparam)
{
   if(sparam == OBJ_BTN_RESCAN) ScanAndDraw();
   else if(sparam == OBJ_TG_DECAY)
   {
      runtime_UseRecencyDecay = !runtime_UseRecencyDecay;
      AutoRescanIfAllowed();
   }
}
The UI creation functions (CreateTinyButtonIfMissing and UpdateToggleButtons) ensure that each control button exists, has the proper label, color-coding for ON/OFF states, and is placed correctly in the chart coordinates. They also manage the status box, showing current configuration settings and scan summaries in a neat overlay when toggled.
CreateTinyButtonIfMissing(OBJ_BTN_RESCAN, 8, 8, 84, 20, "Rescan");
CreateTinyButtonIfMissing(OBJ_TG_DECAY,   98, 8, 84, 20, "Decay");
The pattern parsing step, encapsulated in ParsePatternList(), is key to the scanning logic. It handles splitting user input like "hammer, doji" into array entries, removes empty strings, converts names to lowercase for matching, assigns them alternating colours from a palette, and initializes all counters. The bin array (g_bins_flat) is also reset here, sized to patterns_count × BinCount, ready to accumulate detections.
int n = StringSplit(PatternName, ',', parts);
for(int p=0; p<n; p++)
{
   g_patterns[p] = ConvertToLower(parts[p]);
   g_pattern_colors[p] = palette[p % ArraySize(palette)];
}
ArrayResize(g_bins_flat, g_patterns_count * BinCount);
ArrayInitialize(g_bins_flat, 0);
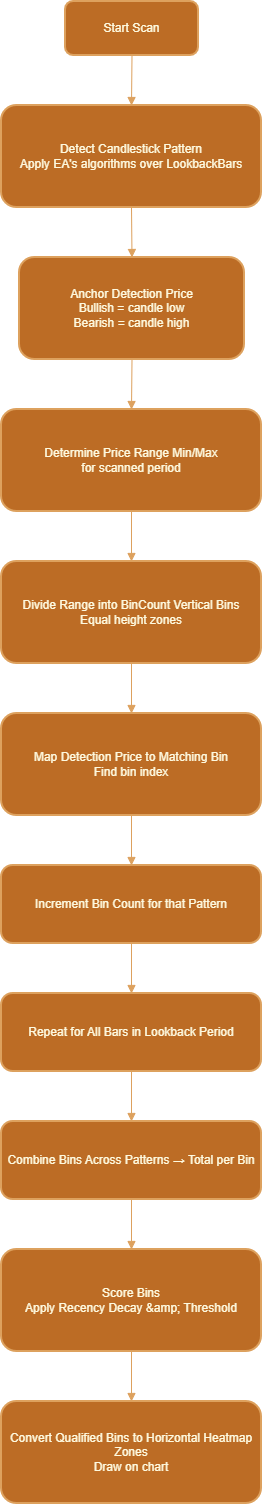
The core detection and rendering engine, ScanAndDraw(), is the most substantial part of the EA. It starts by updating the status display to “Scanning...” and calculates safe defaults for lookback bars and bin numbers. It parses the patterns again to ensure the arrays are in sync, clears previous detections, and allocates space for market data. Using CopyRates(), it loads OHLC price data for the specified lookback period, determines the minimum and maximum prices to establish the bin height, and calculates the bin size.
Then it loops backward through each bar in the lookback, and through each pattern, calling IsPatternAtIndex() to see if the bar matches the criteria for that candlestick type. When matches are found, hit counts are incremented, the detection price is anchored per polarity rules (bullish patterns to candle lows, bearish to highs), and the bin index for that price is computed. Recency decay weighting is applied as a multiplier, making recent bars contribute more “weight” to their bins. Bins are incremented accordingly, and if CSV export or markers are enabled, a detection record is saved to g_detections[].
g_rates_copied = CopyRates(_Symbol, _Period, 0, barsToCopy, g_rates);
for(int bar=1; bar<lookback && bar<g_rates_copied; ++bar)
{
   for(int p=0; p<g_patterns_count; ++p)
   {
      if(IsPatternAtIndex(g_patterns[p], bar, g_rates))
      {
         int binIndex = (int)MathFloor((pricePoint - g_price_min) / binSize);
         g_bins_flat[p*BinCount + binIndex] += intContrib;
      }
   }
}
When all bars are processed, bins are combined across patterns into combinedBins, and any bin meeting the scaled minimum hits threshold becomes a ZoneRec structure, holding bin index, hit count, price range, score placeholder, HTF confirmation flag, and last alert time.
for(int b=0; b<BinCount; ++b)
{
   int sum = 0;
   for(int p=0; p<g_patterns_count; ++p)
      sum += g_bins_flat[p*BinCount + b];
   combinedBins[b] = sum;
   if(combinedBins[b] >= scaledMinHits)
   {
      ZoneRec z; z.bin = b; z.count = sum;
      z.low = g_price_min + b*binSize; z.high = z.low + binSize;
      zones[zoneCount++] = z;
   }
}
If higher-timeframe confirmation is requested, the EA calls ConfirmZonesWithHTF() to run a similar detection loop on a second dataset from the chosen HTF, marking zones that see pattern hits in that bigger picture as confirmed.
if(IsPatternAtIndex(g_patterns[p], bar, htf_rates) &&
   pricePoint >= zones[z].low && pricePoint <= zones[z].high)
   zones[z].htf_confirmed = true;
Zone scores are then computed: scaling raw hit counts to a range of 1–100, applying a small boost if HTF-confirmed, and filtering out unconfirmed zones in strict mode.
double base = zones[i].count;
double factor = zones[i].htf_confirmed ? 1.4 : 1.0;
zones[i].score = (int)MathRound((base / maxRaw) * 100 * factor);
Zones are sorted by hit count in descending order, limited to MaxZonesToDraw, and drawn onto the chart as semi-transparent rectangles spanning their price range, with opacity proportional to hit strength. Each has an OBJ_LABEL displaying its index, hits, score, HTF status, and midpoint price.
color pc = MakeColorWithAlpha(g_pattern_colors[p], alpha);
ObjectCreate(0, obj, OBJ_RECTANGLE, 0, time_left, lowP, time_right, highP);
ObjectSetInteger(0, obj, OBJPROP_COLOR, pc);
If ShowSeparateLayers is toggled ON, additional rectangles in per-pattern colours are drawn over their contributing bins, providing granularity on pattern composition.
color pc = MakeColorWithAlpha(g_pattern_colors[p], alpha);
ObjectCreate(0, obj, OBJ_RECTANGLE, 0, time_left, lowP, time_right, highP);
ObjectSetInteger(0, obj, OBJPROP_COLOR, pc);
For traders auditing results, DrawPerfectPatternMarkers() frames the exact candles that caused detections, optionally filled with semi-transparent colour.
ObjectCreate(chartId, markerName, OBJ_RECTANGLE, 0, startTime, candle.low, endTime, candle.high);
Finally, if ShowLegend is true, DrawPatternLegend() lists all patterns with their total hit counts in a left-corner overlay, and if CSV export is enabled, ExportDetectionsToCSV() writes the detection records to the designated file.
ObjectSetString(0, nm, OBJPROP_TEXT, StringFormat("%s : %d", g_patterns[p], g_pattern_hits[p]));
The EA’s alerting mechanism is designed for precision and minimal noise. After zones are drawn, g_alert_sent[] is reset, and if alerts are enabled, the EA calls CheckAndAlertApproachingZones() to compare the current bid price to each zone’s midpoint. If the absolute distance is less than the pip threshold and the cooldown has expired, and if HTF rules are satisfied, a single alert is triggered. This alert includes the zone ID, symbol, timeframe, midpoint price, score, and HTF confirmation status; plays a sound if configured; and sends a push notification if the terminal allows. Importantly, the alert flag for that zone is set so no further alerts occur until price moves away beyond the threshold and returns again, making alerts deterministic and actionable.
if(dist <= tol && !g_alert_sent[i])
{
   Alert(msg);
   g_alert_sent[i] = true;
}
In addition to ScanAndDraw() and alert functions, the EA implements pattern detection helpers for each candlestick type, e.g., CheckHammerFromArray() compares candle body size to total range and shadow ratios to precisely identify true hammers per accepted trading definitions. These checks prevent false positives from “look-alike” candles lacking proper reversal geometry. Similar functions exist for doji, inverted hammer, engulfing patterns, morning star, evening star, tweezers, spinning tops, and marubozu, each crafted with quantitative rules for open/close relationships and shadow proportions.
return (body/range<0.35 && lowerShadow>=1.8*body && upperShadow<=0.6*body);
By combining rigorous detection algorithms with real-time monitoring, on-chart interactivity, clear visualization, and statistical export, the Pattern Density Heatmap EA provides traders with a dynamic, data-driven map of where key candlestick patterns cluster in price history, turning that information into forward-looking support and resistance zones, and arming them with the alerts to act as price approaches these levels again.
Outcomes
This section presents the visual and quantitative results produced by the PatternDensityHeatmap.mq5 EA. You’ll find a clear description of what each figure shows, how the outputs were generated, the test parameters used, practical notes for running the tool, and key takeaways from single‑pattern tests.
Overview
The animation and screenshots below, illustrate the EA scanning price history, detecting candlestick patterns, aggregating detection points into price bins, and drawing density zones.
- Zone thickness and opacity reflect detection strength.
- Optional per‑pattern layers reveal which patterns contribute to a zone.
- Framed markers validate exact candle matches.
- Right‑hand labels display hits, score, and HTF confirmation for straightforward verification.
The sequence demonstrates both:
- Composite multi‑pattern scans
- Targeted single‑pattern tests (hammer and doji)
Full Rescan Animation (Composite Patterns)
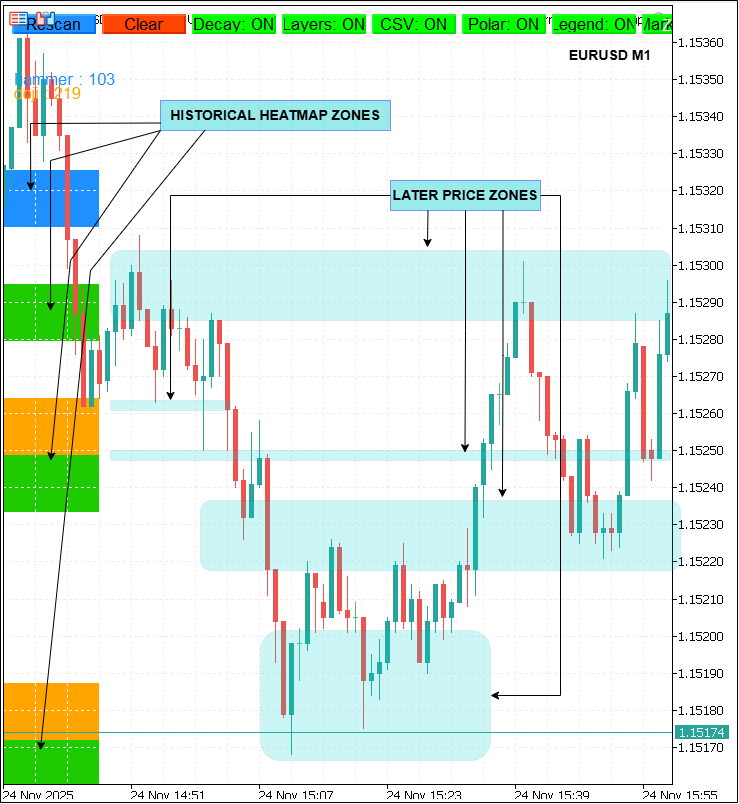
A full rescan and draw pass with PatternName = "hammer, doji". Zones form live on the chart, per‑pattern layers appear, and markers frame exact candles. Shows how composite heatmaps emerge from multiple pattern types and how UI toggles (Rescan, Layers, Decay, CSV, Polarity, Legend, Markers) update in real time.
The figure above, Pattern Density Heatmap in action (composite). Rescan converts pattern detections into color‑graded zones; per‑pattern layers and framed markers highlight contributor breakdown and exact candle matches.
Hammer (Single‑Pattern Test)
- Heatmap produced with PatternName = "hammer" only.
- Shows the primary hammer cluster with EA hit count (hammer: 29).
- Use this view to check if hammer clusters align with price reaction levels (support) and to fine‑tune bin sizing and hit threshold for greater zone precision.
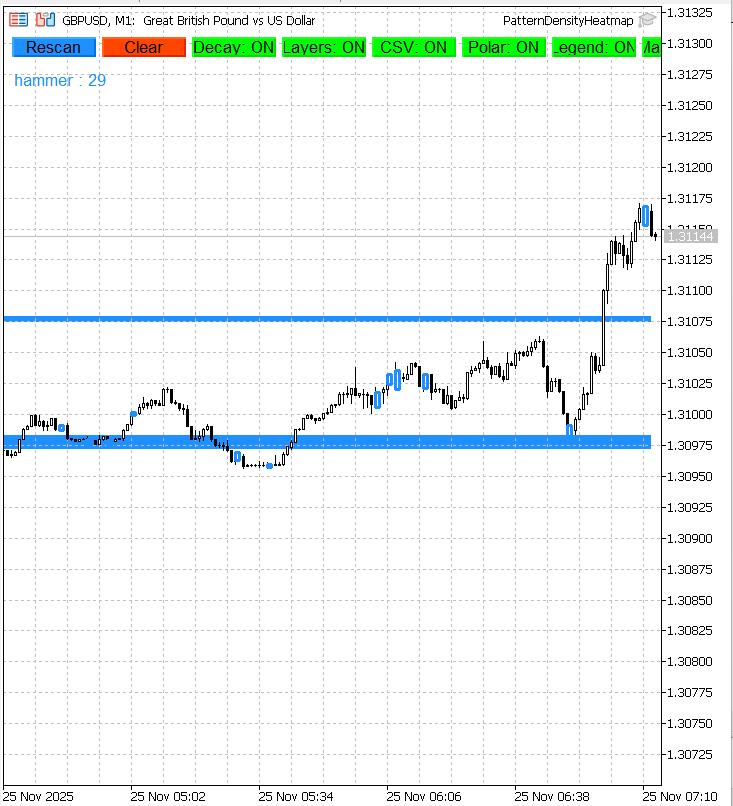
The figure above, Hammer single‑pattern test (count = 29). Highlighted band marks concentrated hammer occurrences used to infer a support zone.
Doji (Single‑Pattern Test)
- Heatmap produced with PatternName = "doji" only.
- Multiple narrow doji clusters are visible with EA hit count (doji: 67).
- Helps determine whether dojis concentrate at consolidation levels or scatter widely.
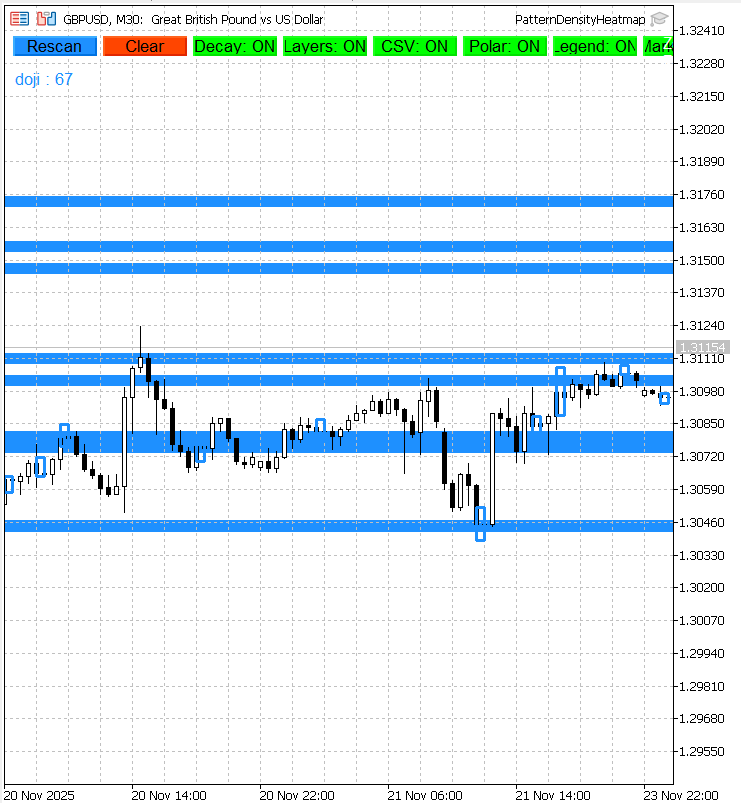
The figure above, Doji single‑pattern test (count = 67). Narrow bands indicate repeated indecision candles around key price levels.
Test Parameters Used
| Test | PatternName | LookbackBars | BinCount | MinHitsToShow |
|---|---|---|---|---|
| Gif | hammer, doji | 2000 | 40 | 2 |
| Fig 1 | hammer | 500 | 40 | 2 |
| Fig 2 | doji | 500 | 40 | 2 |
How the Outputs Were Generated
For each run, the EA begins by loading the last LookbackBars worth of market data from the chart. It determines the minimum and maximum prices over that range and calculates a precise binSize to divide the vertical price space into equal segments. The scanning loop then processes each bar individually, applying the selected pattern detection algorithms—for example, CheckHammerFromArray() or CheckDojiFromArray()—to decide whether the candle matches any of the target formations. When a match is found, the EA computes the relevant price point (midpoint, low, or high, depending on polarity anchoring rules) and maps it to the correct bin index. Each bin’s counter is incremented, with a weighting adjustment applied if recency decay is enabled to give newer detections more influence.
Bins whose hit counts exceed the MinHitsToShow threshold are promoted to ZoneRec entries. These zones can be checked for higher‑timeframe confirmation, then scored and sorted so that stronger reaction areas are prioritized. Top‑ranking zones are rendered as filled OBJ_RECTANGLE overlays, with optional per‑pattern layers and precise rectangle markers framing the actual candles that triggered detections. Labels placed alongside each zone list key reference data, including total hits, the normalized score, and whether the zone is HTF‑confirmed. If CSV export is active, the EA records each detection’s data to file for offline analysis.
Practical Notes
When exporting detection data to CSV, remember that files are written to the terminal’s working directory—MetaTrader 5 must have file system permissions granted, or export will fail. The live approach‑alert logic relies on the textual content of the zone labels; if those label objects are renamed manually, the alert system can lose track of zones. All chart objects created by the EA carry a PDHP_ prefix to avoid clashes with other indicators and EAs. If object creation fails, it can be due to naming collisions or insufficient historical bars for the selected LookbackBars setting.
Recency decay behavior is steered by the DecayHalfLife parameter—lower values make old detections fade faster, increasing the weight of recent pattern hits. Polarity anchoring is worth testing in isolation, as it adjusts the price point used per detection: bullish patterns anchor to candle lows, and bearish patterns anchor to candle highs. This can sharpen zone alignment in certain strategies, but should be verified with single‑pattern runs.
Short Takeaways
The composite scan shown in the GIF demonstrates that overlapping pattern types can combine into powerful, visually distinct zones. These composite zones are ideal for traders seeking higher confidence levels by requiring multiple pattern signals to align. The hammer single‑pattern run isolated one concentrated cluster (count = 29) resembling a strong support area—an example of how a single formation can point to a bias for entries near that level. In contrast, the doji single‑pattern test produced multiple narrow bands (count = 67), reflecting repeated market indecision spread across different price anchors. These doji clusters are best interpreted as consolidation signals rather than immediate reversal triggers.
Across all tests, single‑pattern scans proved indispensable for validating detection logic and deciding which formations deserve greater weighting in a composite heatmap. This process ensures the tool’s aggregated outputs are built on patterns with proven individual relevance.
Conclusion
The Pattern Density Heatmap represents a significant evolution in our Price Action Analysis Toolkit. What began as a simple candlestick‑pattern search and alert tool in Part 51 of this series has grown into a sophisticated market‑mapping system capable of identifying, quantifying, and tracking statistically significant price zones derived from historical candlestick behavior. By automating the aggregation of multiple patterns into measurable price bins, then scoring and confirming these zones against higher‑timeframe data, the indicator moves pattern trading from a purely visual art into a data‑driven process. Traders no longer need to rely on intuition alone—they can watch in real time when the market has repeatedly reacted and be alerted when price approaches these high‑density zones.
This transforms the way support and resistance are recognized: no longer as subjective lines drawn by eye, but as empirically validated zones backed by hard detection statistics, with a proven likelihood of influencing future market movements. These levels mark out the points where market reactions have consistently occurred, giving traders clear, objective reference areas that can anchor both entry and exit timing. The combination of clear heatmap visuals, precise candle markers, approach alerts, and exportable datasets makes the tool versatile and applicable across multiple trading styles—from intraday scalping to multi‑day swing trading, from discretionary setups to fully automated systems ingesting CSV analytics.
In practical terms, this means
- Better trade timing through anticipation rather than reaction.
- Improved risk management by avoiding trades into historically reactive zones.
- Greater strategy confidence via multi‑timeframe confluence.
- Extensible datasets for offline statistical evaluation or machine learning modeling.
As you integrate the Pattern Density Heatmap into your workflow, experiment with different pattern lists, lookback periods, and HTF settings to find the configuration that best matches your trading horizon and chosen market. Doing so will unlock the tool’s full potential—turning hidden clusters of market reactions into actionable, verified support and resistance maps, and keeping you consistently one step ahead of price. With the Pattern Density Heatmap, support and resistance are no longer guesswork—they’re measured, mapped, and waiting for price to confirm.
Warning: All rights to these materials are reserved by MetaQuotes Ltd. Copying or reprinting of these materials in whole or in part is prohibited.
This article was written by a user of the site and reflects their personal views. MetaQuotes Ltd is not responsible for the accuracy of the information presented, nor for any consequences resulting from the use of the solutions, strategies or recommendations described.

- Free trading apps
- Over 8,000 signals for copying
- Economic news for exploring financial markets
You agree to website policy and terms of use
Good morning please can you use this indicator to do an ea bot for me
Post your requirements as a job in the Freelance section please.