
Price Action Analysis Toolkit Development (Part 48): Multi-Timeframe Harmony Index with Weighted Bias Dashboard

Contents
- Introduction
- Concept and Algorithm
- Features Overview
- Code Structure Explanation
- User Inputs and Customization
- Testing and Outcomes
- Conclusion
Introduction
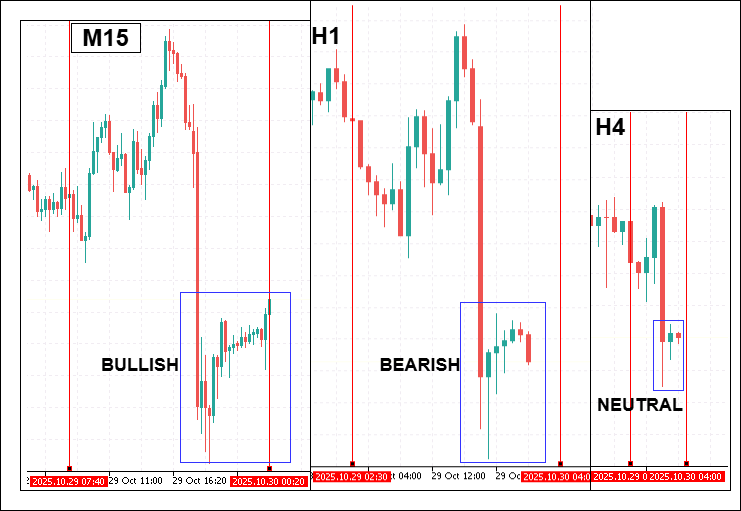
As price action traders, we rely on structural clarity—understanding how the market behaves across different timeframes before committing to an entry. Yet one of the enduring challenges in multi‑timeframe trading is achieving consistency across those layers. A chart may appear bullish on H4 while showing hesitation on H1 or complete reversal on M15, leaving the trader with a conflicting bias and limited confidence.
In this 48th part of the Price Action Analysis Toolkit Development series, we address that problem through the creation of the Multi‑Timeframe Harmony Index (HI)—a mechanism that mathematically expresses agreement among timeframes as a single, normalized value. By summarizing the direction of multiple structural biases into one coherent output, HI allows traders to see, on a single dashboard, whether the market is moving in harmony or discord.
This article explains the conceptual foundation of the Harmony Index, its detection algorithm based on three‑bar structural logic, the method for weighting and smoothing each timeframe’s contribution, and the operational features that transform it into an actionable trading aid. The multi‑layered design makes HI both a visual tool for discretionary traders and a quantitative filter for algorithmic systems built on the MetaTrader 5 platform. By the end of this article, you will understand how to implement the Harmony Index and interpret its color‑coded dashboard, alerts, and signal markers to make decisions with greater precision and confidence in multi‑timeframe environments.
Concept and Algorithm
In multi‑timeframe price action trading, the challenge lies in discerning trends within individual charts, and synthesizing those signals into a unified directional bias. Shorter timeframes like M15 and H1 are invaluable for capturing granular movements and early entry cues, whereas higher timeframes such as H4 and D1 define the dominant trend and key structural levels. However, in fast‑moving markets, these timeframes often disagree. Without a systematic method of quantifying consensus, traders are forced into subjective, time‑consuming judgments. The Multi‑Timeframe Harmony Index (HI) addresses this difficulty by condensing per‑timeframe structural bias into a single normalized numeric measure between –1.0 and +1.0. This real‑time calculation streamlines decision‑making, provides visual clarity via a dashboard, and enables automated alerting and signal generation.

Bias Detection Logic
Bias detection begins with the GetStructureBias() function, which examines the last three closed candles for each enabled timeframe:
Three‑Bar Staircase Rule

If the strict staircase condition is not met, the algorithm falls back to the Close Price Rule:

Finally, if both conditions fail or data is incomplete, the bias is determined from a direct comparison of the last two closes. This multi‑layered approach ensures that obvious, sustained trends are recognized by strict rules, while subtler bias changes are still detected by the close‑based fallback. It avoids reliance on incomplete bars and reduces false neutrality in higher volatility environments.
Weighted Harmony Index Calculation
Once a bias value is calculated for each timeframe (+1+1+1 bullish, 000 neutral, −1-1−1 bearish), the HI aggregates them via a weighted formula:

Here, weight(i) is a user‑defined factor controlling that timeframe’s importance. The result is normalized to the range [–1.0, +1.0], ensuring scale consistency regardless of weights.
For example, consider:
- M15: Bias = +1, Weight=0.10 to give Contribution = +0.10
- H1: Bias = +1, Weight=0.20 to give Contribution = +0.20
- H4: Bias = 0, Weight=0.30 to give Contribution = 0.00
- D1: Bias = +1, Weight=0.40 to give Contribution = +0.40
WeightedSum = 0.10+0.20+0.00+0.40 = 0.70, TotalWeight = 1.0
- Harmony Index(HI) = (0.70/1.0) = 0.70
An HI of 0.70 indicates a moderately strong bullish consensus, just below a strong threshold if set at 0.8.
EMA Smoothing the HI
Market conditions, particularly lower timeframes, can cause HI values to fluctuate sharply. To counteract signal noise, the Harmony Index applies Exponential Moving Average (EMA) smoothing:

This EMA produces a smoother trend bias reading:
- Shorter EMA Periods → more reactive, suitable for scalping.
- Longer EMA Periods → more stable, ideal for swing trading.
EMA smoothing reduces whipsaw alerts and increases confidence in threshold crossings.
Threshold‑Based State Classification
While the Harmony Index produces a precise numeric value, translating that number into an actionable trading context requires clear classification rules. Raw decimal readings can be informative to analysts, but on a live chart they should convey meaning instantly, without requiring mental calculations. To accomplish this, the Harmony Index applies a two‑tier threshold system that defines strong and moderate bias states, both for bullish and bearish conditions.
The StrongThreshold represents the point at which consensus across enabled timeframes reaches high confidence. For example, if StrongThreshold is set at 0.80.80.8, it would take most of the weighted timeframes to be firmly aligned in one direction for the index to cross it. This indicates a market environment where multi‑timeframe alignment is so robust that aggressive positioning is warranted by many traders. The ModerateThreshold—set lower, such as 0.40.40.4—signals an intermediate level of consensus. It identifies conditions where bias alignment is taking shape but has not yet reached high conviction levels.
Mathematically, the classification logic is expressed as

On the chart dashboard, these states are visually reinforced with intuitive color coding. A strong bullish consensus renders the HI value in a vivid green, while a strong bearish consensus turns it bright red. Moderate bullish or bearish conditions use softer tones of green or red, respectively, to suggest potential opportunity but with a note of caution. Readings in the weak or neutral zone are rendered in yellow, indicating indecision or absence of a clear multi‑timeframe trend. This color‑state linkage is critical; in fast‑moving conditions, traders can rely on visual cues alone to absorb this information without distraction from price action analysis itself.
Alerts and Signal Logic
A powerful feature of the Multi‑Timeframe Harmony Index is its ability to calculate and display bias consensus in real time, and also to actively inform the trader when meaningful changes occur. The inclusion of alerts and chart‑plotted signals transforms the HI from a purely analytical tool into a responsive tactical instrument that supports automated decision‑making and visual trade marking.
The alert system focuses on two key events. The first is HI Threshold Crosses, which occur when the Harmony Index moves from below to above the strong threshold in a bullish direction, or from above to below the negative strong threshold in a bearish direction. These events typically signify a significant shift in consensus, often marking the transition from indecision to high conviction across multiple timeframes. The second is Higher‑Timeframe Bias Flips, where the bias for H4 or D1 changes sign—flipping, for example, from bullish to bearish or vice versa. Because these higher timeframes carry more market weight in most strategies, such a flip can precede major structural moves and warrants trader attention even if the overall HI has not crossed a strong threshold.
Signal plotting complements alerts by placing buy or sell arrows directly on the chart when strong threshold crossings occur. For example, if HI transitions upward through the strong threshold, a green buy arrow is plotted slightly below the low of the most recent closed bar; if HI drops downward through the negative strong threshold, a red sell arrow is placed slightly above the high of that bar. This offset placement ensures legibility and avoids clutter near candle bodies. To prevent false or excessive signals, the EA uses a deduplication mechanism—checking if an arrow for the same direction has already been placed on the current bar—and respects a user‑defined MaxSignals parameter, which limits the number of arrows on the chart.
Mathematically, the condition for arrow triggering can be summarized as
![]()
Data Export for System Integration
The Harmony Index is designed as a standalone dashboard for discretionary trading, and also as a modular component within a larger algorithmic trading architecture. To facilitate this, it exports its calculated outputs into MetaTrader 5 Global Variables, which can be accessed by other Expert Advisors, custom indicators, or scripts running concurrently on the platform.
This export mechanism has several practical advantages. First, it allows other automated modules to use the Harmony Index as a trend filter, requiring, for example, that HI be above a certain threshold before a breakout trade is executed. Second, it enables coordinated decision‑making across multiple charts—an EA monitoring one currency pair can react to Harmony Index readings from another correlated pair or from a higher timeframe chart. Third, it supports sophisticated portfolio strategies where allocation, hedging, or risk‑scaling decisions are made based on the consensus trends detected by HI across diverse instruments.
Features Overview
The Multi‑Timeframe Harmony Index is far more than a simple numeric output—it is a fully featured trading module designed to serve discretionary traders, semi‑automated strategies, and full algorithmic systems alike. Its design philosophy is rooted in clarity, adaptability, and interoperability, ensuring that traders see market consensus and can act on it with confidence and speed. Below is an in‑depth breakdown of its key capabilities.
Configurable Timeframes and Weighting
At the core of the Harmony Index is the ability to decide which timeframes to include in the consensus calculation, and to set their individual weights according to your own trading style. Shorter timeframes (M15, H1) can be given more emphasis by active day traders seeking to capture intra‑day swings. Conversely, swing traders or position holders can assign heavier weights to H4 and D1 so that the index reflects the macro‑trend and ignores smaller counter‑moves. With independent boolean toggles for enabling each timeframe, the Harmony Index adapts to multiple styles—from scalping to long‑term investing—without forcing a fixed structure. This flexibility ensures that the consensus calculation remains meaningful for your unique rhythm of engagement with the market.
//--- user inputs
input bool Use_M15  = true;
input bool Use_H1   = true;
input bool Use_H4   = true;
input bool Use_D1   = true;

input double Weight_M15 = 1.0;
input double Weight_H1  = 1.5;
input double Weight_H4  = 2.0;
input double Weight_D1  = 2.5;

//--- example bias retrieval for selected TF
double GetBias(string symbol, ENUM_TIMEFRAMES tf)
{
   double close_now = iClose(symbol, tf, 0);
   double close_prev= iClose(symbol, tf, 1);
   if(close_now > close_prev) return  1; // bullish
   if(close_now < close_prev) return -1; // bearish
   return 0; // neutral
}

//--- example weighted calculation
double weighted_sum = 0;
double total_weight = 0;
if(Use_M15) { weighted_sum += GetBias(_Symbol, PERIOD_M15) * Weight_M15; total_weight += Weight_M15; }
if(Use_H1)  { weighted_sum += GetBias(_Symbol, PERIOD_H1)  * Weight_H1;  total_weight += Weight_H1;  }
if(Use_H4)  { weighted_sum += GetBias(_Symbol, PERIOD_H4)  * Weight_H4;  total_weight += Weight_H4;  }
if(Use_D1)  { weighted_sum += GetBias(_Symbol, PERIOD_D1)  * Weight_D1;  total_weight += Weight_D1;  }

double harmony_index = (total_weight > 0) ? weighted_sum / total_weight : 0;
Dashboard Panel Display and UI Flexibility
Clarity in live markets is not optional; it’s essential. The Harmony Index delivers this through a crisp, fully integrated chart panel that displays:
- The latest HI value and its EMA‑smoothed counterpart.
- A per‑timeframe bias breakdown, showing each TF’s status as Bullish, Bearish, or Neutral.
- Weighted contribution values for each timeframe, making individual influence immediately visible.
//--- Creating a chart label for HI values
string panelName = "HI_Dashboard";
if(!ObjectCreate(0, panelName, OBJ_LABEL, 0, 0, 0))
   Print("Failed to create dashboard label");

ObjectSetInteger(0, panelName, OBJPROP_CORNER, CORNER_RIGHT_UPPER);
ObjectSetInteger(0, panelName, OBJPROP_XDISTANCE, 10);
ObjectSetInteger(0, panelName, OBJPROP_YDISTANCE, 20);

string panelText = StringFormat("HI: %.2f\nEMA: %.2f", harmony_index, harmony_index_ema);
ObjectSetString(0, panelName, OBJPROP_TEXT, panelText);
ObjectSetInteger(0, panelName, OBJPROP_FONTSIZE, 12);
ObjectSetInteger(0, panelName, OBJPROP_COLOR, clrWhite);
The panel can be constructed as a rectangle label with color themes denoting bias confidence, or—if compatibility issues arise—the EA automatically switches to a label‑based fallback block that is robust across all platform builds. User inputs allow for fine control over position, size, padding, fonts, and colors, ensuring that the panel integrates seamlessly with your existing chart layouts.
Color‑Coded Confidence States
The Harmony Index employs intuitive visual language to reinforce its numeric calculations. Color codes map directly to the consensus classification generated in the previous section:
Bright Red → Strong Bearish, HI ≤ −StrongThreshold
Light Green/Light Red → Moderate states, between the moderate and strong thresholds
Yellow → Weak or neutral consensus
color GetHIColor(double hi, double strongThr, double moderateThr)
{
   if(hi >= strongThr)   return clrLime;      // strong bullish
   if(hi <= -strongThr)  return clrRed;       // strong bearish
   if(hi >= moderateThr) return clrLightGreen;// moderate bullish
   if(hi <= -moderateThr)return clrLightCoral;// moderate bearish
   return clrYellow;                          // neutral
}

ObjectSetInteger(0, panelName, OBJPROP_COLOR, GetHIColor(harmony_index, 0.7, 0.3));
This color‑state mapping ensures that you can simply glance at the panel to understand market alignment, without needing to mentally process each number in the heat of execution.
Threshold‑Driven Alerts
For decisive action during fast markets, the Harmony Index includes an alert system that triggers under specific, high‑value conditions:
- Strong Threshold Cross—When HI crosses above/below the strong bullish or bearish level from a weaker state.
- Higher Timeframe Flip—When the bias for H4 or D1 changes sign, signaling a potential major trend change.
//--- once per bar check
static datetime lastAlertTime = 0;
if(Time[0] != lastAlertTime)
{
   if(harmony_index >= strong_threshold && prev_hi < strong_threshold)
      Alert("Strong Bullish Threshold Crossed on ", _Symbol);

   if(harmony_index <= -strong_threshold && prev_hi > -strong_threshold)
      Alert("Strong Bearish Threshold Crossed on ", _Symbol);

   lastAlertTime = Time[0];
}
Alerts are delivered via the MetaTrader 5 Alert() system, log printing, and optional push notifications, ensuring they are received whether you are in front of the charts or monitoring remotely.
Automatic Buy/Sell Signal Plotting
For traders who prefer visual triggers, the Harmony Index can automatically plot buy and sell arrows on the chart based on strong threshold crossings. Buy arrows plotted below the low of the last closed bar when HI turns strong bullish. Sell arrows plotted above the high of the last closed bar when HI turns strong bearish. With built‑in deduplication to avoid repeated signals on the same bar and a maximum signal limit to prevent clutter, these plotted markers provide a clean historical record of threshold events that can be useful for both live trading and post‑session analysis.
void PlotSignal(bool buy)
{
   string arrowName = "HI_Signal_" + IntegerToString(Time[0]);
   ObjectCreate(0, arrowName, OBJ_ARROW, 0, Time[0], buy ? Low[0] : High[0]);
   ObjectSetInteger(0, arrowName, OBJPROP_COLOR, buy ? clrLime : clrRed);
   ObjectSetInteger(0, arrowName, OBJPROP_ARROWCODE, buy ? 241 : 242); // Wingdings up/down arrow
}

if(harmony_index >= strong_threshold && prev_hi < strong_threshold)
   PlotSignal(true);

if(harmony_index <= -strong_threshold && prev_hi > -strong_threshold)
   PlotSignal(false);
EMA Smoothing for Reduced Noise
The inclusion of HI_EMA_Period as a user‑adjustable parameter allows precise tuning of the balance between signal responsiveness and stability. Lower values produce rapid reactions to bias changes, suiting scalping environments; higher values create smoother, more deliberate changes ideal for aligning with long‑term structure. The panel displays both raw and smoothed HI values, allowing the trader to compare immediate sentiment with filtered, trend‑aligned consensus.
//--- standard EMA smoothing formula
double alpha = 2.0 / (HI_EMA_Period + 1);
harmony_index_ema = harmony_index_ema + alpha * (harmony_index - harmony_index_ema);
Global Variable Data Export
The Harmony Index is designed with interoperability in mind. All key outputs—including raw HI, smoothed HI, and per‑TF bias—are stored in MetaTrader 5 Global Variables. This makes them instantly accessible to:
- External EAs acting on the Harmony Index as a trend filter.
- Risk and trade managers adjusting position sizing to consensus conditions.
- Cross‑chart and cross‑pair strategies integrating multi‑symbol data.
//--- store outputs as global vars
GlobalVariableSet("HI_Raw_"+_Symbol, harmony_index);
GlobalVariableSet("HI_EMA_"+_Symbol, harmony_index_ema);
GlobalVariableSet("HI_Bias_M15_"+_Symbol, (double)GetBias(_Symbol, PERIOD_M15));
GlobalVariableSet("HI_Bias_H1_"+_Symbol,  (double)GetBias(_Symbol, PERIOD_H1));
GlobalVariableSet("HI_Bias_H4_"+_Symbol,  (double)GetBias(_Symbol, PERIOD_H4));
GlobalVariableSet("HI_Bias_D1_"+_Symbol,  (double)GetBias(_Symbol, PERIOD_D1));
By offering this data at a platform‑wide scope, the Harmony Index functions as a core engine, not an isolated tool, enabling advanced integration in complex trading infrastructures.
Code Structure Explanation
The Multi‑Timeframe Harmony Index Expert Advisor is built in a modular fashion, with clear separation between configuration, core logic, user interface rendering, and supporting utilities. This organization allows the EA to be highly adaptable while also making future maintenance simpler. The structure follows a natural trading logic flow:

The core of its adaptability lies in the input parameters, declared at the top of the script. Each supported timeframe—M15, H1, H4, and D1—has both an enable switch and a weight value. The enable switch determines whether that timeframe participates in the Harmony Index calculation, while the weight specifies its relative contribution. Alongside these controls are interpretation thresholds, smoothing settings, and switches that govern whether alerts and chart signals are enabled. This design ensures the EA can be molded to suit scalpers, swing traders, and position traders alike.
input bool   Use_M15 = true;  input double Weight_M15 = 0.10;
input bool   Use_H1  = true;  input double Weight_H1  = 0.20;
input bool   Use_H4  = true;  input double Weight_H4  = 0.30;
input bool   Use_D1  = true;  input double Weight_D1  = 0.40;

input double StrongThreshold   = 0.8;
input double ModerateThreshold = 0.4;

input int    HI_EMA_Period = 8;

input bool   EnableAlerts  = true;
input bool   EnableSignals = true;
When the Expert Advisor is launched, the OnInit() function prepares its operating environment. The enabled timeframes and their parameters are stored into a single array of structures (tfs[]), making it simple to loop through them later during calculations. The EA then builds its dashboard panel by attempting to draw a rectangle label object, and if that fails, falling back to a label‑block background for compatibility. Titles, HI values, and per‑timeframe labels are created succeeding, with unique object names generated to prevent interference when multiple instances are running. The initialization concludes by setting a timer for periodic execution and immediately calling UpdateHarmony() so the panel displays valid data right away.
ArrayResize(tfs,4);
tfs[0].tf = PERIOD_M15; tfs[0].enabled = Use_M15; tfs[0].weight = Weight_M15; tfs[0].name = "M15";
tfs[1].tf = PERIOD_H1;  tfs[1].enabled = Use_H1;  tfs[1].weight = Weight_H1;  tfs[1].name = "H1";
tfs[2].tf = PERIOD_H4;  tfs[2].enabled = Use_H4;  tfs[2].weight = Weight_H4;  tfs[2].name = "H4";
tfs[3].tf = PERIOD_D1;  tfs[3].enabled = Use_D1;  tfs[3].weight = Weight_D1;  tfs[3].name = "D1";

bool rect_created = TryCreateRectangle(...);
if(!rect_created) CreateBackgroundBlock(...);

EventSetTimer(MathMax(1, UpdateIntervalSec));
UpdateHarmony();
Once active, the EA’s cyclical operation is powered by the event timer. At each interval, OnTimer() calls UpdateHarmony(), which performs a fresh calculation of per‑timeframe biases, computes the weighted Harmony Index, smooths it with EMA, updates the UI, checks thresholds, triggers alerts, and writes data to global variables for integration with other systems.
void OnTimer()
{
   UpdateHarmony();
}

for(int i=0; i<4; i++)
{
    if(!tfs[i].enabled || tfs[i].weight <= 0.0) { biases[i] = 0; continue; }
    int b = GetStructureBias(tfs[i].tf);
    biases[i] = b;
    sumWeighted += (double)b * tfs[i].weight;
    sumWeights += tfs[i].weight;
}

double hi = (sumWeights != 0.0) ? (sumWeighted / sumWeights) : 0.0;
double alpha = 2.0 / (HI_EMA_Period + 1.0);
if(hi_ema == 0.0) hi_ema = hi;
else hi_ema = (hi - hi_ema) * alpha + hi_ema;
The bias detection logic in GetStructureBias() is built around price action structure rather than indicator derivatives. It inspects the last three closed bars from a timeframe to check if both highs and lows are forming a consistent upward staircase for bullish bias, or a downward staircase for bearish bias. If no staircase is detected, the function falls back to comparing candle closes, capturing momentum shifts that might not create strict structural patterns.
int GetStructureBias(ENUM_TIMEFRAMES tf)
{
   MqlRates rates[];
   int copied = CopyRates(_Symbol, tf, 1, 4, rates);

   if(copied >= 3)
   {
      if(rates[0].high > rates[1].high && rates[1].high > rates[2].high &&
         rates[0].low  > rates[1].low  && rates[1].low  > rates[2].low)
         return +1;

      if(rates[0].high < rates[1].high && rates[1].high < rates[2].high &&
         rates[0].low  < rates[1].low  && rates[1].low  < rates[2].low)
         return -1;
   }
   return 0;
}
User interface rendering is abstracted into helper functions that handle the creation and styling of the dashboard components. This encapsulation ensures that altering panel aesthetics has no impact on calculation logic. Should the preferred rectangle label fail to render due to platform constraints, the EA automatically switches to a simpler label‑block background, maintaining functional integrity.
bool TryCreateRectangle(...);
bool CreateBackgroundBlock(...);
bool CreateLabel(...);
The alert and signal‑plotting subsystem gives traders immediate awareness of important market alignment changes. Alerts are dispatched via the terminal’s alert system and can be sent as push notifications if enabled in MetaTrader 5. Chart arrows mark exactly where strong bullish or bearish thresholds were crossed, anchored to the high or low of the triggering bar and slightly offset for clarity.
void SendAlert(string txt)
{
   Print("HarmonyIndexEA: ", txt);
   Alert(txt);
   SendNotification(txt);
}

void PlaceSignalArrow(bool isBuy, datetime barTime, double price)
{
    ObjectCreate(0, name, OBJ_ARROW, 0, barTime, price);
    ObjectSetInteger(0, name, OBJPROP_ARROWCODE, isBuy ? 233 : 234);
    ObjectSetInteger(0, name, OBJPROP_COLOR, isBuy ? clrGreen : clrRed);
}
When the EA is removed, OnDeinit() cleans the workspace thoroughly. It deletes all chart objects related to the dashboard and signals, stops the timer, and erases all global variables created by the current EA instance. This ensures a clean slate and prevents interference with future analysis or other EAs.
void OnDeinit(const int reason)
{
   // Delete chart objects, arrows, globals
   EventKillTimer();
}
By flowing through configuration, initialization, timed recalculation, UI rendering, alerting, and cleanup, the Multi‑Timeframe Harmony Index forms a complete closed‑loop analysis and notification system. Each block of the code is purpose‑built yet interconnected, achieving a balance between performance, flexibility, and robustness suitable for professional trading environments.
User Inputs and Customization
The Multi‑Timeframe Harmony Index was designed to adapt to multiple trading styles, market conditions, and trader preferences through a set of highly configurable input parameters. These inputs govern every aspect of the EA’s operation, from the selection of timeframes to participate in the analysis, to the visual presentation of the dashboard, to the rules that define actionable bias states, and the behavior of alerts and chart signals. The configuration begins with timeframe enable switches and weights. Each supported timeframe—M15, H1, H4, and D1—can be individually toggled on or off. When enabled, it participates in the calculation of the Harmony Index (HI), contributing its own bias value. The weight assigned to a timeframe controls how much influence it has relative to others. Traders can tilt the balance of the HI toward shorter timeframes for more responsive signals, or toward longer timeframes for higher structural stability. This granularity means the tool is as useful to scalpers seeking micro‑alignment as it is to swing traders waiting for large structural pivots.
Thresholds play a decisive role in interpreting the raw Harmony Index value. The StrongThreshold defines the point above which the bias can be considered strongly bullish, and below which strongly bearish, depending on the sign of the HI. A separate ModerateThreshold defines mid‑range conditions, useful for spotting evolving alignment before it reaches full strength. Both thresholds work with the EMA‑smoothed HI values to determine the dashboard’s color coding and alert triggers. The EMA Period parameter governs smoothing behavior. A short period allows the Harmony Index to respond quickly to new bias changes, while a longer period yields slower, steadier signals by reducing sensitivity to lower‑timeframe noise. This is a powerful control for adapting the EA to different volatility environments: in ranging, choppy periods, a longer smoothing period filters out false signals, while in trending markets, short periods capture early participation opportunities.
Beyond analysis, the EA provides optional alerting and chart‑based signal plotting. Enabling alerts will cause the EA to notify the user when thresholds are crossed or high‑timeframe biases flip. Enabling signal plotting will place buy/sell arrows on the chart at the moment of strong threshold crossings, serving as a visual record for later review. The style, placement, and number of arrows can be fine‑tuned to avoid clutter and maintain clarity. All parameters are accessible via MetaTrader’s Inputs tab when attaching the EA to a chart, and changes take effect immediately upon re‑loading. This ensures traders can rapidly experiment with configurations to tailor the Harmony Index to their strategy without editing a single line of code.
| Input Name | Type | Default | Description |
|---|---|---|---|
| Use_M15 | bool | true | Enable analysis of the 15‑minute timeframe. |
| Weight_M15 | double | 0.10 | Relative weight of M15 in HI calculation. |
| Use_H1 | bool | true | Enable analysis of the 1‑hour timeframe. |
| Weight_H1 | double | 0.20 | Relative weight of H1 in HI calculation. |
| Use_H4 | bool | true | Enable analysis of the 4‑hour timeframe. |
| Weight_H4 | double | 0.3 | Relative weight of H4 in HI calculation. |
| Use_D1 | bool | true | Enable analysis of the daily timeframe. |
| Weight_D1 | double | 0.40 | Relative weight of D1 in HI calculation. |
| StrongThreshold | double | 0.8 | Bias magnitude required for a strong state. |
| ModerateThreshold | double | 0.4 | Bias magnitude required for a moderate state. |
| HI_EMA_Period | int | 8 | Period for EMA smoothing applied to HI. |
| EnableAlerts | bool | true | Enable threshold and timeframe‑flip alerts. |
| EnableSignals | bool | true | Enable automatic chart arrows at strong threshold crossings. |
| UpdateIntervalSec | int | 1 | Seconds between dashboard refreshes and recalculations. |
| MaxSignals | int | 100 | Maximum arrows plotted to avoid clutter. |
By combining this rich parameter set with the EA’s adaptable architecture, traders can mold the Harmony Index to serve multiple roles. In one configuration, it can act as a fast scalper’s alignment tool, firing rapid alerts on early bias shifts; in another, it can be tuned into a slow, steady trend filter that guides position trading without overreacting to noise. This adaptability is a defining strength of the EA and a key reason to fully understand each input in the context of your trading objectives.
Testing and Outcomes
To evaluate the effectiveness of the Harmony Index in practical trading scenarios, we performed tests in both demo live trading and strategy tester backtesting environments.
Demo Live Chart Test—Volatility 75 (1s) Index
Our first test was conducted on a demo live chart tracking the Volatility 75 (1s) Index. The Harmony Index dashboard was monitored in real time, and multiple signals were generated as bias agreements occurred across the monitored timeframes.
The dashboard display included:
- Current HI (raw) and EMA-smoothed HI values.
- Bias readings for each monitored timeframe (M15, H1, H4, D1).
- Corresponding weighting factors.
- Final weighted Harmony Index contribution.
During this test, the system detected several bearish bias alignments. Sell arrows were plotted precisely when the Harmony Index crossed the negative strong threshold, confirming correct signal logic.

Figure Above—Demo live chart testing on Volatility 75 (1s) Index showing multiple bearish bias signals and Harmony Index dashboard output.
Backtest—GBPUSD, H1 Timeframe
An additional strategy tester backtest was performed on GBPUSD, H1 to validate the tool in a Forex market context. The backtest results were positive, with consistent detection of multi‑timeframe bias agreement and smooth EMA‑based Harmony Index values. These findings further highlight the strong potential of the Harmony Index as a reliable component in price action analysis across multiple timeframes.

Figure Above—GBPUSD (H1) backtest showing Harmony Index dashboard tracking bias states and generating buy/sell signals.
Both demo live and backtest results showed accurate bias classification and timely signal plotting. In different market environments—synthetic index (Volatility 75) and major currency pair (GBPUSD)—the Harmony Index consistently measured directional agreement and displayed actionable insight for both discretionary and algorithmic trading systems.
Conclusion
The Multi‑Timeframe Harmony Index represents a significant evolution in the way price action traders can quantify and visualize multi‑timeframe trend alignment. By condensing the structural bias of multiple timeframes into a single, weighted metric, and enhancing interpretability through intuitive color coding, threshold‑based states, and EMA smoothing, the EA transforms subjectivity into objective, actionable information. Rather than relying on fragmented judgment across different charts, traders can now see—in one unified dashboard—whether short, medium-and long‑term structures are in agreement or conflict. This clarity allows for faster decision‑making, cleaner trade filtering, and better integration with automated strategies. Built with flexibility in mind, the Harmony Index adapts to a wide range of trading styles, from high‑frequency scalping to position trading, simply by adjusting its timeframes, weights, thresholds, and smoothing parameters.
Within the context of the Price Action Analysis Toolkit Development series, this module stands out for its analytical capability, and interoperability. The export of Harmony Index values to global variables means it can serve as a core trend filter in larger trading systems, supporting algorithmic and discretionary workflows alike. Its modular design, robust user interface logic, and disciplined cleanup routines make it stable and user‑friendly on live accounts. Ultimately, the strength of the Multi‑Timeframe Harmony Index lies in its ability to merge the precision of structured price action analysis with the efficiency of real‑time automation. Whether used as a standalone decision aid or as part of a broader trading architecture, it enables traders to distill complex multi‑timeframe evaluations into a single, readable signal—and to act upon that signal with the confidence of quantified consensus.
Warning: All rights to these materials are reserved by MetaQuotes Ltd. Copying or reprinting of these materials in whole or in part is prohibited.
This article was written by a user of the site and reflects their personal views. MetaQuotes Ltd is not responsible for the accuracy of the information presented, nor for any consequences resulting from the use of the solutions, strategies or recommendations described.

- Free trading apps
- Over 8,000 signals for copying
- Economic news for exploring financial markets
You agree to website policy and terms of use
How should the inputs be configured for scalping?
For scalping, try to use lower timeframes, e.g M1 to M5 timeframes and set higher weights on these lower frames.