
Market Profile indicator
Contents
What is Market Profile?
Peter Steidlmayer developed the Market Profile concept in the 1980s with the Chicago Mercantile Exchange. Traders who use this method note its usefulness for deep understanding of the market and improving trading efficiency.
Market Profile is not a traditional technical indicator and it does not provide direct trading signals. But it complements a trading system, allowing traders to arrange the data and determine who controls the market, what fair value is, and what factors influence price movements.
The Market Profile reflects the organization of trading based on time, price and volume. Each day a range is formed with a price area representing the balance between buyers and sellers. Prices fluctuate in this area, and Market Profile helps traders interpret these changes both during and after trading. It is plotted on a normal distribution curve, where about 70% of the value lies within one standard deviation of the mean. In other words, it is an analysis tool that shows the distribution of volumes or the time spent by the price at certain levels. It helps traders understand where the biggest trades are happening and identify key supply and demand levels.
Using Market Profile requires understanding some concepts that are driven by market behavior and are directly or indirectly displayed on the chart. Recommended timeframe for analysis is M30.
The first trading hour forms the main pattern of the trading day and is the basis for studying the market participants' activity throughout the session. This period is important in determining what traders are doing on the market to find the price at which the buyer and seller will agree to strike a deal.
There are two categories of market participants:
- day-timeframe trader — a trader working intraday in large volumes of several ticks;
- other-timeframe trader — a trader who trades on other time periods, ensuring the price moves to new levels.
Let's look at some basic concepts that will help you better understand the Market Profile.
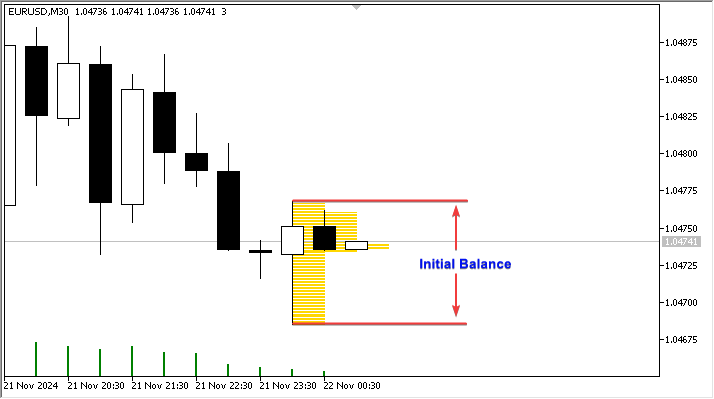
- Initial balance — range of market prices during the first hour of a trading session (two 30-minute bars after the session opening).
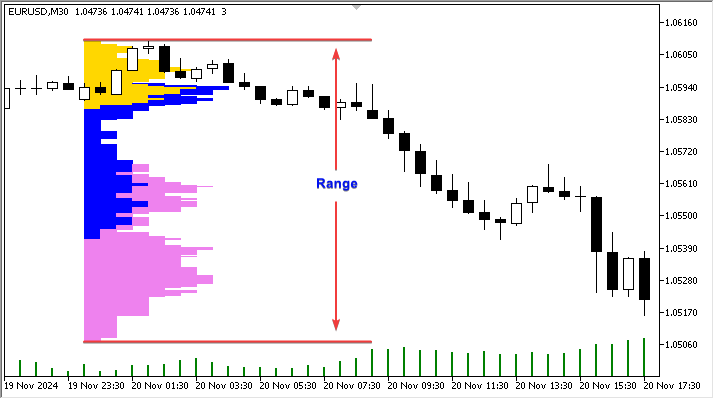
- Range — range, absolute height of the entire Market Profile.
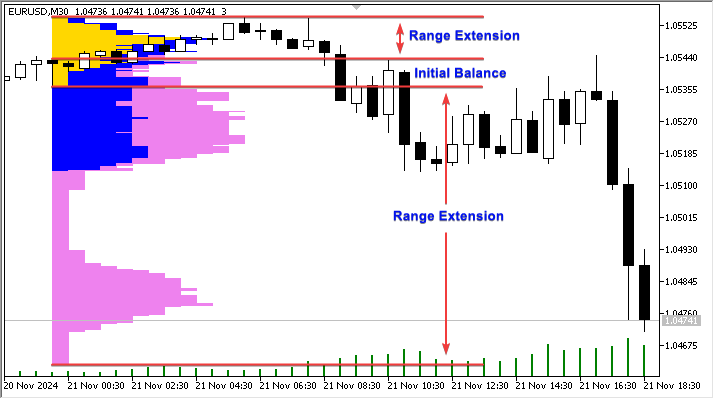
- Range extension — expansion of the range when the price moves in relation to the initial balance.
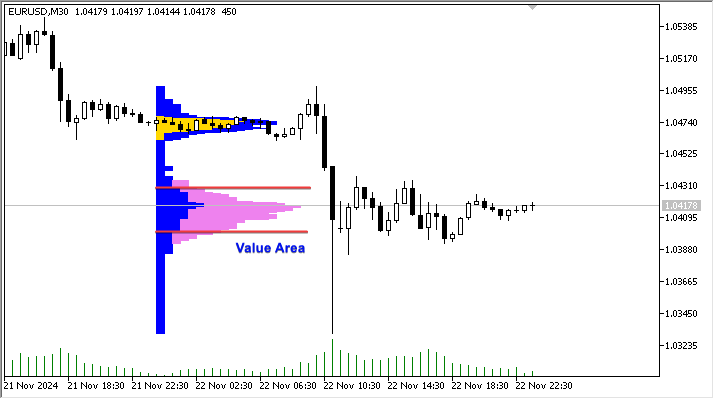
- Value area — value zone, a price range that includes 70% of trading activity.
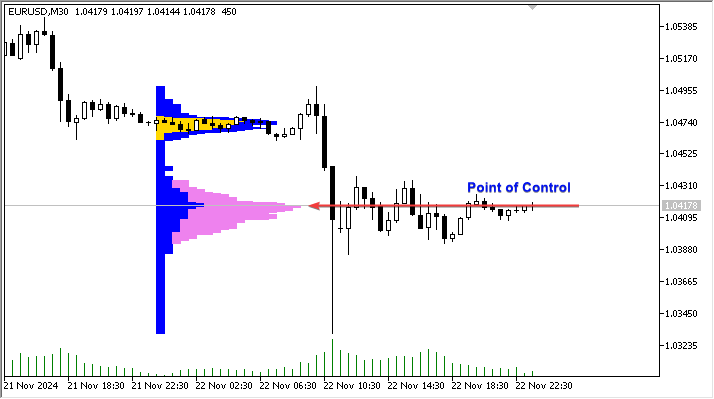
- Point of control (POC) — the longest profile line, which is also the closest to the center of the range.
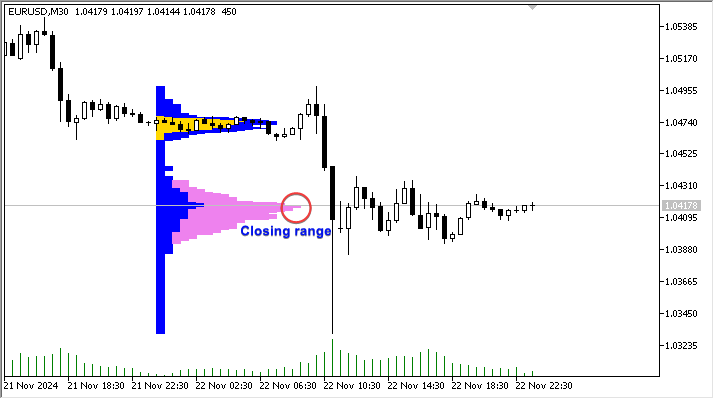
- Closing range — located near the closure of the trading session.
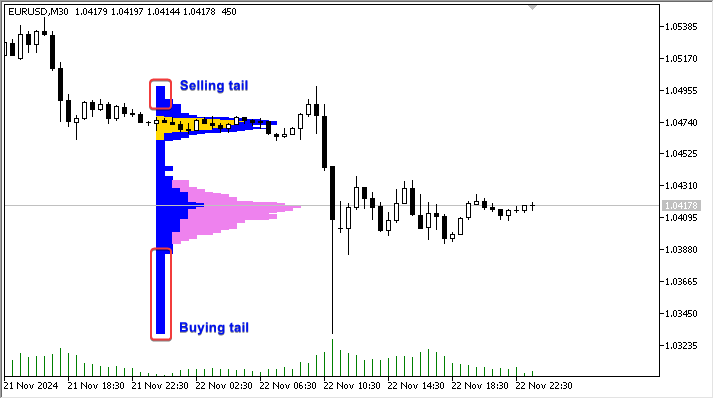
- Buying/Selling tail. The presence of such tails indicates the sharply increasing activity of "other-timeframe" traders.
The short length of the tails indicates sufficient aggressiveness of "other-timeframe" traders, both from the buyers' and sellers' side.
To read Market Profile, you can follow these basic principles:
- Defining Price-Volume
Market Profile displays the price levels that witnessed the highest volume. Lines or blocks on the chart (usually horizontal) show how much time the price spent at a certain level, or how much volume was traded there. Longer lines mean more time or more volume - these are key support and resistance levels. - Point of Control (POC)
This is the price level, at which the maximum trading volume occurred during the period. It often acts as a strong support or resistance level, as the price here is most "acceptable" to market participants. - Fair and unfair price zones (Value Area and Non-Value Area)
- Value Area typically accounts for about 70% of the trading volume for the period. This is the range where the price found "balance" between supply and demand most of the time.
- Non-Value Area - levels above or below the Value Area are considered low interest areas. If the price moves into these zones, it can either quickly return to the Value Area or continue moving due to the imbalance of supply and demand.
- Detecting trends and flats
- Trend day - Market Profile "extends" in one direction when the market moves steadily up or down. In these cases, the price does not linger at the levels, but moves, creating new areas of interest. A trend day has a small initial balance, representing less than 25% of the entire day's range. In fact, this is a significant dominance of buyers or sellers with a strong range extension in one of the directions.
- Flat day - the profile is concentrated around one level, and the Value Area remains narrow. This indicates balance and the absence of a strong trend.
- Non-trend day features a narrow initial balance that subsequently contains the entire day's price range.
- Normal day - such a day has a wide initial balance, approximately equal to 80% of the entire range. This is the most common type of trading day.
- Normal change of a normal day - initial balance of such a structure is approximately 50% of the day's range. In this case, an expansion of the range is formed in either one direction or the other.
- Neutral day - such a profile is not characterized by its initial balance, there is range expansion in both directions, and the day ends near the center of the range.
- Trend day - Market Profile "extends" in one direction when the market moves steadily up or down. In these cases, the price does not linger at the levels, but moves, creating new areas of interest. A trend day has a small initial balance, representing less than 25% of the entire day's range. In fact, this is a significant dominance of buyers or sellers with a strong range extension in one of the directions.
- Understanding extremes and price reaction
- If price reaches new levels with low volume and quickly returns to the POC or Value Area, this may indicate a rebound.
- If the price continues to trade outside the Value Area and creates a new POC, this signals the possible start of a new trend.
- Practical application of Market Profile
- To find entry points: Identify support and resistance levels using POC and Value Area boundaries, expect pullbacks from these levels or breakouts in the direction of the trend.
- To set stop losses and targets: Use POC and Value Area High/Low as levels to place protective stops and take profits.
The classic Market Profile is based on TPOs (Time-Price Opportunities), which are capital letters of the Latin alphabet, with each letter representing 30 minutes of a trading session.
Market Profile in MetaTrader 5 terminal
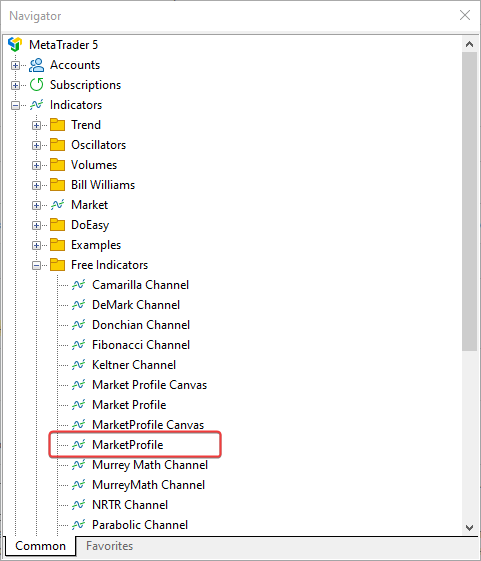
MetaTrader 5 client terminal, namely the \MQL5\Indicators\Free Indicators\ directory, features a simple version of the Market Profile. You can find its code in MarketProfile.mq5. This indicator, unlike its classical representation, builds vertical volume profiles by sessions (Asia, Europe, America), visualizing the zones where the price spent more time. It analyzes intraday bars and breaks them down into three time periods that reflect different market sessions. The indicator calculates the amount of time spent at each price level during these sessions and visually displays them as rectangles on the chart.
Key points to read this indicator:
- Division into trading sessions:
- The whole day is divided into three sessions: Asian, European and American.
- The color zones on the chart show the time spent at the price level in each session.
- Price levels:
- Each price level is colored according to the session and the length of time the price has been there. Levels where the price lingered longer are considered important levels as there was active trading there.
- POC (Point of Control):
- The indicator does not calculate POC directly, but we can visually highlight the levels with the greatest length of colored zones - these are the control points indicating the key levels of supply and demand.
- Value Areas:
- As with the standard Market Profile, areas of higher volume concentration (long stays of price) can be viewed as levels that price may seek to return to.
Thus, the Market Profile indicator in this code helps to understand at what levels the main activity was concentrated during the day and to highlight support and resistance levels for each trading session.
Let's figure out how this indicator works.
Structure and principles
The indicator inputs include:
- the number of days, the profile should be shown for,
- index of the day closest to the current one:
- 0 — current day,
- 1 — previous,
- 2 — day before previous, etc.,
- colors used to render the sessions (Asian, European and American),
- opening hours of the European and American sessions (Asian session opens at the opening of the day)
- histogram segment length multiplier:
//--- input parameters
input uint  InpStartDate       =0;           /* day number to start calculation */  // 0 - current, 1 - previous, etc.
input uint  InpShowDays        =3;           /* number of days to display */        // starting with and including the day in InpStartDate
input int   InpMultiplier      =1;           /* histogram length multiplier */
input color InpAsiaSession     =clrGold;     /* Asian session */
input color InpEuropeSession   =clrBlue;     /* European session */
input color InpAmericaSession  =clrViolet;   /* American session */
input uint  InpEuropeStartHour =8;           /* European session opening hour */
input uint  InpAmericaStartHour=14;          /* American session opening hour */
When initializing the indicator, we create a unique ID for the object names from the last four digits of the number of milliseconds that have passed since the system started:
//+------------------------------------------------------------------+
//| Custom indicator initialization function                         |
//+------------------------------------------------------------------+
int OnInit()
  {
//--- create a prefix for object names
   string number=StringFormat("%I64d", GetTickCount64());
   ExtPrefixUniq=StringSubstr(number, StringLen(number)-4);
   Print("Indicator \"Market Profile\" started, prefix=", ExtPrefixUniq);

   return(INIT_SUCCEEDED);
  }
This number will then be used when creating names of the indicator's graphical objects, and objects will be deleted using the same prefix during deinitialization:
//+------------------------------------------------------------------+
//| Custom indicator deinitialization function                       |
//+------------------------------------------------------------------+
void OnDeinit(const int reason)
  {
//--- after use, delete all graphical objects created by the indicator
   Print("Indicator \"Market Profile\" stopped, delete all objects with prefix=", ExtPrefixUniq);
   ObjectsDeleteAll(0, ExtPrefixUniq, 0, OBJ_RECTANGLE);
   ChartRedraw(0);
  }
So how does the indicator work? What is its rendering logic? Let's imagine that the full size of a daily candle from its Low to High is the size of the table. Then the rows of the table will be price levels: each price point is one table row. The table columns in the simplest version are the distance from one intraday bar to another. The row with zero index is the lowest price, equal to the Low of the bar. Price with index 1 is the Low of the bar plus one point. Accordingly, the string defining the High of the bar is the string with the Low index of the bar plus the number of points from the Low to the High of the bar.
If we now create a simple array corresponding to the rows of this table, then its zero index will store the number of bars that managed to be at the Low price of the bar during the price movement during the day. In the same way, all the other cells of this array will store the number of times the price managed to be at these levels.
How can we determine this? It is very easy. Since the Low of the daily bar at the opening of the day is the zero index of the array, the indices of all other intraday bars can be calculated: the index of the row corresponding to the bar following the opening bar is the Low of that bar minus the Low of the opening of the day in points. The last index for this bar will be the High of this bar minus the opening Low of the day.
The figure below shows the start and end indices in the Array for four six-hour intraday bars: Bar0, Bar1, Bar2, and Bar3:

If we now mark in the array the number of bars that have been at price levels and draw the rectangles of the market profile, we will get the following picture in the array and on the chart:

The Array is cleared on each new tick, a new Range size of the daily bar is set for it, and its indices are filled anew with the value of the number of bars that have been at each price level. Thus, the market profile is dynamically filled in and displayed on the chart with current information about the state of the market, and the longer the price is at any level (more bars include the level), the longer the line indicating this level.
Let's see how this is implemented in the indicator code:
//+------------------------------------------------------------------+
//| Custom indicator iteration function                              |
//+------------------------------------------------------------------+
int OnCalculate(const int rates_total,
                const int prev_calculated,
                const datetime &time[],
                const double &open[],
                const double &high[],
                const double &low[],
                const double &close[],
                const long &tick_volume[],
                const long &volume[],
                const int &spread[])
  {
//--- opening time of the current daily bar
   datetime static open_time=0;

//--- number of the last day for calculations
//--- (if InpStartDate = 0 and InpShowDays = 3, lastday = 3)
//--- (if InpStartDate = 1 and InpShowDays = 3, lastday = 4) etc ...
   uint lastday=InpStartDate+InpShowDays;

//--- if the first calculation has already been made
   if(prev_calculated!=0)
     {
      //--- get the opening time of the current daily bar
      datetime current_open=iTime(Symbol(), PERIOD_D1, 0);

      //--- if we do not calculate the current day
      if(InpStartDate!=0)
        {
         //--- if the opening time was not received, leave
         if(current_open==open_time)
            return(rates_total);
        }
      //--- update opening time
      open_time=current_open;
      //--- we will only calculate one day from now on, since all other days have already been calculated during the first run
      lastday=InpStartDate+1;
     }

//--- in a loop for the specified number of days (either InpStartDate+InpShowDays on first run, or InpStartDate+1 on each tick)
   for(uint day=InpStartDate; day<lastday; day++)
     {
      //--- get the data of the day with index day into the structure
      MqlRates day_rate[];
      //--- if the indicator is launched on weekends or holidays when there are no ticks, you should first open the daily chart of the symbol
      //--- if we have not received bar data for the day index of the daily period, we leave until the next call to OnCalculate()
      if(CopyRates(Symbol(), PERIOD_D1, day, 1, day_rate)==-1)
         return(prev_calculated);

      //--- get daily range (Range) in points
      double high_day=day_rate[0].high;
      double low_day=day_rate[0].low;
      double point=SymbolInfoDouble(Symbol(), SYMBOL_POINT);
      int    day_size=(int)((high_day-low_day)/point);

      //--- prepare arrays for storing price level rectangles
      int boxes_asia[], boxes_europe[], boxes_america[];
      //--- array sizes equal to the number of points in the day range
      ArrayResize(boxes_asia, day_size);
      ArrayResize(boxes_europe, day_size);
      ArrayResize(boxes_america, day_size);
      //--- zero out the arrays
      ZeroMemory(boxes_asia);
      ZeroMemory(boxes_europe);
      ZeroMemory(boxes_america);

      //--- get all intraday bars of the current day
      MqlRates bars_in_day[];
      datetime start_time=day_rate[0].time+PeriodSeconds(PERIOD_D1)-1;
      datetime stop_time=day_rate[0].time;
      //--- if the indicator is launched on weekends or holidays when there are no ticks, you should first open the daily chart of the symbol
      //--- if it was not possible to get the bars of the current timeframe for the specified day, leave until the next call of OnCalculate()
      if(CopyRates(Symbol(), PERIOD_CURRENT, start_time, stop_time, bars_in_day)==-1)
         return(prev_calculated);

      //--- we go through all the bars of the current day in a loop and mark the price cells that the bars fall into
      int size=ArraySize(bars_in_day);
      for(int i=0; i<size; i++)
        {
         //--- calculate the range of price level indices in the daily range
         int         start_box=(int)((bars_in_day[i].low-low_day)/point);  // index of the first cell of the price array corresponding to the Low price of the current i bar
         int         stop_box =(int)((bars_in_day[i].high-low_day)/point); // index of the last cell of the price array corresponding to the High price of the current i bar

         //--- get the bar hour by the loop index
         MqlDateTime bar_time;
         TimeToStruct(bars_in_day[i].time, bar_time);
         uint        hour=bar_time.hour;

         //--- determine which session the bar belongs to by the bar hour
         //--- American session
         if(hour>=InpAmericaStartHour)
           {
            //--- in the American session array, in cells from start_box to stop_box, increase the bar counters
            for(int ind=start_box; ind<stop_box; ind++)
               boxes_america[ind]++;
           }
         //--- Europe or Asia
         else
           {
            //--- European session
            if(hour>=InpEuropeStartHour && hour<InpAmericaStartHour)
               //--- in the European session array, in cells from start_box to stop_box, increase the bar counters
               for(int ind=start_box; ind<stop_box; ind++)
                  boxes_europe[ind]++;
            //--- Asian session
            else
               //--- in the Asian session array, in cells from start_box to stop_box, increase the bar counters
               for(int ind=start_box; ind<stop_box; ind++)
                  boxes_asia[ind]++;
           }
        }

      //--- draw a market profile based on the created arrays of price levels
      //---  market profile on the chart is drawn with segments of colored lines using the color specified in the settings for each trading session
      //--- segments are drawn as rectangle objects with the height of the rectangle equal to one price point and the width equal to the distance to the next bar to the right

      //--- define the day for the name of the graphical object and the width of the rectangle
      string day_prefix=TimeToString(day_rate[0].time, TIME_DATE);
      int    box_length=PeriodSeconds(PERIOD_CURRENT);

      //--- Asian session
      //--- in a loop by the number of points of the daily bar
      for(int ind=0; ind<day_size; ind++)
        {
         //--- if the Asian session array is full
         if(boxes_asia[ind]>0)
           {
            //--- get the next price by adding the number of 'ind' points to the Low price of the daily bar
            //--- get the start time of the segment (opening time of the daily bar)
            //--- and the end time of the segment (opening time of the daily bar + the number of bars stored in the 'ind' cell of the boxes_asia[] array)
            double   price=low_day+ind*point;
            datetime time1=day_rate[0].time;
            datetime time2=time1+boxes_asia[ind]*box_length*InpMultiplier;
            //--- create a prefix for the name of the Asian session graphical object
            string   prefix=ExtPrefixUniq+"_"+day_prefix+"_Asia_"+StringFormat("%.5f", price);

            //--- draw a rectangle (line segment) at the calculated coordinates with the color for the Asian session
            DrawBox(prefix, price, time1, time2, InpAsiaSession);
           }
        }

      //--- European session
      for(int ind=0; ind<day_size; ind++)
        {
         //--- if the European session array is full
         if(boxes_europe[ind]>0)
           {
            //--- get the next price by adding the number of 'ind' points to the Low price of the daily bar
            //--- get the start time of the segment (opening time of the daily bar + time of the right edge of the Asian session profile)
            //--- and the end time of the segment (start time of the European session segment + the number of bars stored in the 'ind' cell of the boxes_europe[] array)
            double   price=low_day+ind*point;
            datetime time1=day_rate[0].time+boxes_asia[ind]*box_length*InpMultiplier;
            datetime time2=time1+boxes_europe[ind]*box_length*InpMultiplier;
            //--- create a prefix for the name of the graphical object of the European session
            string   prefix=ExtPrefixUniq+"_"+day_prefix+"_Europe_"+StringFormat("%.5f", price);

            //--- draw a rectangle (line segment) at the calculated coordinates with the color for the European session
            DrawBox(prefix, price, time1, time2, InpEuropeSession);
           }
        }

      //--- American session
      for(int ind=0; ind<day_size; ind++)
        {
         //--- if the American session array is full
         if(boxes_america[ind]>0)
           {
            //--- get the next price by adding the number of 'ind' points to the Low price of the daily bar
            //--- get the start time of the segment (opening time of the daily bar + time of the right edge of the Asian session profile + time of the right edge of the European session profile)
            //--- and the end time of the segment (start time of the American session segment + the number of bars stored in the 'ind' cell of the boxes_america[] array)
            double   price=low_day+ind*point;
            datetime time1=day_rate[0].time+(boxes_asia[ind]+boxes_europe[ind])*box_length*InpMultiplier;
            datetime time2=time1+boxes_america[ind]*box_length*InpMultiplier;
            //--- create a prefix for the name of the American session graphical object
            string   prefix=ExtPrefixUniq+"_"+day_prefix+"_America_"+StringFormat("%.5f", price);

            //--- draw a rectangle (line segment) at the calculated coordinates with the color for the American session
            DrawBox(prefix, price, time1, time2, InpAmericaSession);
           }
        }
     }

//--- when the loop is complete, redraw the chart
   ChartRedraw(0);

//--- return the number of bars for the next OnCalculate call
   return(rates_total);
  }
The code is commented in sufficient detail. The indicator can draw a profile for several days at once. All of them are rendered in a loop according to the number of days displayed.
Main algorithm
Let's look at the algorithm of the above code in more detail. Each individual day is drawn like this:
- depending on the chart period the indicator is running on we get the bars included in the displayed day:
MqlRates day_rate[];
if(CopyRates(Symbol(), PERIOD_D1, day, 1, day_rate)==-1)
   return(prev_calculated);

MqlRates bars_in_day[];
datetime start_time=day_rate[0].time+PeriodSeconds(PERIOD_D1)-1;
datetime stop_time=day_rate[0].time;

if(CopyRates(Symbol(), PERIOD_CURRENT, start_time, stop_time, bars_in_day)==-1)
   return(prev_calculated);
- in a loop by the number of intraday bars
int size=ArraySize(bars_in_day);
for(int i=0; i<size; i++)
- for the current bar selected in the loop, we calculate the indices of the beginning and end of the price range the selected bar is located in within the daily bar
int         start_box=(int)((bars_in_day[i].low-low_day)/point);  // index of the first cell of the price array corresponding to the Low price of the current i bar
int         stop_box =(int)((bars_in_day[i].high-low_day)/point); // index of the last cell of the price array corresponding to the High price of the current i bar
- determine the session, the bar selected in the loop is located in, and in the corresponding array we increase the bar counters in all cells located in the price range of the intraday bar
MqlDateTime bar_time;
TimeToStruct(bars_in_day[i].time, bar_time);
uint        hour=bar_time.hour;

if(hour>=InpAmericaStartHour)
  {
   for(int ind=start_box; ind<stop_box; ind++)
      boxes_america[ind]++;
  }
else
  {
   if(hour>=InpEuropeStartHour && hour<InpAmericaStartHour)
      for(int ind=start_box; ind<stop_box; ind++)
         boxes_europe[ind]++;
   else
      for(int ind=start_box; ind<stop_box; ind++)
         boxes_asia[ind]++;
   }
- after going in a loop through all the intraday bars, each cell of the session arrays will record the number of bars that have been at this price. All session arrays will have the same size, equal to the number of price points in the daily range from Low to High of the daily candle, but each array will be filled in accordance with what price levels were reached in this session.
- Next, in the loop through all filled session arrays, graphical objects are displayed on the chart according to the calculated coordinates:
for(int ind=0; ind<day_size; ind++)
  {
   if(boxes_asia[ind]>0)
     {
      double   price=low_day+ind*point;
      datetime time1=day_rate[0].time;
      datetime time2=time1+boxes_asia[ind]*box_length*InpMultiplier;
      string   prefix=ExtPrefixUniq+"_"+day_prefix+"_Asia_"+StringFormat("%.5f", price);
      DrawBox(prefix, price, time1, time2, InpAsiaSession);
     }
  }

for(int ind=0; ind<day_size; ind++)
  {
   if(boxes_europe[ind]>0)
     {
      double   price=low_day+ind*point;
      datetime time1=day_rate[0].time+boxes_asia[ind]*box_length*InpMultiplier;
      datetime time2=time1+boxes_europe[ind]*box_length*InpMultiplier;
      string   prefix=ExtPrefixUniq+"_"+day_prefix+"_Europe_"+StringFormat("%.5f", price);
      DrawBox(prefix, price, time1, time2, InpEuropeSession);
     }
  }

for(int ind=0; ind<day_size; ind++)
  {
   if(boxes_america[ind]>0)
     {
      double   price=low_day+ind*point;
      datetime time1=day_rate[0].time+(boxes_asia[ind]+boxes_europe[ind])*box_length*InpMultiplier;
      datetime time2=time1+boxes_america[ind]*box_length*InpMultiplier;
      string   prefix=ExtPrefixUniq+"_"+day_prefix+"_America_"+StringFormat("%.5f", price);
      DrawBox(prefix, price, time1, time2, InpAmericaSession);
     }
  }
- As a result, the chart will show the market profile for one day.
The function that draws line segments:
//+------------------------------------------------------------------+
//| Draw color box                                                   |
//+------------------------------------------------------------------+
void DrawBox(string bar_prefix, double price, datetime time1, datetime time2, color clr)
  {
   ObjectCreate(0, bar_prefix, OBJ_RECTANGLE, 0, time1, price, time2, price);
   ObjectSetInteger(0, bar_prefix, OBJPROP_COLOR, clr);
   ObjectSetInteger(0, bar_prefix, OBJPROP_STYLE, STYLE_SOLID);
   ObjectSetInteger(0, bar_prefix, OBJPROP_WIDTH, 1);
   ObjectSetString(0, bar_prefix, OBJPROP_TOOLTIP, "\n");
   ObjectSetInteger(0, bar_prefix, OBJPROP_BACK, true);
  }
The segments are drawn using graphical objects - rectangles (you can also draw using trend lines by disabling the "ray to the left" and "ray to the right" properties for them). The function receives the coordinates of the rectangle in the form of its start and end time, and the price, which is the same for both sides of the rectangle. This results in a regular line with the color specified in the inputs.
By running the indicator on the EURUSD M30 chart, we can see the following picture of the market profile:
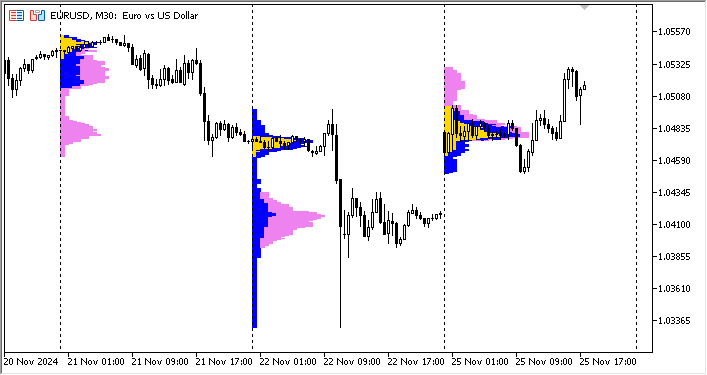
If we draw lines from each of the previous days (from its Point of Control), we can clearly see the levels of the "fair" price, which may well serve as support and resistance levels, or attraction (the gap of the current day may very well be closed, while this is the POC of the previous day).
Conclusion
By studying the Market Profile, you will be able to better understand market dynamics, identify key levels, and find efficient entry and exit points. The Market Profile differs from the tick chart by combining price, volume, and time in a convenient form. It allows identifying price equilibrium levels and analyzing who controls the market at the moment. This provides an advantage in trading decisions by allowing adaptation to changes in traders' fair value assessments.
Having familiarized ourselves with the Market Profile indicator supplied with the MetaTrader 5 client terminal, we now understand the simplicity of its operation, understand the logic of its construction, and can use it both to assess the market situation in the form provided, and to create something more advanced and complex on its basis.
For a full understanding and comparison with other concepts, you can read other works on the Market Profile presented on mql5.com:
- The Price Histogram (Market Profile) and its implementation in MQL5
- Market Profile — indicator for MetaTrader 4
- MarketProfile — indicator for MetaTrader 4
- MarketProfile — indicator for MetaTrader 5
The fully commented code of the indicator considered in the article is attached below for hyou to download and study.
Translated from Russian by MetaQuotes Ltd.
Original article: https://www.mql5.com/ru/articles/16461
Warning: All rights to these materials are reserved by MetaQuotes Ltd. Copying or reprinting of these materials in whole or in part is prohibited.
This article was written by a user of the site and reflects their personal views. MetaQuotes Ltd is not responsible for the accuracy of the information presented, nor for any consequences resulting from the use of the solutions, strategies or recommendations described.
 Developing a Replay System (Part 75): New Chart Trade (II)
 Price Action Analysis Toolkit Development (Part 31): Python Candlestick Recognition Engine (I) — Manual Detection
 From Basic to Intermediate: Recursion
 Neural Networks in Trading: Optimizing the Transformer for Time Series Forecasting (LSEAttention)
- Free trading apps
- Over 8,000 signals for copying
- Economic news for exploring financial markets
You agree to website policy and terms of use
Code Base
Volume Profile + Range v6.0
Olexiy Polyakov, 2016.06.30 12:46
Volume Profile + Range v6.0 (former TPO). Distribution of deals by price levels at a given time interval. Displayed as a histogram.Articles
Market Profile indicator
Artyom Trishkin, 2025.07.14 11:49
In this article, we will consider Market Profile indicator. We will find out what lies behind this name, try to understand its operation principles and have a look at its terminal version (MarketProfile).