 MetaTrader 5
 专家
专家
 指标
指标
 程序库
程序库
 实用工具
实用工具
 窗口小部件
窗口小部件
 规则
规则
适用于MetaTrader 4的新技术指标
 下面列出的技术指标信号对MetaTrader 4平台的开仓交易和平仓交易起着至关重要的作用。
指标的本质就是一种交易品种的数学转换,旨在预测价格变化。
下面列出的技术指标信号对MetaTrader 4平台的开仓交易和平仓交易起着至关重要的作用。
指标的本质就是一种交易品种的数学转换,旨在预测价格变化。 
The full target Signal scalp Indicator is a very powerful trading tool developed for MetaTrader 4 (MT4), designed to optimize your trading decisions with three distinct signaling modes: Trend, Pullback, and Breakout. Each signal mode is visually differentiated with unique on-chart icons for quick and effortless market reading. It features clear graphical projections for Stop Loss (SL) and Take Profit (TP) levels directly on the chart, streamlining risk management. While fully compatible with all

Wave Markers:自适应波浪图,附多周期信息面板 看清市场的真实结构,而不是噪音:已确认的波段高点与低点、穿过它们的趋势线,以及从 M1 到 W1 所有周期的情况,全部集中在一个面板里。 这是什么 Wave Markers 是适用于 MetaTrader 5 的图表结构指标。它会找出价格的转折点(波段高点和波段低点),用简洁的箭头标出,并围绕这些点提供实用工具:趋势线、全周期表格,以及实时点差和隔夜利息(Swap)显示。 指标不会发出"买入"或"卖出"指令,也不承诺任何结果。它只专注做好一件事:告诉你市场在哪里真正发生了转折,帮助你更快、更一致地阅读市场结构。 MT5-version: https://www.mql5.com/en/market/product/199158 为什么它不是又一个 ZigZag 传统的 ZigZag 使用固定距离(点数或百分比)来判断什么算转折。这一个数字大多数时候都不合适:市场平静时太大,会错过真正的波浪;市场快速时太小,会产生大量噪音。 Wave Markers 的做法不同: 反转阈值会根据当前波动率自动调整。 阈值以市场自身"典型波动幅度

MQL5 博客: https://www.mql5.com/en/blogs/post/776607 MT4 版本: https://www.mql5.com/en/market/product/198437 MT5 版本: https://www.mql5.com/en/market/product/198438
GRAVITY MAGNET [tambangEA] 是一款先进的市场结构与流动性吸引力指标,旨在帮助交易者识别价格的潜在吸引方向,并评估多空双方流动性力量的强弱对比。 该指标不依赖单一的趋势信号,而是分析多种结构性流动性来源,并根据强度、距离、时效性、市场形态及趋势背景对它们进行排序,最终将结果转化为直观易读的“市场引力”(Market Gravity)框架。 本指标定位为决策辅助工具,而非价格预测引擎。引力数值反映的是相对的市场吸引力与压力,而非未来价格走势的统计概率。 核心概念 金融市场的价格走势往往倾向于向流动性集中的区域移动。 Gravity Magnet 能够识别并排列这些区域,将其视为潜在的“流动性磁极”(Liquidity Magnets),包括: -

MQL5 博客 = https://www.mql5.com/en/blogs/post/776873 MT4 版本 = https://www.mql5.com/en/market/product/199357 MT5 版本 = https://www.mql5.com/en/market/product/199358
Pressure Breakout [tambangEA] 是一款专业的 MetaTrader 指标,旨在识别价格压力形态,评估形态内部的主导方向,并通过结合影线特征、波动率、成交量代理指标及价格扩张幅度来确认突破。 该指标不局限于单一 K 线的反应,而是在可配置的时间窗口内寻找一系列符合条件的影线 K 线,构建压力区域,监控该区域的发展,并等待与主导压力方向一致的突破。 工作流程简单明了: 拒绝(Rejection)→ 形态构建(Formation)→ 成交量(Volume)→ 突破(Breakout) 该指标还包含集成仪表板、交互式多品种导航、可视化的入场/止损/止盈参考线,以及自动检测经纪商交易品种前缀/后缀的功能。
主要功能 影线序列检测 Pressur

Trend Consensus 将十条移动平均线汇聚成一次清晰的投票,在两个周期上判断趋势方向。当两个周期达成一致时,指标会标记一个不重绘的入场点,给出基于 ATR 的 TP1、TP2、TP3 和止损位,并统计图表上每一个历史信号的最终结果。 内置功能:历史统计、多品种扫描器、推送和邮件提醒,以及可直接供 EA 调用的缓冲区。 工作原理 在每一根K线上,Trend Consensus 向十条简单移动平均线(周期 5 到 14)提出同一个问题:你在上涨还是下跌?上涨均线所占的比例就是趋势共识,以百分比和十段进度条显示。 投票同时在两个周期上进行: 本地周期 :您的交易图表,用于把握入场时机。 全局周期 :高一级的周期,用于确认方向。自动选择:M5 → H1、M15 → H4、M30 → H4、H1 → D1、H4 → W1。两个周期也可以手动设置。 当两个周期在同一方向上都达到所需的共识(默认 70%),并且这一一致刚刚形成时,就会出现信号。已经在进行中的趋势不会重复产生箭头。 两个可选过滤器可以让信号更严格: 更高周期过滤 (只顺着全局周期之上那个周期的方向交易)和 交易时段 (例如只

OHLC Timeframes Osw
OHLC Timeframes Osw 是一款必不可少的多时间框架指标,旨在直接在当前图表上清晰准确地投影多达 4 个更高时间框架的关键开盘价 (Open)、最高价 (High)、最低价 (Low) 和收盘价 (Close) 水平。它使价格行为 (Price Action) 和 ICT 交易者能够通过绝对的视觉控制和集成在图表上的交互式按钮识别流动性点、机构支撑和阻力,从而即时开启或关闭视图。
参数指南(输入菜单) 时间框架配置(时间框架 1 至 4) - Timeframe:选择要分析的更高时间框架(如月线、周线、日线、H4)。 - Read Backwards:绘制过去周期的数量,以便将当前水平与历史周期进行比较。 - Extend Lines:水平线向图表未来延伸的长度。 - Show Open / High / Low / Close:控制每个水平的可见性(选项:隐藏、仅当前、仅上一个、显示全部)。 - Show Separator:启用或禁用所选周期的垂直分隔线。 - Color / Style / Width:为每条价格线和分隔

MQL5 博客: https://www.mql5.com/en/blogs/post/776740 MT4 版本: https://www.mql5.com/en/market/product/199000 MT5 版本: https://www.mql5.com/en/market/product/199001
SUPPORT RESISTANCE PROFILE [tambangEA] 是一款先进的市场结构指标,旨在结合价格结构、成交量分布(Volume Profile)分析、波动率、价格拒绝行为以及水平位相互作用统计数据,来识别、评估并排列动态支撑位和阻力位。 与仅依赖摆动高点(swing highs)和摆动低点(swing lows)的传统支撑阻力指标不同,SUPPORT RESISTANCE PROFILE 增加了一个基于分布形态(profile)的验证层,有助于区分普通枢轴点与潜在的、更具市场意义的反应区域。 该指标被设计为一种市场环境与水平位分析工具,帮助交易者解答一个重要问题: 市场在何处最可能出现反应、价格拒绝、盘整或突破? 它适用于外汇、黄金、指数、大宗商品以

适用于 MT4 的 Crypto_Forex MACD 信号 METER 指标。 - 非常实用的 MACD 信号 METER 指标可同时显示 7 个时间框架的当前 MACD 值(高于/低于信号线)。 - 绿色矩形 - MACD 位于信号线上方。 - 红色矩形 - MACD 位于信号线下方。 - 外汇 MACD 信号 METER 指标可用作多时间框架交易系统的交易入场过滤器。 ............................................................................. Click here to see high quality Trading Robots and Indicators! 这是仅在 MQL5 网站上提供的原创产品。

适用于 MT4 的 Crypto_Forex“Acceleration Bar Pro ”(加速柱)指标——助您捕捉重大趋势。 - “Acceleration Bar Pro”指标是趋势交易的强大工具,能最大程度降低市场横盘震荡带来的干扰。 - 看涨加速柱(蓝色):图表上的某根K线,其最高价高于前5根K线的最高价,且其最低价低于后5根K线的最低价。 - 看跌加速柱(红色):图表上的某根K线,其最低价低于前5根K线的最低价,且其最高价高于后5根K线的最高价。 - 支持电脑端和移动端提醒功能。 - 配备信息显示面板:显示当前货币对的点差(Spread)和隔夜利息(Swap)。 - 信息显示面板还可展示账户余额、净值及保证金信息。 - 信息显示面板的位置可自由调整至图表的任意角落。 趋势交易: - 买入信号:图表上出现连续4根看涨加速柱。 - 卖出信号:图表上出现连续4根看跌加速柱。 Click here to see high quality Trading Robots and Indicators! 本产品为原创产品,仅在 MQL5 网站上独家提供。

Confluence Meter:26 个指标,一个综合评级 Confluence Meter 会计算 26 个常用指标的信号,并将它们汇总为简洁的"卖出 / 中性 / 买入"评级。无需打开几十个窗口,也不必手动比对读数。看一眼面板,就能知道所选周期上市场偏向哪一边。 MT5-version: https://www.mql5.com/en/market/product/199466
Our products: https://www.mql5.com/en/users/trendhunter/seller 图表上显示的内容 **Oscillators 仪表盘。**由 11 个震荡指标组成的评级:RSI、Stochastic、CCI、ADX、Awesome Oscillator、Momentum、MACD、Stochastic RSI、Williams %R、Bulls/Bears Power 和 Ultimate Oscillator。 **Moving Averages 仪表盘。**由 15 个趋势指标组成的评级:周期为 10、20、30、50、100、200 的 SMA 和

Pivot Tide — 波段拐点、自动趋势线与基于趋势线的趋势方向判断 Pivot Tide 是一款适用于 MetaTrader 4 的指标。它会自动把图表划分为若干波段,标记每个波段的高点和低点,通过这些拐点绘制趋势线,并根据趋势线的状态判断趋势方向。所有内容都直接显示在图表上,并附带一个紧凑的信息面板。 适用于任何品种、任何周期。 MT5-version: https://www.mql5.com/en/market/product/199662
指标的功能 识别波段。 波段由两条移动平均线的相对关系决定:快速 SMA 和慢速 LWMA。快线在慢线上方时为上升波段,快线在慢线下方时为下降波段。 标记拐点。 当波段结束(两条均线交叉)时,指标会在该波段的极值处放置标记:上升波段的最高点,或下降波段的最低点。 绘制趋势线。 通过相邻的同类拐点连线。 跟踪趋势线突破。 如果价格收盘突破某条趋势线,该线即视为已被突破,并在突破的K线处截断。 根据趋势线判断趋势 ,并在面板上显示(UP、DOWN 或 RANGE)。 波段在两个级别上计算: 主要波段 (较大的波段,默认长度 70)和 次

Multi Oscillator Divergence MT4 – RSI, CCI, MACD, OBV, Stochastic & AO
Multi Oscillator Divergence MT4 是一款高级 Forex divergence indicator(外汇背离指标) ,旨在帮助交易者通过一个强大的工具,使用六种常用技术振荡指标识别看涨背离和看跌背离。 无需在多个指标之间频繁切换,这款 MT4 Divergence Indicator 可同时分析 RSI、CCI、MACD、OBV、Stochastic 和 Awesome Oscillator (AO),并直接在图表上清晰显示潜在背离以及多指标确认信息。
Key Features 1. 6 Oscillators in One Indicator
通过一个 MT4 指标使用 RSI、CCI、MACD、OBV、Stochastic 和 AO 检测背离。 2. Separate Oscillator Analysis
每个振荡指标都会独立分析并显示自身的背离信号,方便您轻松比较不同信号。

适用于 MT4 的 Crypto_Forex 指标 HTF 移动平均线。 - 使用专业的 MT4 HTF 移动平均线指标升级您的交易方法。HTF 代表“更高时间框架”。 - 该指标非常适合趋势交易者进行价格行动入场。 - HTF 移动平均线指标允许您将更高时间框架的移动平均线附加到当前图表,以便跟踪主要趋势方向。 - 指标显示更高时间框架的趋势 --> 这始终是一种盈利方法。 - HTF 移动平均线指标让您有机会以低风险获得高额利润。 使用方法: - 将日线移动平均线附加到四小时或一小时图表。 - 将四小时移动平均线附加到一小时、三小时或十五分钟图表。 - 等等(参见图片)。 ........................................................................... 点击这里查看高质量的交易机器人和指标! 这是仅在 MQL5 网站上提供的原创产品。

高级自定义加密货币外汇指标“自适应趋势震荡指标”——MT4平台高效辅助交易工具! 无需重新喷漆。 ..................................................................................................... - 该指标是新一代震荡指标——请查看图片了解如何将其与主要趋势指标结合使用。 - 它具有可调节的自适应超卖/超买区域。 - 该震荡指标是一个辅助工具,用于从超卖/超买区域找到进入主要趋势方向的精确入场点。 - 超卖区域:绿线下方。 - 超买区域:蓝线上方。 - 将自适应趋势震荡指标与任何合适的趋势指标结合使用。 - 它比标准震荡指标更加精准。 - 该指标可用于任何时间周期。 - 内置PC和移动设备提醒。 Click here to see high quality Trading Robots and Indicators! 本产品为原创产品,仅在MQL5网站提供。

前10名特价!
JET PRO
适用于 MetaTrader 4 的战术市场扫描器
将您的图表变成驾驶舱。
JET PRO 是一款信号系统,配备战斗机式抬头显示器 (HUD)。它能发现交易设置,在蜡烛图收盘时确认,并在您的图表上绘制完整的飞行计划:入场点、止损点以及 1R 到 5R 的五个盈利目标。然后,它会实时跟踪每个信号,从起飞到降落。没有杂乱的面板,无需猜测。只有一个简洁、发光的 HUD,让您一目了然地了解交易状态。
如同驾驶舱般的设计
- HUD。无边框显示屏,带有角标和发光的扫描线。当 JET PRO 搜索时,该线会来回移动;当锁定信号时,该线会稳定下来,同时“买入”或“卖出”的“锁定”读数会闪烁。
- R 阶梯仪表。一根K线显示整个交易过程,从止损位(-1R)到最终目标位(+5R)。实时指针追踪当前结果,金色标记显示达到的最佳水平,价格触及目标位时,目标位会亮起。
- 水平网格。入场点、止损位、TP1-TP5 以及以点数表示的风险始终可见。已达到的目标位会高亮显示。
- 实时读数。浮动盈亏以R和点数表示,K线收盘倒计时、点差、波动率(ATR)和趋势方向。

Retest Pivot Signals 是一款 MetaTrader 5 指标,用于识别关键枢轴位(pivot)的突破,并且只在价格回踩该位置之后才发出信号,即价格回到被突破的线并从该处反弹。这样可以过滤一部分假突破:信号出现在价位得到确认之后,而不是突破的瞬间。 MT5-version: https://www.mql5.com/en/market/product/200224
工作原理 指标寻找枢轴高点和枢轴低点。当某个高点(或低点)左右两侧各有设定数量的K线,且其高点更低(或低点更高)时,该枢轴被确认。 图表上绘制两条阶梯线: 红色 为最近的枢轴高点, 绿色 为最近的枢轴低点。橙色线为 EMA。 做多(Long): 收盘价高于最近的枢轴高点(向上突破),随后价格回到该位置,触及容差区域,并重新收于该位置之上。K线下方出现绿色向上箭头,标注“Long”。 做空(Short): 相反。收盘价低于最近的枢轴低点,价格从下方回到该位置,并收于其下方。K线上方出现红色向下箭头,标注“Short”。 开启 EMA 过滤后,只有收盘价高于 EMA 才允许 Long,低于 EMA 才允许

你知道你的经纪商现在的真实点差是多少吗?
Realtime Spread Monitor 是一款极简但极其精确的工具,用于实时监控当前点差。 该指标的设计严格侧重于最高性能。与笨重的同类产品不同,它在运行时没有历史缓冲区、繁重的计算循环或日志记录。它占用绝对最少的内存,且不会造成卡顿,是任何 VPS(即便是性能最弱的)上的完美选择。 为什么选择 Realtime Spread Monitor?
在交易中,尤其是剥头皮交易中,速度和直观性至关重要。我们去除了所有多余的东西:您将获得一个清晰的当前点差文本标记(以点为单位),以及严格跟随价格移动的 Ask/Bid 视觉线。没有任何东西会分散您的交易注意力。 主要特点: Ultra-Lightweight 架构: 该指标不会让终端的 CPU 和图形子系统超载。 绝对透明: 即时计算 Ask 和 Bid 之间的差值,没有任何平均或延迟。 智能 UI: 点差文本整齐地向当前K线右侧偏移,因此不会覆盖图表和价格形态。 灵活自定义: 完全控制颜色、字体大小和 Ask/Bid 线的样式。 通用性: 在任何时间周期和货币对上都能完
FREE

Auction Flow Pro — 清晰呈现市场环境 Auction Flow Pro 将成交量分布、市场热度、流动性区域和 VWAP 整合到简洁的 MetaTrader 5 图表工作区中。它适合希望评估市场状况、研究潜在机会,并清楚查看重要价格区域的交易者。 产品结合直观的图表展示与紧凑、可调整的仪表板。关键数据便于查看,交互式控件让您根据自己的交易习惯调整界面。 了解价格背后的市场环境 结合周围的市场信息,价格走势更容易理解。Auction Flow Pro 在同一视图中呈现多个互补的分析角度,帮助您观察市场活动集中的位置、价格与参考水平的关系,以及附近值得关注的区域。 您可以使用这些工具进行图表分析、交易时段准备或潜在交易形态评估。产品旨在整理有用的信息,支持更加审慎的决策。 成交量分布与市场热度 成交量分布展示不同价格水平上的估算交易活动。颜色变化让相对活跃程度更容易辨认。 控制点(POC)和价值区域参考水平提供额外的市场背景。清晰排列的标签便于识别重要位置,鼠标悬停信息则提供更多细节,避免图表过于拥挤。 流动性区域可视化 Auction Flow Pro 在价格图表上标示与

成交量在哪些价位成交,逐日呈现:每个交易日或交易时段都有各自的成交量分布图,附有其 POC、价值区域高点和价值区域低点 ,以及市场尚未回到过的 裸 POC ,延伸绘制到右边缘,并标出各自的日期和价格。在每个周期上都基于一分钟 K 线构建,因此 M5 和 H4 上的价位相同,已结束交易日的价位也不会移动。 绘制内容 每个交易日的分布图 ,或每个交易时段的分布图,默认绘制最近 10 个("Profiles drawn on the chart"):每个价位上的成交量以直方图显示,位于 K 线后方,价值区域用炭火色,其余部分用低调的灰色。 POC (控制点,即成交量最大的价位)以实线绘制, 价值区域的高点和低点 以点线绘制。 裸 POC :已结束交易日的 POC,只要之后没有 K 线触及过它,就会持续绘制到右边缘,并标出它的日期和价格,默认在最近 20 天内查找("Look for naked POCs in the last N profiles")。价格触及它之后,这条线在触及处结束,并变为灰色。 今日动态 POC 以细阶梯线显示,呈现它随当天行情逐步形成时所处的位置。 可选,默认关闭:

Gaps 将更高周期留下的价位绘制在您用来交易的任何图表上。每个价位都读取自经纪商的日K线,因此 1 分钟图和 4 小时图会在相同位置显示同一张地图。单一文件,不使用 DLL。 四类价位,基于月线、周线和日线K线 公允价值缺口(FVG):三根K线,中间一根为推动K线,外侧两根互不接触。价格在此未经交易便离开。 影线区:摆动K线的拒绝影线,从实体边缘延伸到极值。 失衡区:两根相邻K线实体之间的缺口。 重叠区:两根同向推进的K线实体共同覆盖的区间。 价位只由已收盘的月、周或日生成。价位绝不会回溯到过去:价位只在其K线收盘后才出现,并且只有在之后的K线收盘穿越它时才会改变。价格收盘穿越的价位会翻转(此后从另一侧起作用);再次被收盘穿越,该价位即被移除。 层级让图表保持清晰:开盘缺口优先,其次是月线、周线和日线。与已放置价位处于同一价格的价位不会显示,因此不会有两个区域叠在同一价格上。 子价位:每个区域和每个开盘缺口都在其高度的 .25、.50 和 .75 处画出虚线(.50 为较长的虚线),并在区带右侧标注 .25 / .50 / .75。较窄的区带只显示 .50,非常窄的区带则不显示,因此

MT4 凯利公式风险管理面板
一款基于凯利公式的仓位计算与风险审计工具。读取当前品种的已平仓历史,计算真实胜率与盈亏比,转化为三个可执行数字:最多可开多少手、止损能放多宽、当前实际承担多少风险。只显示,不下单。
面板显示内容
【历史交易统计】 当前胜率、当前败率(带胜/负场次) 盈亏比(平均盈利 ÷ 平均亏损) 统计样本、样本参考度(不足/低/中/高)
【止损设置】 计算方式(历史平均 / 固定设置) 历史平均亏损距离(双单位:价格 + 点数) 历史平均盈亏比(带平均盈利/亏损金额) 应用止损距离、止盈目标倍数
【账户风险信息】 账户余额、账户净值 凯利风险比例、建议风险资金(含占净值百分比)
【当前交易建议】 风险上限手数(可开低于此值,附算式) 多单/空单:持仓手数、均价、参考止损、参考止盈 当前持仓风险(按真实止损价计算,净敞口) 极限风险(多空叠加,最坏情况) 还可承受止损(按当前持仓总手数计算剩余点数) 温馨提示:重仓猛干,迟早完蛋。

Reversal Edge System是一款专为MetaTrader 4打造的专业顶底工具指标。它识别潜在趋势信号区域,输出清晰的交易信号,并通过多周期趋势分析做信号滤波,简化想象交易形态。 指标实时展现市场情绪:强烈看多强烈看空偏多偏空多空闭合 每个信号都涉及预设止盈(TP)与止损(SL)价位,做好风险管理。指标内置信号回测功能,统计核心数据:胜率、信号总数,交易者可以直接在图表上可视化评估历史表现。 核心功能: 顶底信号 多周期(MTF)趋势确认过滤器 实时市场情绪标签 每个信号自带止盈与止损 信号回测模拟 胜率与信号总数统计 支持外汇、加密货币、指数与商品 无重绘提示 借助可验证的食谱格局与内置风控,更智能地交易,获得您的交易优势。

Round numbers on your chart, and a notice when the price gets close. RoundNumberAlert draws horizontal lines at round numbers (150.000, 150.500 ...) and watches them for you. When the price enters the touch range, only that line blinks and you get one notification. Major round numbers stand out in gold, and a small panel shows how many pips are left to the next round number above and below. Features Round-number lines: the step starts at 10 pips (for example 50 pips: 150.000, 150.500 ...). Major

Which currency is strong right now — in one panel. CurrencyStrength takes the RSI of the 28 pairs of USD, EUR, JPY, GBP, AUD, CHF, CAD and NZD, turns it into a score from −100 to +100 for each currency, and shows them as bars, strongest first. Features Strength ranking: strong currencies in green, weak ones in red, scored from −100 to +100. Automatic symbol detection: the pairs are found from each symbol's base and profit currency, so suffixes and prefixes (EURUSD#, EURUSD.pro, m.EURUSD, EURUSDm

Trendlines drawn for you — and a good shape kept as your basis. TrendLineSnap finds the swing highs and swing lows on your chart, joins them and draws one high trendline and one low trendline. Triangles, channels, wedges and horizontal levels used in line trading show up as lines. Automatic trendlines are redrawn whenever a new swing forms. When you see a shape you want to trade, save it. The saved line does not move. When the price comes near it again, show the saved line next to the current li

Where is the price inside the range — in one panel. BoxRangeSnap looks for price zones where the highs and lows touched the same top and bottom again and again, and draws them as a big box and a small box. The panel keeps showing the distance from the price to the top and bottom of the current box. Features Automatic range boxes: a big box and a small box, newest first. The current box is highlighted and extends to the last closed bar. Adjustable detection: minimum touches on the top and bottom,

The Dow Theory structure of the chart — in one look. DowTheoryVisual labels every swing high and low as HH, HL, LH or LL and draws a zigzag colored by the trend: blue for an uptrend, red for a downtrend, gray for a range. The panel keeps showing the trend of the current chart and of two higher timeframes side by side. Features HH / HL / LH / LL labels: each swing high and low is compared with the previous one. Trend-colored zigzag: up blue, down red, range gray. The color changes on the bar wher

Tired of false signals?
Trade with reliable buy & sell arrows! Download now and see how it works !
High-Performance Signals Suitable for trend-following or trend trading Never repaints, recalculates, or backpaints signals
This is FREE / DEMO / version and works only on EURUSD M15, M5“ (demo version; no suffix/prefix brokers). Test it FREE now - see real results!
TREND REVERTING PRO full version here : Get accurate arrows on every setup! Trade safely - full version wor
FREE

BBMA REENTRY — SNR + DOTLINE + FIBO MUSANG 1. Tentukan Arah Trend Pastikan setup Reentry yang dicari searah dengan Trend Filter pada Panel . Utamakan BUY saat trend bullish dan SELL saat trend bearish . Hindari Reentry yang berlawanan dengan trend utama. 2. Cari Reentry pada Time Frame Besar Cari titik BBMA Reentry ketika candle masuk atau menyentuh area MA5/10 High atau MA5/10 Low . Time Frame besar menjadi acuan utama untuk menentukan area Reentry. 3. Gunakan Time Frame Konfirmasi yang Lebi

FXB Confluence Engine follows the trend with a range filter and, each time that trend turns on a closed bar, scores how much of the market agrees with the new direction. Momentum and the EMAs, four other timeframes, a higher-timeframe bias, the same filter at two wider settings, volatility, RSI and volume each add points, and a choppy market takes points away. A BUY or SELL prints only when the score reaches your minimum and every filter you have switched on is open. A dashboard on the chart sh

SMC Scanner – User Guide
Overview
SMC Scanner is a multi-symbol, multi-timeframe dashboard for MetaTrader 5. Every cell shows the key Smart Money Concepts state of one symbol on one timeframe. You can scan the whole market at a glance instead of opening every chart.
The SMC engine inside the scanner uses the same calculation logic as the Smart Market Structure Concepts chart indicator. With the same settings, each cell shows what the chart indicator would show on that symbol and timeframe.

See the market's fear level on the chart you trade. VixChecker shows the VIX (the volatility index often called the fear index) in a sub-window as one bar per day, colored by level: normal (blue), caution (yellow, 20 or above by default) and fear (red, 30 or above). The current value, the change from the previous close and the time of the value are shown in a small panel, and the value can also be shown on the main chart. Where the VIX values come from (please read before buying) The indicator d

Entry signals as finger marks: yellow for trend-following, pink for counter-trend. SignRAMB combines RSI, ATR, MACD, a moving average, Dow theory and the candles, and marks the places where the price may turn up or down, based on past chart patterns. A finger pointing up is a buy, pointing down is a sell. Signals are decided on closed bars and never repaint. Signals are not always right. Use them as one indicator, together with your own reading of the chart. They are meant for the move right aft

Momentum Intelligence for MT4 Read momentum at the current price and separate movement context from a confirmed structure change. What it displays Price-linked gauge with a historical anchor, smooth motion and clear color zones. Momentum histogram for reviewing strength and direction across past bars. Confirmation arrows combine momentum weakening with a local structure break after bar close. Configurable history, gauge boundaries, display scale and notifications. How to use it Start with the de

Reversal Intelligence for MT4 Follow potential reversal setups through three stages: preparation zone, confirmation and the LOW/HIGH boundary. What it displays Classic, Aggressive and Strict selection modes. Strict adds an embedded trained model filter and a configurable selection rating. Preparation zones and confirmed BUY/SELL events are displayed separately. LOW/HIGH boundary marks the setup extreme; it is not an automatically placed stop order. Control the number of recent signals, history d

Market Projection Pro for MT4 Build a visual price projection from a historical analysis window that you select on the chart. What it displays Manual historical analysis boundaries directly on the chart. Cycle components and a composite projection displayed together. Separate controls for analysis length and forward projection horizon. Chart controls for calculating, building, clearing and inspecting the projection. How to use it Select the historical window, calculate the cycle components, then

Reversal Edge Prime Reversal Edge Prime is a comprehensive and highly visual trading tool designed to automatically identify high-probability Reversal and Continuation zones. What sets this indicator apart is its ability to provide a complete, ready-to-use trading plan right on your chart—showing you exactly where to enter, where to place your stop loss, and where to take profit. The indicator is strictly non-repainting (signals are confirmed on candle close) and is incredibly easy to use for bo

Представляю новый индикатор — Profit Reaper! Это чистый Price Action, усиленный алгоритмом. Как он это делает? Мощный сканер Engulf-паттернов: Сканирует рынок 24/7 в поиске сильнейших паттернов "Поглощение". Фильтр RSI | инд. стабильности: Отсеивает слабые сигналы с помощью RSI и фильтра стабильности. ️ TP/SL на основе ATR: Мгновенно определяет оптимальные TP и SL на основе ATR. ️ Мгновенные алерты на сигналы Основа — паттерн "Поглощение": Индикатор находит классические бычьи и
FREE

Order Block Confluence Pro automatically detects institutional Order Blocks and Fair Value Gaps across multiple timeframes, scoring each Order Block for quality and confluence — so you see higher-conviction zones at a glance. Built for ICT/Smart Money Concepts traders who want precision across Forex, Crypto, Gold, Indices, and Stocks. Why This Indicator Exists Most Order Block tools answer: “Where are the Order Blocks?”
The better question is: “Which ones actually matter?”
Order Block Confluenc

ToggleTrueClose — The familiar MT4 line chart, just better. ToggleTrueClose is a free MT4 indicator for traders who want a clear view of where candles actually closed. It connects the closing prices of completed candles and marks each close with a distinct dot. The result is a simple, readable chart that makes individual closing prices easier to follow. Only completed candles. The current, unfinished candle is excluded. The line ends at the latest confirmed close and extends when another candle
FREE

ArrowForce MAD — вход в рынок без лишнего шума! Умный индикатор, который: Не перерисовывается Работает в тестере Даёт чёткие сигналы BUY/SELL Использует проверенные алгоритмы: ️ EMA10 / EMA20 ️ Полосы волатильности (SMA + StdDev) ️ MAD-фильтрация для отсева слабых сигналов ️ Alerts и Push-уведомления Идеален для: M5–H1, трендовой и коррекционной торговли.
FREE

StrikeZone Arrows Стрелки входа без перерисовки (SuperTrend-логика) Тренд-панель M1–D1 (7 ТФ!) Авто TP/SL + ATR-риск — 5 целей Зоны спроса и предложения (S&D) Push / Sound / Email уведомления SuperTrend, ATR, MA-фильтры, объём, momentum. Подходит как для скальпинга, так и для внутридневной и свинг-торговли. ️ Важно: Индикатор не даёт 100% гарантий — используйте его как часть своей торговой системы и обязательно управляйте рисками. ️ Торгуй с умом. Это инструмент — не
FREE

Automated Timeframe cycling with Symbols centered. Force every timeframe onto one clock window, so the story you see on Daily is the same story you are slicing on H4, H1, and M1. Traders usually flip timeframes and lose the span. A Daily chart shows a few weeks, then M15 shows a few hours, and the eye treats them as different markets. TASSERACT locks the window to N bars of the highest enabled timeframe — default 10 Daily — and maps every lower timeframe to that same stretch. You stay inside o
FREE

MultiLayer Signal — многоуровневый аналитический индикатор
Индикатор MultiLayer Signal объединяет сразу несколько подходов к анализу рынка: Уровни поддержки и сопротивления (на основе экстремумов за заданный период) Паттерны поглощения (бычьи и медвежьи) Сигналы на основе трендовой динамики Встроенный ZigZag с настраиваемой чувствительностью Многоуровневая EMA-фильтрация (микро-, макро- и быстрые/медленные скользящие)
️ Особенности: Возможность выбора режима: ️ “Закрытая свеча”
FREE

Angora Patterns finds, draws and tracks chart patterns for you. It recognises 23 classic chart patterns, 8 harmonic patterns and 13 candlestick patterns, and gives every pattern a breakout level, a target, an invalidation level, a state and a quality score. Chart patterns: Double Top and Bottom, Triple Top and Bottom, Head and Shoulders, Inverse Head and Shoulders, Rounding Top and Bottom, Ascending, Descending and Symmetrical Triangle, Rising and Falling Wedge, Rectangle, Ascending and Descend

Before You Buy the Ferrari, Check the Fuel. I have traded for more than 20 years. Universal Currency Power brings my approach to reading currency strength and remaining trend potential onto your MetaTrader 4 chart. To my knowledge, it is the ONLY MT4 currency power indicator that combines a strength reading with this view of how much directional “fuel” may remain. The Difference That Matters. All the other currency strength meters I know give me a picture of which currencies are strong, weak or

**Know exactly where your grid or martingale basket blows up – before you trade it.**
Grid and Martingale Risk Simulator is a visual what-if tool for traders who use grids, martingale, averaging or hedged baskets. Place virtual BUY and SELL orders directly on the chart, drag them to any price, and the indicator recalculates your simulated account in real time: Balance, Equity, Margin, Free Margin, Margin Level, the Margin Call price and the Stop Out price.
The indicator never opens, modifies

MarketFlow Indies MarketFlow Indies is a clean MT5 chart indicator designed to help traders read directional flow, confirmed Buy/Sell signals, market structure, reaction zones, and spread information in one simple visual workspace. The indicator focuses on chart clarity. Signals are displayed directly on the main chart with compact Buy and Sell labels, colored flow lines, optional structure marks, and a small dashboard for quick signal review. Expert Version MT5 : https://www.mql5.com/en/market

Liquidity Hunter is a liquidity and market structure indicator for MT4 and MT5 that only keeps the levels nobody has taken yet. A swing high stops being drawn on the bar that trades through it. Yesterday's high disappears the moment price clears it. What's left on the chart is the stops that are still sitting there. That matters more than it sounds. On GBPUSD H1 from January 2020 to September 2026, 97.8% of daily highs and lows were taken out, and half of them within about 14 hours of the new da

RSI Panel Pro is a multi-timeframe RSI indicator for MetaTrader 4 that combines the traditional RSI, RSI EMA Signal, Momentum, an EMA trend filter, and an MTF summary panel. Its goal is to provide a quick overview of momentum, RSI levels, multi-timeframe trends, and the latest signals without the need to constantly switch between timeframes.
This indicator is best suited as a tool for signal confirmation and market context filtering; a single RSI signal should not be used as the sole basis for

1. Descripción general
OTT Awesome Oscillator Alarm es un indicador para MetaTrader 4 (MT4) diseñado para detectar y alertar sobre
señales alcistas y bajistas basadas en el Awesome Oscillator (AO). El indicador incorpora tres estrategias
clásicas: Zero Line Crossover, Saucer y Twin Peaks.
Además de las señales visuales mediante flechas, el indicador puede generar avisos mediante ventana
emergente, sonido y notificación Push. El sistema está pensado para trabajar con la última vela cerrada y

My Trading Checklist helps you bring structure to one of trading’s most demanding tasks: following your own rules consistently when money and emotions are involved. Trading involves probabilities. There is no “holy grail” system that can guarantee a 100% win rate. Even a carefully researched strategy can produce losing trades and uncomfortable losing sequences. The aim is to combine a strategy with positive expected value after trading costs with disciplined money and risk management, then apply

ALMA Trend Target is an ALMA-based trend identification system that combines slope-normalized momentum confirmation with standard deviation band validation to determine trend state, and automatically generates a complete position planning framework on each trend flip including a structure-derived stop loss, R-multiple take profit targets with proximity highlighting, and a risk zone visualization that tracks target hits and stop events throughout the position's active lifecycle. How It Works ALM

Institutional Checklist You know your rules. The difficult part is following them when you want the trade. The market starts moving. One indicator looks convincing. Another disagrees. You feel the pressure to act—and suddenly, the conditions you carefully defined yesterday become negotiable today. Institutional Checklist brings your attention back to your process. This interactive indicator for MetaTrader 4 guides you through your own analysis, one component at a time, then combines your answers

テクニカル指標開発の第一人者であるトム・デマークが考案した TDシーケンシャルは、 トレンドの転換点を判断するのに有用なインディケータです。このインディケータは TDシーケンシャルを裁量およびEAで実際に利用してきた私自身の経験から、より手軽に、かつ効果的に活用できるよう作成された裁量トレード用サインツールです。
この TDシーケンシャルをSupply and Demandと合わせて利用できるのがこのツールの最大の特徴です。例えば価格がDemandゾーンにあるときに TDシーケンシャルのシグナルが出ればより高い精度で反発が期待できます。
また、強いトレンドが生じている際に多くのだましが生じるのはTDシーケンシャルの弱点と思われますが、これを克服するために強力なフィルターを装備しています。また、最も有効と思われるセットアップ9に絞ってサインを発信します。
全通貨ペア、全タイムフレームで利用できます。勝敗判定機能により、このインディケータの直近の相場環境に対する有効性を確認できます。
設定項目は下記のとおりです。 Long...Long方向のシグナルを有効にします。Go

Market Vision 10 Market Vision 10 is a graphical market analysis dashboard for MetaTrader 4. It combines ten market indicators in one clear view to help traders understand market direction, momentum, volatility and sentiment without opening multiple indicator windows. The dashboard uses color gradients from red through yellow to green, making the current market condition easy to read at a glance. Included indicators RSI – shows relative market strength and overbought or oversold conditions. MACD
FREE
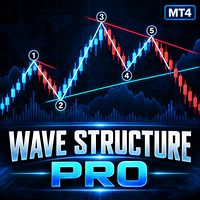
Wave Structure Pro is a technical analysis indicator for MetaTrader 4 designed to help traders identify market swings, wave structures, trend direction, dynamic trendlines and potential target levels directly on the chart. The indicator automatically analyzes price movement and presents the market structure in a clear visual format. It can be used on Forex, Gold, Indices, Commodities and other symbols available in MetaTrader 4. MAIN FEATURES • Automatic wave structure detection
• Automatic wave

Welcome Please note that I am currently uploading all my precious indicators. (It takes time with all the files, names, pics etc.) Feel free to ask questions.
This indicator works on all TFs and instruments, from AUDCAD to Gold (Any vehicle).
When price runs into one of these lines, then we would assume a reversal might happen. For Binary Options:
Imagine there is 2min 23 sec remaining of the chart candle, price hit the S/R line, then trade the remainder time.this chart is an M5 chart when pr

Headline. One Entry. No Guesswork.
Subheadline
Three EMAs confirm the trend. MACD filters the noise. The steepness arrow fires your entry. That arrow is the only signal you'll ever act on.
THE PROBLEM
You've been here before.
You see a trend forming. You enter. It reverses.
You wait for confirmation. The move is already gone.
You pile on indicators. You get more signals. You get more confusion. You get more losses.
The problem isn't you. The problem is you have too many signals and none o

### Vertex Pulse MT4: Precision HYBRID Indicator
**Vertex Pulse** is an institutional-grade hybrid indicator engineered specifically for MetaTrader MT4. A volatility-adapted hybrid indicator for MetaTrader MT4 (Vertex Pulse) that pairs Average True Range (ATR) volatility expansion bands paired with tick volume surge filters to signal high-probability swing and momentum entries with real-time multi-bar execution signals and on-chart signal markers and terminal alerts.
---
### Key Capabilities

Welcome Please note that I am currently uploading all my precious indicators. (It takes time with all the files, names, pics etc.) Feel free to ask questions.
Smart Volatility Matrix is an advanced multi-preset technical indicator designed for MetaTrader 4, engineered to map out market volatility dynamics across 9 distinct parameter blocks simultaneously in a clean separate window.
Overview Navigating changing market conditions requires more than a single moving average or standard band. The

Welcome Please note that I am currently uploading all my precious indicators. (It takes time with all the files, names, pics etc.) Feel free to ask questions.
FX777 Markov Heatmap V35 is an institutional-grade analytical indicator designed for MetaTrader 4, built around advanced multi-factor quantitative modeling and Markov state transition matrices to map out market regime shifts in real time[cite: 12].
Core Logic & Strategy: How to Use It Professional price action and Smart Money traders k

Welcome Please note that I am currently uploading all my precious indicators. (It takes time with all the files, names, pics etc.) Feel free to ask questions.
FX777 QUANTUM RSI: Sovereign Quantum Stability v8.0 Overview Step into the next tier of institutional-grade technical analysis with FX777 Quantum RSI (v8.0) . Moving far beyond traditional, lagging indicator models, this subwindow masterpiece integrates dynamic volatility-based gates with an advanced Persistence Engine , filtering out f

Welcome Please note that I am currently uploading all my precious indicators. (It takes time with all the files, names, pics etc.) Feel free to ask questions.
FX777 Iceberg Reversal V3 – Sales Description Overview The FX777 Iceberg Reversal V3 is an advanced MetaTrader 4 indicator built upon the FX777 Master Trading Protocol . Designed for elite precision, it identifies institutional order flow absorption, liquidity traps, and dynamic mean reversion extremes to deliver high-probability revers

### Crossfire Pro MT4: Precision HYBRID Indicator
**Crossfire Pro** is an institutional-grade hybrid indicator engineered specifically for MetaTrader MT4. A volatility-adapted hybrid indicator for MetaTrader MT4 (Crossfire Pro) that pairs Average True Range (ATR) volatility expansion bands paired with tick volume surge filters to signal high-probability swing and momentum entries with signals evaluated strictly on closed bars to prevent repainting and on-chart signal markers and terminal alert

QCL Adaptive Band Oscillator — MetaTrader 4 A smooth 0–100 oscillator with adaptive reference bands for a clearer view of price momentum. QCL Adaptive Band Oscillator combines smoothed price calculations with dynamic upper and lower bands. Displayed in a separate indicator window, it helps you examine momentum swings, potential turning points, and divergences between price and the oscillator. A smooth transformation keeps the oscillator and both bands within the 0–100 range , with a center refer
FREE

Volume Divergence Pro shows whether volume confirms the trend and marks regular and hidden divergences on price and indicator. Volume Divergence Pro measures the direction of price with linear regression over a fast and a slow window, and checks whether trading volume is supporting that move or fading away from it. Swings in the indicator are compared with swings in price to find divergences, which are drawn both in the indicator window and directly on the candles. How it works
The fast regressi

CISD - Change in State of Delivery indicator for MetaTrader 4. In Smart Money Concepts (SMC) and ICT methodology, a Change in State of Delivery (CISD) marks the moment price stops delivering in one direction and starts delivering in the other. It is often the first confirmation of a market structure shift (MSS) or change of character (CHoCH), and it usually appears before a classic break of structure (BOS) forms. This indicator detects CISD objectively on any symbol and timeframe, and shows the

SMT Divergence Multi Pair compares the swing highs and swing lows of the chart symbol with up to two correlated symbols and marks the places where they disagree. This is the Smart Money Technique (SMT) divergence used in ICT and Smart Money Concepts analysis: one market moves beyond a previous high or low while its correlated market does not confirm the move. How it works The indicator finds confirmed swing highs and swing lows on the chart symbol and compares each new swing with the previous on

Similar to the Sieera chart, the channel indicator is quite good. It can be applied to foreign exchange, gold, silver, and stock index futures. Using a 30-day SMA cycle, the outer track is 1.8 and the inner track is 1.4. Similar to the Sieera chart, the channel indicator is quite good. It can be applied to foreign exchange, gold, silver, and stock index futures. Using a 30-day SMA cycle, the outer track is 1.8 and the inner track is 1.4.
123456789101112131415161718192021222324252627282930313233343536373839404142434445464748495051525354555657585960616263646566676869707172737475767778798081828384858687888990919293949596979899100101102103104105106107108109110111112113114115116117118119120121122123124125126127128129130131132133134135136137138139140141142143144145146147148149150151152153154155156157158159160161162163164165166167168169170171172173174175
MetaTrader市场提供了一个方便,安全的购买MetaTrader平台应用程序的场所。直接从您的程序端免费下载EA交易和指标的试用版在测试策略中进行测试。
在不同模式下测试应用程序来监视性能和为您想要使用MQL5.community支付系统的产品进行付款。
