 MetaTrader 5
 专家
 指标
 程序库
 实用工具
 窗口小部件
 规则
适用于MetaTrader 4的新技术指标 - 144
 下面列出的技术指标信号对MetaTrader 4平台的开仓交易和平仓交易起着至关重要的作用。
指标的本质就是一种交易品种的数学转换,旨在预测价格变化。
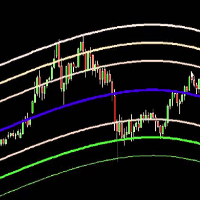
The Belkhayate center of gravity indicator is best used to confirm major turning points, and distinguish price extremes. Generally if price reaches the upper or lower levels one should expect a turn around coming soon, or at least a pull back towards the centre line if there is a strong trend. The upper and lower levels are red and green lines.
Our indicator use the same parameters as the well known trader M.Mostafa Belkhayate the inventor of the indicator, allow the use of buffers for your EA a

This indicator Master XR indicator.Indicator displays trend movement. Indicator calculates automatically line. Features
FiltPer - displays indicator period. deviation - displays indicator deviation. deviation2 - displays indicator deviation. How to understand the status: If (Timeframe M1-H1) FiltPer = 100; If ( Timeframe H4-MN) FiltPer = 5-20; ////////////////////////////////////////////////////////////////////////////////////////////////////////////////////////////////////////////////////// //

This indicator Super MA Pluss indicator.Indicator displays trend movement. Indicator calculates automatically line. Features
FiltPer - displays indicator period. How to understand the status: If the arrow is green, trend is up. If the arrow is red, trend is down. /////////////////////////////////////////////////////////////////////////////////////////////////////////////////////////////////////////////////// ///////////////////////////////////////////////////////////////////////////////////////

Индикатор внутри коробки считает количество баров и высоти коробки. фильтрация коробки происходит с помощью пробоя в пунктах или в процентах. Входные парамеиры Минмальное количество баров в нутри коробки Максимальное высота коробки Варянт величины (фылтрация коробки) величина в пунктах после пробоя коробки величина в % после пробоя коробки Максимальное количество стрелок, сигналы на покупку или на продажу.

Ultra Advanced Zig Zag 是一款适用于 MetaTrader 4 的 Zig Zag(之字形)指标。Zig Zag 工具连接波段高点和波段低点,使市场的主要波浪更容易辨认。它直接显示在 MetaTrader 4 的图表上,供交易者作为分析时的辅助参考。 主要特点
- 突出显示市场的主要波段
- 有助于研究市场结构,例如更高的高点和更低的低点
- 有助于为斐波那契和图表形态分析做准备
- 易于使用,加载到图表后即可直接查看其显示的内容
- 提供演示版,您可以在购买之前先行测试,了解它在自己图表上的显示方式 推荐设置
建议在以下时间周期上使用:M30, H1, H4, D1
建议搭配使用的货币对:EUR/USD, USD/JPY, GBP/USD, USD/CHF, USD/CAD, AUD/USD, EUR/JPY 使用方法
利用波段来研究市场结构,并结合您自己的分析和风险管理。该指标只是图表上的辅助工具,并不能取代您自己的判断。 交易涉及风险。过往业绩并不保证未来的结果。
欢迎您在评论区留言,提出问题和建议。

Ultra Advanced MA Pro 是一款适用于 MetaTrader 4 的移动平均线指标。它面向使用移动平均线研究趋势方向和强度的交易者。它直接显示在 MetaTrader 4 的图表上,供交易者作为分析时的辅助参考。 主要特点
- 基于移动平均线的趋势分析
- 有助于识别主导方向
- 可用作动态支撑和阻力参考
- 易于使用,加载到图表后即可直接查看其显示的内容
- 提供演示版,您可以在购买之前先行测试,了解它在自己图表上的显示方式 推荐设置
建议在以下时间周期上使用:M30, H1, H4, D1
建议搭配使用的货币对:EUR/USD, USD/JPY, GBP/USD, USD/CHF, USD/CAD, AUD/USD, EUR/JPY 使用方法
将移动平均线作为您自己交易形态的趋势过滤器,并配合您自己的分析和风险管理。该指标只是图表上的辅助工具,并不能取代您自己的判断。 交易涉及风险。过往业绩并不保证未来的结果。
欢迎您在评论区留言,提出问题和建议。

Ultra Advanced Points Line 是一款适用于 MetaTrader 4 的技术指标,帮助交易者解读趋势和动量。它是跟踪市场当前阶段的视觉辅助工具。它直接显示在 MetaTrader 4 的图表上,供交易者作为分析时的辅助参考。 主要特点
- 跟踪市场阶段的视觉辅助工具
- 可与支撑、阻力和价格行为相结合
- 适合 M30 至 D1 的时间周期
- 易于使用,加载到图表后即可直接查看其显示的内容
- 提供演示版,您可以在购买之前先行测试,了解它在自己图表上的显示方式 推荐设置
建议在以下时间周期上使用:M30, H1, H4, D1
建议搭配使用的货币对:EUR/USD, USD/JPY, GBP/USD, USD/CHF, USD/CAD, AUD/USD, EUR/JPY 使用方法
将其作为观察当前市场阶段的额外视角,并仅依据您自己的分析和风险管理做出决策。该指标只是图表上的辅助工具,并不能取代您自己的判断。 交易涉及风险。过往业绩并不保证未来的结果。
欢迎您在评论区留言,提出问题和建议。

Ultra Advanced Alfa MA 是一款适用于 MetaTrader 4 的移动平均线指标。移动平均线可以平滑价格波动,帮助交易者看清市场的潜在方向。它直接显示在 MetaTrader 4 的图表上,供交易者作为分析时的辅助参考。 主要特点
- 以移动平均线的方式解读趋势
- 可作为图表上的动态参考区域
- 可用作其他信号的过滤器
- 易于使用,加载到图表后即可直接查看其显示的内容
- 提供演示版,您可以在购买之前先行测试,了解它在自己图表上的显示方式 推荐设置
建议在以下时间周期上使用:M30, H1, H4, D1
建议搭配使用的货币对:EUR/USD, USD/JPY, GBP/USD, USD/CHF, USD/CAD, AUD/USD, EUR/JPY 使用方法
使用该均线解读趋势或过滤其他交易形态,并配合您自己的分析和风险管理。该指标只是图表上的辅助工具,并不能取代您自己的判断。 交易涉及风险。过往业绩并不保证未来的结果。
欢迎您在评论区留言,提出问题和建议。

Ultra Advanced R1S1 Pivot 是一款适用于 MetaTrader 4 的枢轴点指标,专注于第一阻力位(R1)和第一支撑位(S1)。它为交易者提供一组简洁的当日参考价格。它直接显示在 MetaTrader 4 的图表上,供交易者作为分析时的辅助参考。 主要特点
- 专注于 R1 和 S1 枢轴位
- 简洁显示最近的枢轴参考位
- 有助于规划需要关注价格反应的位置
- 易于使用,加载到图表后即可直接查看其显示的内容
- 提供演示版,您可以在购买之前先行测试,了解它在自己图表上的显示方式 推荐设置
建议在以下时间周期上使用:M30, H1, H4, D1
建议搭配使用的货币对:EUR/USD, USD/JPY, GBP/USD, USD/CHF, USD/CAD, AUD/USD, EUR/JPY 使用方法
观察价格在 R1 和 S1 附近的反应,并根据您自己的方法和风险管理来规划止损和目标位。该指标只是图表上的辅助工具,并不能取代您自己的判断。 交易涉及风险。过往业绩并不保证未来的结果。
欢迎您在评论区留言,提出问题和建议。

Ultra Advanced Double MA 是一款适用于 MetaTrader 4 的移动平均线指标,使用两条移动平均线。比较两条均线是研究趋势方向和节奏的常用方法。它直接显示在 MetaTrader 4 的图表上,供交易者作为分析时的辅助参考。 主要特点
- 围绕两条移动平均线构建
- 有助于比较短期和较长期的方向
- 适用于 M30 至 D1 的趋势分析
- 易于使用,加载到图表后即可直接查看其显示的内容
- 提供演示版,您可以在购买之前先行测试,了解它在自己图表上的显示方式 推荐设置
建议在以下时间周期上使用:M30, H1, H4, D1
建议搭配使用的货币对:EUR/USD, USD/JPY, GBP/USD, USD/CHF, USD/CAD, AUD/USD, EUR/JPY 使用方法
通过比较两条均线来解读趋势,并通过您自己的分析和风险管理来确认任何决定。该指标只是图表上的辅助工具,并不能取代您自己的判断。 交易涉及风险。过往业绩并不保证未来的结果。
欢迎您在评论区留言,提出问题和建议。

Ultra Advanced MACD Pro 是一款适用于 MetaTrader 4 的基于 MACD 的指标。MACD 系列指标通过价格的两条移动平均线之间的关系来研究动量。它直接显示在 MetaTrader 4 的图表上,供交易者作为分析时的辅助参考。 主要特点
- 基于移动平均线趋同背离(MACD)的概念
- 帮助交易者跟踪动量的变化
- 可与趋势和价格行为分析相结合
- 易于使用,加载到图表后即可直接查看其显示的内容
- 提供演示版,您可以在购买之前先行测试,了解它在自己图表上的显示方式 推荐设置
建议在以下时间周期上使用:M30, H1, H4, D1
建议搭配使用的货币对:EUR/USD, USD/JPY, GBP/USD, USD/CHF, USD/CAD, AUD/USD, EUR/JPY 使用方法
将 MACD 读数作为您动量分析的参考之一,并配合您自己的规则和风险管理。该指标只是图表上的辅助工具,并不能取代您自己的判断。 交易涉及风险。过往业绩并不保证未来的结果。
欢迎您在评论区留言,提出问题和建议。

Ultra Advanced Money Line 是一款适用于 MetaTrader 4 的技术指标,在价格图表下方的独立窗口中显示震荡指标式的线条。它帮助交易者解读价格走势,而无需在主图表上添加对象。它直接显示在 MetaTrader 4 的图表上,供交易者作为分析时的辅助参考。 主要特点
- 在独立窗口中显示震荡指标式线条
- 保持主价格图表整洁
- 可与其他工具在同一图表上配合使用
- 易于使用,加载到图表后即可直接查看其显示的内容
- 提供演示版,您可以在购买之前先行测试,了解它在自己图表上的显示方式 推荐设置
建议在以下时间周期上使用:M30, H1, H4, D1
建议搭配使用的货币对:EUR/USD, USD/JPY, GBP/USD, USD/CHF, USD/CAD, AUD/USD, EUR/JPY 使用方法
将该线条作为观察市场行为的补充视角,并结合您自己的分析和风险管理。该指标只是图表上的辅助工具,并不能取代您自己的判断。 交易涉及风险。过往业绩并不保证未来的结果。
欢迎您在评论区留言,提出问题和建议。

Ultra Advanced AutoChannel 是一款适用于 MetaTrader 4 的通道指标。顾名思义,它用于自动显示价格通道,使交易者无需手动绘制即可研究市场的波动区间和方向。它直接显示在 MetaTrader 4 的图表上,供交易者作为分析时的辅助参考。 主要特点
- 自动通道分析
- 有助于直观了解价格运行的区间
- 无需手动绘制
- 易于使用,加载到图表后即可直接查看其显示的内容
- 提供演示版,您可以在购买之前先行测试,了解它在自己图表上的显示方式 推荐设置
建议在以下时间周期上使用:M30, H1, H4, D1
建议搭配使用的货币对:EUR/USD, USD/JPY, GBP/USD, USD/CHF, USD/CAD, AUD/USD, EUR/JPY 使用方法
将通道作为方向和区间的直观参考,并通过您自己的分析和风险管理来确认任何想法。该指标只是图表上的辅助工具,并不能取代您自己的判断。 交易涉及风险。过往业绩并不保证未来的结果。
欢迎您在评论区留言,提出问题和建议。

Ultra Advanced All Pivot 是一款适用于 MetaTrader 4 的枢轴点指标。枢轴位标示出市场可能暂停、反转或突破的参考价格,这款工具将它们显示在图表上。它直接显示在 MetaTrader 4 的图表上,供交易者作为分析时的辅助参考。 主要特点
- 基于枢轴点的支撑和阻力参考位
- 有助于规划需要关注价格反应的位置
- 适用于 M30 至日线图
- 易于使用,加载到图表后即可直接查看其显示的内容
- 提供演示版,您可以在购买之前先行测试,了解它在自己图表上的显示方式 推荐设置
建议在以下时间周期上使用:M30, H1, H4, D1
建议搭配使用的货币对:EUR/USD, USD/JPY, GBP/USD, USD/CHF, USD/CAD, AUD/USD, EUR/JPY 使用方法
观察价格在枢轴位附近的表现,并根据您自己的方法和风险管理来设置止损和目标位。该指标只是图表上的辅助工具,并不能取代您自己的判断。 交易涉及风险。过往业绩并不保证未来的结果。
欢迎您在评论区留言,提出问题和建议。
军事狗s-军队将帮助您确定印第安处理的入口点。 他为所有的罪犯工作 您可以通过双击策略从设置中打开ADR级别。 如果您关闭ADR功能,它会发现更多的交易。
特别是,除了你自己的策略,它可以让你通过一个更好的质量过滤器处理输入。
你想ADR水平平均一定的每日成交量和信号的交易,当点的数量接近这些水平? 我们将其设置为50点,在一般设置中,我们关闭了ADR控制。 若要打开,您需要将策略1ADR控制设置设置为true。 实验的指标,以找到合适的设置为您服务。
指数paritates和它看起来在所有时期不同的尝试。 这样的折扣的帮助将有一个互补的效果,为你赢得。 ...............................
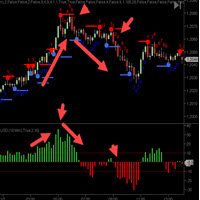
CycleTraderPro关闭强度值指示器测量从新柱的OPEN到该柱的CLOSE的距离。 输入 - 长度= 10默认值 我们将这些值一起添加回长度设置。 如果第一个柱子加上10个刻度,然后下一个柱子是负7个刻度,那么这将记录+3 交易收盘价有两种方式: 1.向低点和低点交易,反之亦然买入,高点和低点。 2.当指标在颜色方向上穿过中间零点时进行交易。红色=卖出/绿色=买入。 Close Strength还将显示一个直方图,以查看过去的动作,以了解市场在停止或撤消之前可以达到多远。 ------------------ The CycleTraderPro Close Strength Value Indicator measures the distance from the OPEN of a new bar to the CLOSE of that bar. Input - length = 10 default We add these values together going back the the length setting. If the 1st bar was pl
FREE
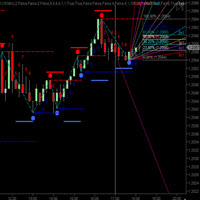
CycleTraderPro CycleWave 指标是1中的9个指标。 它使用CycleTraderPro指标和模式实时识别周期和更多。 CycleWave的9个部分: 绘制循环带并在每个成功循环高或低后实时确认循环高/低。 使用前一个条形的修改%范围绘制每个条形图上方和下方的循环波形价格。 在每个周期后自动绘制Fibonacci Retracement,从周期的低点和高点开始。 自动绘制每个循环的江恩风扇低和高。 每个周期低和高后自动绘制趋势线。 在循环计数方向上使用前一个X条范围的范围自动绘制价格目标窗口。 自动绘制每个周期低和高的突破线。 自动绘制速度线从前一个价格的确切角度移出到未来,以显示价格和时间在一起的位置。 自动绘制拥堵箱,以显示价格可能上涨或下跌的位置。 由于我们如何使用数学和模式,CycleWave可以对许多其他常见指标进行任何自动计算。节省大量时间尝试自己绘制这些值。我们相信4至9巴的循环次数。随着市场的变化,这些值将自动显示在您的图表上。 输入: 1 - Cycles - 设置高峰和低音循
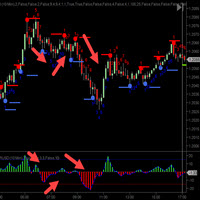
CycleTraderPro Tick Momentum 测量市场在连续收盘方向上移动的价格。 当市场收盘高于其结束时,它将开始计算它移动了多少滴答。 如果下一个柱位于移动中并以相同方向关闭,则Tick Momentum将继续计数,直到市场收盘低于开盘价。然后它将开始向这个方向倒数。 你可以看到这些移动的趋势,零点为正或负。 我们将每个条形图显示为红色,显示为向下,蓝色为蓝色。 然后,我们绘制一条纯白线,表示每次移动的刻度总数。 输入: 1 - 打开或关闭移动平均线 2 - 移动平均线的长度默认为10 当市场处于极端状态时,您可以考虑获利或进入头寸。你会发现市场通常是x刻度和反转 移动平均线是另一条绘制线,平滑了刻度范围。 尝试一个演示,看看它是如何工作的。
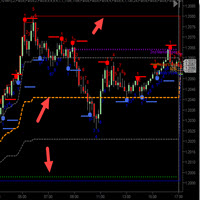
CycleTraderPro Open / High / Low / Medium OHL 获取当天的低点和高点,并绘制这些值: 1.一天中的高点(红线) 2.一天的低点(蓝线) 3.低25%(灰线) 4.范围的50%(橙线) 5.低75%(灰线) 我们期待远高于50%的范围并且短于下方 随着市场的变化,您可以轻松地看到这些水平。如果市场创出一个新的低点或高点,所有价值将随市场日自动移动。 您可以在输入中调整这些级别以适合您的交易方式。 我们发现市场将会在这些水平附近移动,为您提供进入或退出市场的价格水平。 OHL中等水平将自动调整。将此指标与其他指标结合使用时,可以更轻松地查看 价格点,否则很难看到。 随意获取演示并尝试使用OHL Medium指标进行交易。
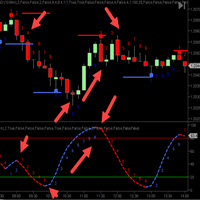
CycleTraderPro电力游戏指标(PPI ) - 是我们最喜欢的指标之一。我们采用所有CT指标并将它们合并为一个指标。 整个指标选择带有开/关功能,这意味着您可以选择自己的指标组合,只绘制这种组合。 我们选择平均混合物。选择5个指标时,PPI会将混合值除以5。 然后,我们绘制每个移动方向的循环计数,以帮助您进入和退出计划的时间。 红色下降,蓝色上升。 它最适合观察趋势和趋势逆转。 输入: 1.首先选择是开启或关闭所有CT指示器 2.显示箭头 - 指示器转动的图表上显示的箭头 - 开/关 3.偏移 - 这告诉图表底池有多远可以绘制转弯箭头。 ----------------- The CycleTraderPro Power Play Indicator (PPI) - is one of our favorite indicators. We take all the CT Indicators and combine them into one indicator.
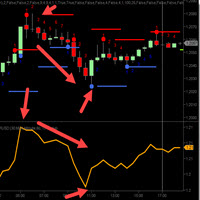
CycleTraderPro Orange Line - Bressert DDS - DoubleStoch - 我的父亲,Walter Bressert 使这些DDS成名多年。 他们使用来自随机的代码,然后再使用1行将它们再次平滑。 根据指标的长度,更长的趋势和更短的市场规模,橙色线是100长度。 交易橙线有两种方式: 1.在同一方向上交易高于和低于50的水平。以上是买入,下面是卖出持有。 2.交叉进行交易。等待它先降到20以下,然后再回到2o以上买入。或者,80以上,然后回到80线以下卖出。 我们建议您按照这些说明使用其他指标并使用停止点。 试用一个演示,看看它是如何为你工作的。 输入: 1.默认情况下,长度设置为100 2.默认情况下,长度设置为100

Keltner MTF (Not repaint!!!) is a channel indicator that can display price channels from different timeframes on a single chart of quotes. For example, on the H1 chart, you can see at the same time the Keltner price channel from the M15 and H4 timeframe. This tactic makes it possible to more clearly understand the tendency of price movements, to determine trading goals and points for making deals. How the Keltner MTF Indicator Works The Keltner MTF indicator can be used both - for trading in
The elite (V3) multi-indicator suite from JoaquinTrading specifically geared towards Forex & binary options, including regulated exchanges such Nadex, Cantor Exchange, and other binary option brokers.
The Probability Tool Suite Elite will provide the given win/loss outcome probabilities of up to 10 strike levels, a specific expiration duration, based on a combination of up to 16 indicators, rules, or conditions and derivative behavior (i.e. expiry, touch, touch & retrace). Using this indicato

The principle of the indicator. The StatChannel ( SC ) indicator is a development of the Bollinger Bands indicator ( ВВ ). BB is a moving average, on both sides of which two lines are drawn, separated from it by standard deviations std multiplied by the corresponding coefficient. At the same time, a moving average with an averaging period (2n + 1) bars is always obtained lagging behind n bars. Sliding std is also lagging behind on n bars, also calculated by (2n + 1) points. Such
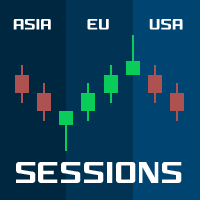
Sessions PRO is a perfect tool which divide your chart screen by 3 main market sessions: 1> asian 2> european (with division for Frankfurt and London start) 3> american
Sessions PRO is perfect especially for trading indices, where main pivot points often occurs along with new market center enters the market. With Sessions PRO you see what events happened at their exact corresponding time - European and American moves and pivot points are much more important than asian. Stop analyzing your chart

FZR indicator determines fractal zigzag reversal pattern of all the time frames of the chosen symbol and shows the information in the Info label. Indicator draws the detected pattern in the chosen time frame and also you can select in the menu to draw the trend line according to FZR peaks. What it is FZR? See the first picture in the screenshots. As you can see for every peak of FZR the AO indicator must cross zero line. FZR indicator determines the trend direction.
How to use FZR for trading?
FREE

This indicator is based on the previous option ( https://www.mql5.com/ru/market/product/37376 ) and includes all completions at the time of creation. Availability of additional data allows to understand more deeply the principle of work as this indicator and original. Points on extrema of bars show history of a portrayal of extrema as before. Levels of a reverse show as far as the price for formation of a new shoulder has to deviate. The Price noise parameter has a special impact (the name "devi

The indicator is made on the basis of the algorithm put in the ZigZag History indicator ( https://www.mql5.com/ru/market/product/37376/ ).
In the real option there are no additional buffers and an opportunity to trace work history.
It causes the minimum involvement of random access memory, however productivity practically does not improve. Attention! The Price noise parameter - has significant effect on formation of extrema. Parameters: Depth - is depth of search of a local extremum in bars;

This indicator alerts you when/before new 1 or 5 minute bar candle formed. In other words,this indicator alerts you every 1/5 minutes. This indicator is especially useful for traders who trade when new bars formed.
*This indicator don't work propery in strategy tester.Use this in live trading to check functionality.
There is more powerful Pro version .In Pro version,you can choose more timeframe and so on.
Input Parameters Alert_Or_Sound =Sound ----- Choose alert or sound or both to notify y
FREE

This indicator alerts you when/before new candle bar formed. In other words,this indicator alerts you every 1/5/30/60/240 minutes.
This indicator is especially useful for traders who trade when new bars formed.
*This indicator don't work propery in strategy tester.Use Free Version to check functionality in live trading.
Input Parameters Alert_Or_Sound =Sound ----- Choose alert or sound or both to notify you when new bar is coming.
Enable_1mBarAlert ----- Enable alert for 1 min bar
diff_1m --

Platinum FX индикатор для скальпинга. идеально подходит для торговли бинарными опционами.
работает на всех валютных парах мультитаймфреймовый.
когда появляемся красная стрелка мы покупаем когда появляемся красная мы продаем.
он должен был достичь успеха в трейдинге. Полное отсутствие перерисовки. Точность сигнала. точность данного инструмента можете увидеть в тестере Всем удачных торгов By Lilyyy
***Specialized for scalping trading on any timeframe***
Scalping Train use smart algorithm detects the price circles with time . give strong signals at the right time as result of combine the price and time.
our team spent months to develop this indicator specially for Scalping..with high success rates about 89% win trades .
Advantages Easy, visual and effective Signals. Gives you the ability to filter and further improve your trading strategies. Never repaints, never backpaints, never recalc
The brand new trading indicator using the box breakout strategy is presented by KING.Ai. This indicator with four-mode alerts is developed by KING.Ai ONLY. It is probably impossible that you could find a box breakout indicator like this one. It is very difficult for you to trade with the box breakout strategy as there is limited time for traders to monitor every currency. However, the box breakout strategy is very profitable. It is because when the price breaks the box, the trend will go further

Ultra Advanced MA 是一款适用于 MetaTrader 4 的移动平均线指标。移动平均线可以平滑短期噪音,让市场的主要方向更加清晰。它直接显示在 MetaTrader 4 的图表上,供交易者作为分析时的辅助参考。 主要特点
- 基于移动平均线的趋势解读
- 平滑短期价格噪音
- 可用作其他信号的过滤器
- 推荐用于 H4 时间周期
- 提供演示版,您可以在购买之前先行测试,了解它在自己图表上的显示方式 推荐设置
建议在以下时间周期上使用:H4
建议搭配使用的货币对:EUR/USD, USD/JPY, GBP/USD, USD/CHF, USD/CAD, AUD/USD, EUR/JPY 使用方法
使用移动平均线解读主要趋势,并结合您自己的分析和风险管理。该指标只是图表上的辅助工具,并不能取代您自己的判断。 交易涉及风险。过往业绩并不保证未来的结果。
欢迎您在评论区留言,提出问题和建议。

Ultra Advanced Support and Resistance Ultra Pips 是一款适用于 MetaTrader 4 的支撑和阻力指标。支撑和阻力区域是市场曾经出现反应、并可能再次出现反应的价格。它直接显示在 MetaTrader 4 的图表上,供交易者作为分析时的辅助参考。 主要特点
- 支撑和阻力分析
- 有助于规划需要关注价格反应的位置
- 有助于按照您自己的方法设置止损和目标位
- 重点关注 H1 和 H4 时间周期
- 提供演示版,您可以在购买之前先行测试,了解它在自己图表上的显示方式 推荐设置
建议在以下时间周期上使用:H1, H4
建议搭配使用的货币对:EUR/USD, USD/JPY, GBP/USD, USD/CHF, USD/CAD, AUD/USD, EUR/JPY 使用方法
将支撑和阻力区域作为参考,并依据您自己的分析和风险管理做出每一项决策。该指标只是图表上的辅助工具,并不能取代您自己的判断。 交易涉及风险。过往业绩并不保证未来的结果。
欢迎您在评论区留言,提出问题和建议。

Ultra Advanced EMA MA 是一款适用于 MetaTrader 4 的指数移动平均线(EMA)指标。指数平均线对近期价格赋予更大权重,因此比简单平均线更紧密地跟随新的走势。它直接显示在 MetaTrader 4 的图表上,供交易者作为分析时的辅助参考。 主要特点
- 基于指数移动平均线
- 对近期价格赋予更大权重
- 可用作动态支撑和阻力参考
- 易于使用,加载到图表后即可直接查看其显示的内容
- 提供演示版,您可以在购买之前先行测试,了解它在自己图表上的显示方式 推荐设置
建议在以下时间周期上使用:H1, H4, D1
建议搭配使用的货币对:EUR/USD, USD/JPY, GBP/USD, USD/CHF, USD/CAD, AUD/USD, EUR/JPY 使用方法
使用 EMA 解读当前方向或过滤其他交易形态,并配合您自己的分析和风险管理。该指标只是图表上的辅助工具,并不能取代您自己的判断。 交易涉及风险。过往业绩并不保证未来的结果。
欢迎您在评论区留言,提出问题和建议。

Ultra Advanced FiboChannel 是一款适用于 MetaTrader 4 的斐波那契通道指标,可自动在图表上绘制斐波那契水平。它将斐波那契分析与市场的通道视图相结合。它直接显示在 MetaTrader 4 的图表上,供交易者作为分析时的辅助参考。 主要特点
- 自动绘制斐波那契水平
- 基于通道的价格视图
- 推荐用于 H1、H4 和 D1
- 易于使用,加载到图表后即可直接查看其显示的内容
- 提供演示版,您可以在购买之前先行测试,了解它在自己图表上的显示方式 推荐设置
建议在以下时间周期上使用:H1, H4, D1
建议搭配使用的货币对:EUR/USD, USD/JPY, GBP/USD, USD/CHF, USD/CAD, AUD/USD, EUR/JPY 使用方法
将这些水平作为走势内部的参考区域,并配合您自己的分析和风险管理。该指标只是图表上的辅助工具,并不能取代您自己的判断。 交易涉及风险。过往业绩并不保证未来的结果。
欢迎您在评论区留言,提出问题和建议。

Ultra Advanced Fibonacci 是一款适用于 MetaTrader 4 的斐波那契指标,可自动在图表上绘制斐波那契水平。它节省了手动放置该工具的时间。它直接显示在 MetaTrader 4 的图表上,供交易者作为分析时的辅助参考。 主要特点
- 自动绘制斐波那契水平
- 无需手动绘制
- 有助于定位可能的回撤区域
- 重点关注 M30 和 H1 时间周期
- 提供演示版,您可以在购买之前先行测试,了解它在自己图表上的显示方式 推荐设置
建议在以下时间周期上使用:M30, H1
建议搭配使用的货币对:EUR/USD, USD/JPY, GBP/USD, USD/CHF, USD/CAD, AUD/USD, EUR/JPY 使用方法
将斐波那契水平视为可能的反应区域加以观察,并通过您自己的分析和风险管理来确认任何想法。该指标只是图表上的辅助工具,并不能取代您自己的判断。 交易涉及风险。过往业绩并不保证未来的结果。
欢迎您在评论区留言,提出问题和建议。

Ultra Advanced Arrows 是一款适用于 MetaTrader 4 的箭头指标。据作者介绍,它适合用于剥头皮和波段交易分析。它直接显示在 MetaTrader 4 的图表上,供交易者作为分析时的辅助参考。 主要特点
- 以图表上的箭头显示读数
- 适合剥头皮和波段交易分析
- 适用于 M30 至 D1
- 易于使用,加载到图表后即可直接查看其显示的内容
- 提供演示版,您可以在购买之前先行测试,了解它在自己图表上的显示方式 推荐设置
建议在以下时间周期上使用:M30, H1, H4, D1
建议搭配使用的货币对:EUR/USD, USD/JPY, GBP/USD, USD/CHF, USD/CAD, AUD/USD, EUR/JPY 使用方法
将每个箭头视为提示您查看图表的信号,而不是指令,并通过您自己的分析和风险管理加以确认。该指标只是图表上的辅助工具,并不能取代您自己的判断。 交易涉及风险。过往业绩并不保证未来的结果。
欢迎您在评论区留言,提出问题和建议。

Ultra Advanced RSI 是一款适用于 MetaTrader 4 的基于 RSI 的指标。它显示最近两个峰值之间的背离或趋同,帮助交易者将动量与价格进行比较。它直接显示在 MetaTrader 4 的图表上,供交易者作为分析时的辅助参考。 主要特点
- 基于相对强弱指数(RSI)
- 显示最近两个峰值之间的背离或趋同
- 有助于将动量与最新的价格走势进行比较
- 易于使用,加载到图表后即可直接查看其显示的内容
- 提供演示版,您可以在购买之前先行测试,了解它在自己图表上的显示方式 推荐设置
建议在以下时间周期上使用:M30, H1, H4, D1
建议搭配使用的货币对:EUR/USD, USD/JPY, GBP/USD, USD/CHF, USD/CAD, AUD/USD, EUR/JPY 使用方法
将背离和趋同作为您自己动量分析的一部分,并依据您自己的风险管理做出决策。该指标只是图表上的辅助工具,并不能取代您自己的判断。 交易涉及风险。过往业绩并不保证未来的结果。
欢迎您在评论区留言,提出问题和建议。

Ultra Advanced Predictor 是一款适用于 MetaTrader 4 的技术指标,帮助交易者解读趋势和动量。它可以加载到任意图表时间周期。它并不预测未来,而是用于研究价格行为的工具。它直接显示在 MetaTrader 4 的图表上,供交易者作为分析时的辅助参考。 主要特点
- 可加载到任意图表时间周期
- 推荐用于 H1、H4 和 D1
- 有助于研究近期价格行为
- 易于使用,加载到图表后即可直接查看其显示的内容
- 提供演示版,您可以在购买之前先行测试,了解它在自己图表上的显示方式 推荐设置
建议在以下时间周期上使用:H1, H4, D1
建议搭配使用的货币对:EUR/USD, USD/JPY, GBP/USD, USD/CHF, USD/CAD, AUD/USD, EUR/JPY 使用方法
市场可能朝任何方向运行,因此请仅将该指标作为您自己分析和风险管理的参考之一。该指标只是图表上的辅助工具,并不能取代您自己的判断。 交易涉及风险。过往业绩并不保证未来的结果。
欢迎您在评论区留言,提出问题和建议。

Ultra Advanced Stochastic 是一款适用于 MetaTrader 4 的基于随机指标的指标。据作者介绍,它能识别连续的看涨和看跌K线,帮助交易者发现一段走势已持续了数根K线。它直接显示在 MetaTrader 4 的图表上,供交易者作为分析时的辅助参考。 主要特点
- 基于随机指标的分析
- 识别连续的看涨和看跌K线
- 重点关注 H4 和 D1 时间周期
- 易于使用,加载到图表后即可直接查看其显示的内容
- 提供演示版,您可以在购买之前先行测试,了解它在自己图表上的显示方式 推荐设置
建议在以下时间周期上使用:H4, D1
建议搭配使用的货币对:EUR/USD, USD/JPY, GBP/USD, USD/CHF, USD/CAD, AUD/USD, EUR/JPY 使用方法
将读数和K线序列作为您自己分析的一部分,并依据您自己的风险管理做出决策。该指标只是图表上的辅助工具,并不能取代您自己的判断。 交易涉及风险。过往业绩并不保证未来的结果。
欢迎您在评论区留言,提出问题和建议。

Ultra Advanced MACD 是一款适用于 MetaTrader 4 的 MACD 指标。它通过将价格的两条移动平均线相减计算得出,这是衡量动量的经典方法。它直接显示在 MetaTrader 4 的图表上,供交易者作为分析时的辅助参考。 主要特点
- 基于价格两条移动平均线的经典 MACD 计算
- 有助于跟踪动量变化
- 适用于 H1、H4 和 D1
- 易于使用,加载到图表后即可直接查看其显示的内容
- 提供演示版,您可以在购买之前先行测试,了解它在自己图表上的显示方式 推荐设置
建议在以下时间周期上使用:H1, H4, D1
建议搭配使用的货币对:EUR/USD, USD/JPY, GBP/USD, USD/CHF, USD/CAD, AUD/USD, EUR/JPY 使用方法
将 MACD 读数作为您自己动量分析的参考之一,并依据您自己的风险管理做出决策。该指标只是图表上的辅助工具,并不能取代您自己的判断。 交易涉及风险。过往业绩并不保证未来的结果。
欢迎您在评论区留言,提出问题和建议。

Ultra Advanced Precision Trend 是一款适用于 MetaTrader 4 的趋势指标,根据当前趋势状态为K线着色。趋势可以直接在价格图表上读取。它直接显示在 MetaTrader 4 的图表上,供交易者作为分析时的辅助参考。 主要特点
- 根据当前趋势状态为K线着色
- 无需额外窗口即可解读趋势
- 使趋势状态的变化易于察觉
- 易于使用,加载到图表后即可直接查看其显示的内容
- 提供演示版,您可以在购买之前先行测试,了解它在自己图表上的显示方式 推荐设置
建议在以下时间周期上使用:H1, H4, D1
建议搭配使用的货币对:EUR/USD, USD/JPY, GBP/USD, USD/CHF, USD/CAD, AUD/USD, EUR/JPY 使用方法
利用K线颜色了解当前的趋势状态,并配合您自己的分析和风险管理。该指标只是图表上的辅助工具,并不能取代您自己的判断。 交易涉及风险。过往业绩并不保证未来的结果。
欢迎您在评论区留言,提出问题和建议。

Ultra Advanced Detrend 是一款适用于 MetaTrader 4 的去趋势指标。去趋势会从价格中剔除主要趋势,使较短的周期和波动更容易研究。它直接显示在 MetaTrader 4 的图表上,供交易者作为分析时的辅助参考。 主要特点
- 价格的去趋势视图
- 有助于研究较短的市场周期
- 可针对不同货币对和时间周期进行调整
- 易于使用,加载到图表后即可直接查看其显示的内容
- 提供演示版,您可以在购买之前先行测试,了解它在自己图表上的显示方式 推荐设置
建议在以下时间周期上使用:H1, H4, D1
建议搭配使用的货币对:EUR/USD, USD/JPY, GBP/USD, USD/CHF, USD/CAD, AUD/USD, EUR/JPY 使用方法
使用去趋势视图观察价格相对于其近期表现何时出现过度延伸,并结合您自己的分析和风险管理。该指标只是图表上的辅助工具,并不能取代您自己的判断。 交易涉及风险。过往业绩并不保证未来的结果。
欢迎您在评论区留言,提出问题和建议。

Ultra Advanced Scalper 是一款适用于 MetaTrader 4 的技术指标,用于短线分析。据作者介绍,它适合在较低时间周期上进行剥头皮交易。它直接显示在 MetaTrader 4 的图表上,供交易者作为分析时的辅助参考。 主要特点
- 专为短线和剥头皮分析而设计
- 适用于 M15 至 H4
- 易于使用,加载到图表后即可直接查看其显示的内容
- 可与更高时间周期的趋势过滤器结合使用
- 提供演示版,您可以在购买之前先行测试,了解它在自己图表上的显示方式 推荐设置
建议在以下时间周期上使用:M15, M30, H1, H4
建议搭配使用的货币对:EUR/USD, USD/JPY, GBP/USD, USD/CHF, USD/CAD, AUD/USD, EUR/JPY 使用方法
在采取行动之前检查市场状况和点差,先在模拟账户上测试,并始终运用您自己的风险管理。该指标只是图表上的辅助工具,并不能取代您自己的判断。 交易涉及风险。过往业绩并不保证未来的结果。
欢迎您在评论区留言,提出问题和建议。

Ultra Advanced MA SMA 是一款适用于 MetaTrader 4 的简单移动平均线(SMA)指标。简单移动平均线对其周期内的每根K线赋予相同权重,呈现平滑的趋势视图。它直接显示在 MetaTrader 4 的图表上,供交易者作为分析时的辅助参考。 主要特点
- 基于简单移动平均线
- 平滑呈现潜在趋势
- 可用作动态支撑和阻力参考
- 易于使用,加载到图表后即可直接查看其显示的内容
- 提供演示版,您可以在购买之前先行测试,了解它在自己图表上的显示方式 推荐设置
建议在以下时间周期上使用:M30, H1, H4
建议搭配使用的货币对:EUR/USD, USD/JPY, GBP/USD, USD/CHF, USD/CAD, AUD/USD, EUR/JPY 使用方法
使用 SMA 解读主要方向或过滤其他交易形态,并配合您自己的分析和风险管理。该指标只是图表上的辅助工具,并不能取代您自己的判断。 交易涉及风险。过往业绩并不保证未来的结果。
欢迎您在评论区留言,提出问题和建议。

Ultra Advanced MA Points 是一款适用于 MetaTrader 4 的移动平均线指标,用于标记与移动平均线相关的点位。它帮助交易者跟踪价格在均线附近的表现。它直接显示在 MetaTrader 4 的图表上,供交易者作为分析时的辅助参考。 主要特点
- 基于移动平均线的分析
- 通过点位更容易看清价格与均线之间的关系
- 有助于回顾图表上的过往走势
- 易于使用,加载到图表后即可直接查看其显示的内容
- 提供演示版,您可以在购买之前先行测试,了解它在自己图表上的显示方式 推荐设置
建议在以下时间周期上使用:M30, H1, H4
建议搭配使用的货币对:EUR/USD, USD/JPY, GBP/USD, USD/CHF, USD/CAD, AUD/USD, EUR/JPY 使用方法
将这些点位作为您自己趋势和结构分析的参考之一,并运用您自己的风险管理。该指标只是图表上的辅助工具,并不能取代您自己的判断。 交易涉及风险。过往业绩并不保证未来的结果。
欢迎您在评论区留言,提出问题和建议。

Ultra Advanced AutoFibo 是一款适用于 MetaTrader 4 的自动斐波那契指标。顾名思义,它用于自动应用斐波那契分析,交易者无需手动绘制该工具。它直接显示在 MetaTrader 4 的图表上,供交易者作为分析时的辅助参考。 主要特点
- 自动斐波那契分析
- 节省手动绘制的时间
- 有助于定位可能的回撤区域
- 易于使用,加载到图表后即可直接查看其显示的内容
- 提供演示版,您可以在购买之前先行测试,了解它在自己图表上的显示方式 推荐设置
建议在以下时间周期上使用:M30, H1, H4
建议搭配使用的货币对:EUR/USD, USD/JPY, GBP/USD, USD/CHF, USD/CAD, AUD/USD, EUR/JPY 使用方法
观察价格在回撤期间于斐波那契区域附近的表现,并通过您自己的分析和风险管理来确认任何想法。该指标只是图表上的辅助工具,并不能取代您自己的判断。 交易涉及风险。过往业绩并不保证未来的结果。
欢迎您在评论区留言,提出问题和建议。

Ultra Advanced FibonacciPro 是一款适用于 MetaTrader 4 的斐波那契指标。斐波那契水平被广泛用于研究价格波段内的回撤和可能的反应区域。它直接显示在 MetaTrader 4 的图表上,供交易者作为分析时的辅助参考。 主要特点
- 基于斐波那契的价格波段分析
- 有助于定位可能的回撤区域
- 有助于规划止损和目标位的参考水平
- 易于使用,加载到图表后即可直接查看其显示的内容
- 提供演示版,您可以在购买之前先行测试,了解它在自己图表上的显示方式 推荐设置
建议在以下时间周期上使用:M30, H1, H4
建议搭配使用的货币对:EUR/USD, USD/JPY, GBP/USD, USD/CHF, USD/CAD, AUD/USD, EUR/JPY 使用方法
将斐波那契区域作为您自己分析的参考,并结合您自己的风险管理做出决策。该指标只是图表上的辅助工具,并不能取代您自己的判断。 交易涉及风险。过往业绩并不保证未来的结果。
欢迎您在评论区留言,提出问题和建议。

Ultra Advanced Force Meter 是一款适用于 MetaTrader 4 的技术指标,旨在帮助交易者衡量市场走势的强度。它为价格解读增加了力度的度量。它直接显示在 MetaTrader 4 的图表上,供交易者作为分析时的辅助参考。 主要特点
- 专注于价格走势的强度
- 有助于判断一段走势是否具有力度支撑
- 推荐用于四个主要货币对
- 易于使用,加载到图表后即可直接查看其显示的内容
- 提供演示版,您可以在购买之前先行测试,了解它在自己图表上的显示方式 推荐设置
建议在以下时间周期上使用:M30, H1, H4
建议搭配使用的货币对:EUR/USD, AUD/USD, NZD/USD, USD/JPY 使用方法
在采取行动之前,使用强度读数检验您自己的交易形态,并始终运用您自己的风险管理。该指标只是图表上的辅助工具,并不能取代您自己的判断。 交易涉及风险。过往业绩并不保证未来的结果。
欢迎您在评论区留言,提出问题和建议。
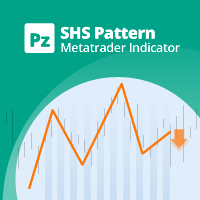
头肩形态是一种图表形式,类似于具有三个峰的基线,外部两个峰的高度接近,中间峰最高。它可以预测牛市到牛市的趋势反转,并且被认为是最可靠的趋势反转模式之一。它是几种顶部模式之一,以不同程度的准确性发出趋势即将结束的信号。 [ 安装指南 | 更新指南 | 故障排除 | 常见问题 | 所有产品 ] 清除交易信号 可自定义的颜色和尺寸 实施绩效统计 可定制的斐波那契回撤水平 显示适当的止损和获利水平
该指标可用于查找连续或反转形态 它是不可重涂和不可重涂的 它实现了电子邮件/声音/视觉警报
设置 将指标加载到任何图表时,将显示一组选项作为输入参数。如果您认为它们太多,请不要感到失望,因为参数被分组为不言自明的块。这就是每个参数块的作用。 幅度-幅度表示替代价格点之间的最小柱线量。要找到大图案,请增加幅度参数。要查找较小的模式,请减小幅度参数。您可以在图表中多次加载具有不同幅度的指标。
闵。回撤-形态中所需的最小斐波那契回撤。设置为零不对其进行评估。 最大。回撤-形态中可能的最大斐波那契回撤。设置为零不对其进行评估。 领口扁平率-此参数描述图案领口必须如何“平坦”。
最大历史柱线-指标在图
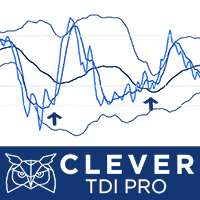
Description: The indicator shows the TDI indicator in a separate window, and with the RSI component, the indicator finds possible divergences with M or W patterns. KEY LINKS: How to Install - Frequent Questions - All Products Functions: Finds Market Makers patterns. Finds extremes or exhaustion into the market. Looks for a trend continuation. Content: TDI Indicator Divergence and M or W Signals Note 1: This indicator should only be considered as a part of any trading strategy. You shoul

ZhiBi Fast Scalp是很好的快速剥头皮指标系统,信号依据趋势加震荡,频繁给出Buy和Sell信号。适合所有市场品种和时间周期。 出现向上箭头即可下单Buy;出现向下箭头即可下单Sell; 参数设置说明: 【Signal_line_period】:小周期信号线的平均周期。 【Trend_line_period】:大周期趋势线的平均周期。 【Alert_No_Off】:弹窗消息的开或关;true=开、false=关; 【SendMail_No_Off】:电子邮件的开或关;true=开、false=关; 【SendNotification_No_Off】:消息推送到移动终端的开或关;true=开、false=关; 更多好用的指标网址: https://www.mql5.com/en/users/zhengqiuyang/seller
Revolution Martingale Pro
indicator for binary options!
at the time of opening and the appearance of the signal!
Blue diamond is shopping up.
A red diamond is an option down.
The indicator is already set to trade in binary options. ----------- protection is set against hitting on (steps - martingale knees) protection of several minuses under the row. ------------------------------------------- (Redrawing possible)

Alarm arrow indicator of increased sensitivity After closing the candle the arrows do not disappear Allows you to enter the transaction on time at the lowest price movements Can be used on any currency pairs, metals and cryptocurrency Suitable for working with binary options Distinctive features Does not redraw; Determines the price correction; Advanced settings for fine tuning; Works on all timeframes and on all symbols; Suitable for trading currencies, metals, options and cryptocurrency (Bitco

量子擺動 1.什麼是量子擺動? 該指標基於量子數學,以高概率和方向精度顯示未來價格水平。級別顯示為進行交易決策的區域;它們明確定義了具有最小和最大利潤的訂單的窄範圍。該指標顯示不同時期的未來交易區H1,H4,D,W。它還顯示量子振盪而不參考時間。適用於所有交易工具。外匯市場,股票市場,期貨市場和商品市場將改變為MT4交易平台上使用的所有工具。 2.量子擺動的優點和不同之處: 在線汽車打造優質交易平台。 交易決策區域的構建和顯示的準確性。 以未來時態展示貿易區,帶領您領先一步。 易於使用和應用。 聊天電報中頻道的在線支持 https://t.me/nest8 每日評論和直播YouTube頻道 https://www.youtube.com/watch?v=kzapOX0cGfc&feature=youtu.be 2.交易策略。 指標描述,交易策略,調整和交易計劃將在YouTube頻道上詳細顯示,並在聊天電報中進行討論。
FREE

Данный индикатор Форекс построен на теории оценки силы тренда и расчёта, когда нужно входить в рынок. Как только появляется сигнал захода в рынок над свечёй вырисовуется стрелка которая и показывает дальнейшее направление цены. . Это полноценный индикатор который поможет вам принимать решение о входе в рынок и о позиции которую необходимо занять при открытии ордера.
The original multi-indicator suite from JoaquinTrading specifically geared towards binary options, including regulated exchanges such Nadex, Cantor Exchange, and other binary option brokers.
The Probability Tool Suite Classic will provide the given win/loss outcome probabilities of up to 10 strike levels, a specific expiration duration, based on a particular indicator's parameters and derivative behavior (i.e. expiry, touch, touch & retrace). Using this indicator will give users an idea if a p
MACD Display 是一个跨周期MACD背离,金死叉监控指标。 指标优势:
1、背离点位可以在主图和指标附图上画出来,观察方便,可通过参数设置隐藏或显示。 2、背离入场点在附图中通过箭头提示,清楚明确。 3、跨周期监控,可以同时监控该品种6个周期框架的MACD背离及金死叉情况。 4、顶背离、底背离、金叉、死叉信号出来后可通过窗口报警提示,有效减少盯盘时间。 5、可隐藏MACD柱体,方便信号观察。 更多来自作者的EA和指标 https://www.mql5.com/zh/users/chenshaofei/seller 参数说明:
separator1 - 说明性参数,默认,不重要 FastMAPeriod - macd快线周期 SlowMAPeriod - macd慢线周期 SignalMAPeriod - macd信号周期 applied_price - macd应用价格 show_histogram - 是否显示macd柱体 separator2 - 说明性参数,默认,不重要 drawIndicatorTrendLines - 是否在指标附图上画背离线 drawPriceTr
Indicator for effective binary options trading.
Complete lack of redrawing The arrow indicates the direction of the next candle and the possible direction.
signal accuracy. Complete lack of redrawing. works great with support and resistance levels
it has an alert, it can be turned on or off in the settings
the accuracy of this tool is perfect
All successful trading.
Also see my other indicators
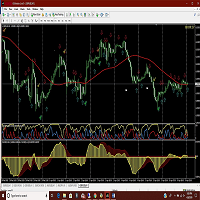
Amac indicator will give you alerts when the ADX crosses and also when the two MACD indicators cross. Helps in determining the trend direction, good for scalping against the main trend as well. Get mobile alerts and email in addition to the platform alerts. Arrows indicate MACD direction and Check marks show ADX turns. Works on all time frames but you can get more pips by using the 30 min and above. Be sure to view the photos!

This indicator guides you like a hunter. Tacheprofit and StopLoss levels. See the difference in the experiment. Works in all periods. Works at all rates. You can win with this system. The crossing of the mean and the re-test were done according to the rule. You can see the transactions by moving backwards on the strategy test screen. The whole system is automatically calculated.
multi-timeframe indicator. Ideal for both the Forex market and binary options. Good accuracy of this tool the indicator showed excellent results during testing. test it in a tester and make sure it is accurate.... complete lack of redrawing. You can choose absolutely any instrument. the indicator will provide many profitable and accurate signals. advantages of the indicator: advanced signals. high signal accuracy. frequency of occurrence of signals.

iVolX indicator horizontal volumes for all time periods
Main settings of the indicator: VolumeSource - select data for volumes (tick or real) PeriodMinutes - selection period for rendering of volumes PeriodsNumber - number of periods to show on the chart StartDate - the start date of the calculations ClusterPoints - cluster width Color - color MaxVolColor - maximum volume color ValueArea - the value of the zone of balance ValueAreaColor - color of the balance zone MaxVolFontSize - fon
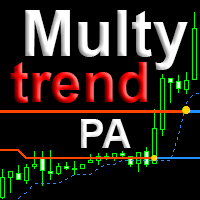
The indicator combines the principles of Price Action and a unique filtering algorithm with feedback for the three movings, this allows you to determine the pivot points and the current trend on any timeframe with a high probability. MultyTrend PA is an evolution of the Trend PA indicator and can be used on the principle of the three Elder screens, with everything you need is displayed on the same graph. Line 1 fast moving, Line 2 main moving, Line 3 - slow moving to determine the direct

indicator for binary options! open a deal only for 1 - candle The indicator is already set to trade in binary options. The indicator is ideal for trading on martingale since he very accurately combines what the next candle will be if you are trading in a martingale money management, this is the indicator that you were looking for; it is just created for you and your trading style p.s it is much better than relying on the color of the candle as some not very experienced traders do (therefore, the

Mr Pip Scalping Indicator
is a momentum indicator that measures the magnitude of recent price changes to evaluate overbought or oversold conditions in the price of a stock or other asset with few major tweaks. This is NOT RSI. Features V2: Added Supply/Demand Filter
You can select which zone to see on the chart ( Important Resistance/Support; Verified Resistance/Support; etc ). You get alerts when prices is entering on a specific supply/demand zone. How to use? When the signal comes, you will

Trend Lines Cross This indicator will alert you on any cross of a Trendline. You can draw up to two trend lines and form a channel, a pennant , a triangle or a simple trend and when the price crosses either trend line the indicator will provide you with alerts that you define plus an up or down arrow when the cross happened. How to: Draw the 1st trendline and name it tl1. Draw the 2nd trendline and name it tl2. Select which type of alerts you would like in the indicator properties and you a
FREE

Nygma Binary Options is a momentum indicator that measures the magnitude of recent price changes to evaluate overbought or oversold conditions in the price of a stock or other asset with few major tweaks. This is NOT RSI.
Features V3: Added Supply/Demand Filter: You must add your own S/R indicator .
You get alerts when prices is entering on a specific supply/demand zone. How to use the S/R Filter? Load the Nygma_Mod.ex4 into the chart, after that load your S/R indicator on the chart. In order
您知道为什么MetaTrader市场是出售交易策略和技术指标的最佳场所吗?不需要广告或软件保护,没有支付的麻烦。一切都在MetaTrader市场提供。
