适用于MetaTrader 4的新技术指标 - 54

"Trend Guide" is an indicator showing the trend direction based on a fast and slow moving average. Everything is simple and most importantly convenient.
Indicator Parameters :
"_fast_moving_average_period" - The period of the fast moving average;
"_ Slow_Moving_Average_Period" - The period of the slow moving average; ;
"_MA_SHIFT " - Moving average shift;
"_MA_METHOD " - Averaging method;
"_APPLIED_PRICE " - Type of price calculation;
"_line_wi
FREE

A forex pivot point strategy could very well be a trader’s best friend as far as identifying levels to develop a bias, place stops and identify potential profit targets for a trade. Pivot points have been a go-to for traders for decades. The basis of pivot points is such that price will often move relative to a previous limit, and unless an outside force causes the price to do so, price should stop near a prior extreme. Pivot point trading strategies vary which makes it a versatile tool for
FREE

Индикатор Форекс LTT Range System показывает на графике средние диапазоны движения рыночной цены за периоды M 15, H 1, H 4, D 1, W 1, MN 1. Верхняя и нижняя границы диапазонов рассчитываются от цены открытия бара. Пивот – середина между ценой открытия бара и границей диапазона: если рыночная цена находится выше цены открытия бара – метка пивота располагается между ценой открытия бара и верхней меткой диапазона, если рыночная цена находится ниже цены открытия бара – метка пивота располагается ме

Looking for strong trend entrance and exit points of trends? This incorporates volume into price calculations for a fast entry/exit, showing how supply and demand factors are influencing price, and giving you more insights than the average trader uses. The Volume Accumulation Trend indicator is a cumulative indicator that uses both volume and price to investigate whether an asset is growing or falling. It identifies differences between the price and the volume flow, which lets us kno
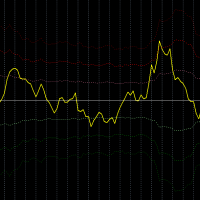
Description:
This indicator measures how far the price is away from Moving Average or multiple Moving Averages (from Lowest MA Period to Highest MA Period). also you can apply weighted factor that increase / decrease from lowest MA to highest MA period.
Inputs:
Lowest MA Period Highest MA Period Weighted factor for Lowest MA Period Weighted factor for Highest MA Period MAs method MAs applied price ATR Period 1st band factor 2nd band factor 3rd band factor indicator Applied price
FREE

Индикатор отображает 4 текущих уровня между, которыми находится цена. Уровни вычисляются на основе диапазона предыдущей недели. Количество и значение уровней произвольное и выражается в процентах . Положение уровней отсчитывается от минимума предыдущего дня (пример можно посмотреть в описании параметров). Целесообразно размещать уровни в строке настроек по порядку, тем не менее индикатор сам их отсортирует и если обнаружатся уровни отстоящие менее чем на 1% выдаст ошибку. Индикатор работает н
volume MTF is the way to give you the Volume of currency and you will Know the trend and reflection when happen it used on scalping and entraday trading strategy with (M1....H4) Timeframe i always going take a look on higher timeframe then back to small timeframe and wait an indicator signals the setting of indicator i usually used the default just remove the arrows from setting this indicator recommended for scalping

The breakout algorithm is a technique based on price, price features, to shape a breakout strategy. The strategy in this indicator will not be redrawn (none-repaint indicator), it is suitable for short or long term traders In the screenshot is the EURUSD pair, these currency pairs, commodities or stocks, it have similar strength *Non-Repainting (not redrawn) *For Metatrader4 Only *Great For Scalping *Great For Swing Trading *Arrow Entry, Green is Long, Red is Short *Works On Any Timeframe *Work
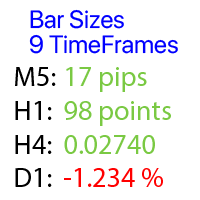
计算每个时间段的价格变化,并使用选定的柱线移动
我的#1助手 :包括36+功能 / 如果您有任何问题,请与我联系 程序文件必须放在"Indicators"目录下
在初始设置中,您可以设置计算条相对于当前条的移位: 1=最后闭合柱的值, 0=当前(打开)柱的浮动值, 2=2条回,依此类推。 可以使用顶行上的蓝色开关选择价格值的类型: Pips; 市场点; 百分比值(%); 价格价值; 计算价格的方法可以使用底部行上的左键进行选择: " Body ":(开-关)价格; " Shadow ":(高-低)价格; 该实用程序显示在图表上的单独窗口中: 窗口可以使用< M >按钮移动到任何地方; 界面可以使用" ^ "按钮最小化; 您可以使用 " Dark " 按钮在浅色/深色主题之间切换。

MyArrow 指标 Nr:1 该指标由移动平均线创建,该移动平均线通过检查高低系列和通过超过图形上从这些移动平均线得出的波段值接收到的信号创建。 您很容易理解,向下的箭头表示有希望的卖出信号,向上的箭头表示可能的买入信号。 收获很多... MyArrow 指標 Nr:1 該指標由移動平均線創建,該移動平均線通過檢查高低系列和通過超過圖形上從這些移動平均線得出的波段值接收到的信號創建。 您很容易理解,向下的箭頭表示有希望的賣出信號,向上的箭頭表示可能的買入信號。 收穫很多... MyArrow 指標 Nr:1 該指標由移動平均線創建,該移動平均線通過檢查高低系列和通過超過圖形上從這些移動平均線得出的波段值接收到的信號創建。 您很容易理解,向下的箭頭表示有希望的賣出信號,向上的箭頭表示可能的買入信號。 收穫很多...

Idea: RSI ( Relative Strength Index) and CCI ( Commodity Channel Index ) are powerfull to solved the market. This indicator has Smoothed Algorithmic signal of RSI and CCI. So that, it separates the market into buy and sell zones, these areas are marked with arrows, red for downtrend, green for uptrend. This algorithm has the effect of predicting the next trend based on the historical trend, so users need to be cautious when the trend has gone many candles. Please visit screenshots

The Salinui trend indicator works using a special algorithm. It finds the current trend based on many factors. Indicator entry points should be used as potential market reversal points. Simple and convenient indicator. The user can easily see the trends. The default indicator settings are quite effective most of the time. Thus, all entry points will be optimal points at which movement changes. You can customize the indicator based on your needs.
You can use this indicator alone or in combinat

The Goodfellas indicator analyzes the price behavior and if there is a temporary weakness in the trend, you can notice it from the indicator readings, as in the case of a pronounced trend change. It is not difficult to enter the market, but it is much more difficult to stay in it. With the Goodfellas indicator it will be much easier to stay in trend! This indicator allows you to analyze historical data and, based on them, display instructions for further actions on the trader's screen.
Every

As you know, the main invariable indicator of all traders is the moving average; it is used in some way in most strategies. It is also obvious that this indicator is capable of showing good entries in every local area. For which it usually needs to be optimized or just visually adjusted. This development is intended for automatic optimization of the indicator. Once placed on the chart, the indicator will automatically re-optimize itself with the specified period ( PeriodReOptimization ) and dis
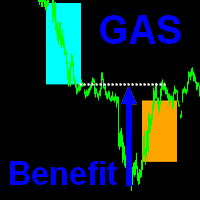
The indicator is based on the principle of closing the Gap of the American trading Session ( GAS ).
How is the Intersession Gap formed? A time interval is formed between the closing of a trading session and the opening of a new one (the next day) about 15 hours, during this time the price may deviate from the closing price in any direction. It is noticed that such deviations in 95% of cases are temporary and the price returns to the closing point of thesession. What does the indicator do? Th

"Capture the sleeping and waking alligator." Detect trend entrance/exit conditions - this indicator can also be tuned according to your trading style. You can adjust a confidence parameter to reduce false positives (but capture less of the trend). This is based on a modification of the Alligator indicator by Bill Williams, an early pioneer of market psychology. 2 main strategies: either the " conservative" approach to more frequently make profitable trades (at a lower profit), or the " high r
FREE

The King of Forex Trend Cloud Indicator is a trend following indicator based on moving averages. The Indicator is meant to Capture both the beginning and the end of a trend. This indicator can be used to predict both short and long terms market trends. The king of Forex Trend Cloud if paired together with the King of Forex Trend Indicator can give a broad picture in market analysis and forecasts. I have attached images for both the The king of Forex Trend Cloud on its own and The king of Fore

The Extremum Average signal indicator works on all timeframes and any markets. Analyzes the smoothed data of extremums and gives signals to sell or buy.
The indicator has only two settings: Number of Bars - the number of last bars to search for an extremum Period Average - Period (number of last bars) for data smoothing For each timeframe and market, you need to select its own values. Additionally, in the indicator settings, you can set your own style of signal display: Size Arrow Code Arrow

The QRSI indicator is one of the most important and well-known indicators used by traders around the world. All signals are generated at the opening of the bar. Any closing price or zero bar prices are replaced with the corresponding price of the previous bar in order to avoid false results. This indicator is suitable for those who are interested in the classic calculation method but with improved functionality. There is a version for both MT4 and MT5.
By its nature, the QRSI indicator is

The Dictator indicator is based on the process of detecting the rate of change in price growth and allows you to find points of entry and exit from the market. a fundamental technical indicator that allows you to assess the current market situation in order to enter the market of the selected currency pair in a trend and with minimal risk. It was created on the basis of the original indicators of the search for extremes, the indicator is well suited for detecting a reversal or a large sharp jer

Whether trading stocks, futures, options, or FX, traders confront the single most important question: to trade trend or range? This tool helps you identify ranges to either trade within, or, wait for breakouts signaling trend onset.
Free download for a limited time! We hope you enjoy, with our very best wishes during this pandemic!
The issue with identifying ranges is some ranges and patterns are easy to miss, and subject to human error when calculated on the fly. The Automatic Range Identi
FREE

Informative & optimized Zigzag, Accumulated volume, Price change A rewrite of the traditional zigzag tool with new additions. Features:- Optimized code Displays accumulated volume between peaks Displays price change between peaks Usage:- Identify trend swings Identify high volume swings Compare price changes between swings Drawing Fibonacci tool on strong price change or high volume swings
FREE

The indicator displays 4 current levels between which the price is located. The levels are calculated based on the range of the previous day. The number and value of levels is arbitrary and expressed as a percentage. The position of the levels is calculated from the minimum of the previous day (an example can be found in the description of the parameters). It is advisable to place the levels in the settings line in order, nevertheless, the indicator will sort them by itself and if levels are fou

Powerful Trading Tool for Your Desired Results This tool can help you achieve the trading results you want. It's a 2-in-1 solution, suitable for both Binary Options and Forex trading. Key Features: Versatility: It serves as a versatile tool for trading both Binary Options and Forex markets. Consistent Performance: The indicator demonstrates excellent performance on both Binary Options and Forex markets. Continuous Improvement: The tool will continue to be enhanced to meet evolving trading
Buy a Coffee for Yuniesky Carralero Cuellar
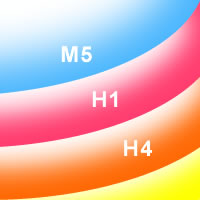
This indicator draws : . Simple Moving Average 20 - <Blue> . Simple Moving Average 20 - H1 <Purple> . Simple Moving Average 20 - H4 <Orange> on THE SAME GRAPH
You will need to use the MAV4 template that shows
1. Simple Moving Average 20
2. Period Separators
3. ASK line
Support I will be happy to hear your recommendations to improve this product.
Author Yuniesky Carralero Cuellar, Computer Scientist
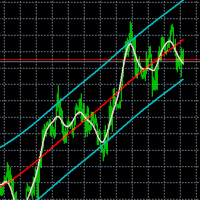
Flex channel - indicator plots channel using Hodrick-Prescott filter. Hodrick-Prescott filter is the method of avreaging time series to remove its cycling componets and shows trend. Settings HP Fast Period - number of bars to calculate fast moving average
HP Slow Period - number of bars to calculate slow moving average
Additional information in the indicator Channel width - channel width in pips at first bar MA position - fast moving average position in the channel in persentage
Close positio

Indicator Simple ATR It is used in technical analysis to measure market volatility and show it as a level that is more understandable to the eye and not as an oscillator. There are 3 types of ATR measurement in total
Day - Blue Weekly - Red Monthly - Yellow
The possibilities of using the APR in trade can be found in the internet. It can also be used in conjunction with another author's indicator Volatility Vision
The Average True Range indicator measures market volatility. Volatility

Future prediction is something any trader would love to know, through this simple prediction algorithm can give a picture of the future. This algorithm is based on past data and the average prices of the data to simulate future candles. This is an indicator that will be redrawn. This indicator is completely free, can be used as a trend reference but absolutely do not use for trading.
FREE

"Drivers Road Bands" indicator that is designed to be used in the 1H, 4H and 1D timeframes in the most ideal way. If we compare timeframes to roads and streets; main streets and highways with high traffic volume are similar to high-time timeframes in technical analysis. If you can interpret the curvilinear and linear lines drawn by this indicator on the graphic screen with your geometric perspective and develop your own buy and sell strategies; you may have the key to being a successful trader.
FREE

Indicator showing the breakout after at least X candles of the same sign, followed by an opposite candle. PARAMETERS: BARS TO SHOW = Story of Indicators (0 = all bars) Consecutive Bars for Breakout = How many Bars of the same direction and after a Bar with opposite direction Minimu Point between H/L = To consider a bar valid, she must have a Minimun Hi/Lw value Minimu Point between O/C = To consider a bar valid, she must have a Minimun Open/Close value Graphics are self-explanatory
FREE

Catch major price movements, early in the trend. Alerts you to enter at the likely beginning of a trend, and if it's incorrect, quickly alerts you to exit to limit any loss. Designed to capture large, profitable price movements, with early entrance to maximize your returns. As shown in screenshots, typical behavior is several quick entrance/exists with small loss , and then capture of a large trend with high profits . The Instantaneous Trend indicator is a lag-reduced method to detect pri

Artificial intelligence is a trend of the times and its power in decoding the market has been demonstrated in this indicator. Using a neural network to train the indicator to recognize trends and remove noise areas caused by price fluctuations, this indicator has obtained a reasonable smoothness for analyzing price trends. This indicator is none repaint. Suitable for day traders or longer traders *Non-Repainting (not redrawn) *For Metatrader4 Only *Great For Swing Trading *Histogram Up is Long,

The parabolic stop and reverse (PSAR) indicator was developed by J. Welles Wilder, Jr. as a tool to find price reversals which can be utilized as stop-loss levels as well as trade triggers. The notable difference about the PSAR indicator is the utilization of time decay. The PSAR indicator forms a parabola composed of small dots that are either above or below the trading price. When the parabola is below the stock price, it acts as a support and trail-stop area, while indicating bullish up t
FREE

HLOC Trend Indicator This indicator helps you to determine trend direction on your trade. Default parameters for H1 time frame. You can use this indicator both bigger time frame and smaller time frame to open a trade. The calculation is based on high, low, opening and closing price values of each bar in the selected time period. When the values found in the Indicator custom formula are exceeded, the buy or sell signal falls on the screen. There are two extern inputs; RiskFactor: Early but risky
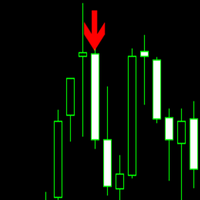
Trade trends with the Super Scalper Use on all time frames and assets it is designed for scalping trends. Works good on small time frames for day trading. The arrows are easy to follow. This is a simple no repaint/no recalculate arrow indicator to follow trends with. Use in conjunction with your own system or use moving averages. Always use stops just below or above the last swing point or your own money management system The indicator comes with push notifications, sound alerts and email

Excellent tool: added features - If you don't know exactly how to place the stop loss. This tool is right for you. After opening the position, 4 levels of stop glosses are drawn and you determine which form of risk suits you. You will significantly increase the chance that the market will not kick you out unnecessarily and then you will reach your tatget without you. If you need more information than a few numbers in the iExposure index, this indicator is for you.
Better iExposure indicator
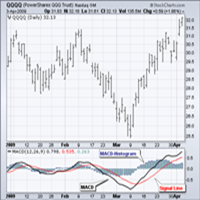
Standard MACD is the 12-day Exponential Moving Average (EMA) less the 26-day EMA. Closing prices are used to form the MACD's moving averages. A 9-day EMA of MACD is plotted along side to act as a signal line to identify turns in the indicator. The MACD-Histogram represents the difference between MACD and its 9-day EMA, the signal line. The histogram is positive when MACD is above its 9-day EMA and negative when MACD is below its 9-day EMA. Peak-Trough Divergence The MACD-Histogram anticipate

The resistance and support lines are the position where the price will have a change, be it a breakout to follow the trend or reverse. The price rule will go from support to resistance and Long's resistance can be Short's support and the opposite is true. Accurately identifying support and resistance lines is the key to being able to trade well and profitably. This indicator is based on the Fractals indicator, the indicator will be redrawn by 2 candles. *Great For Swing Trading *Blue is Support

Price breakouts, Levels, Multi-time frame Inside bars checks for price failure to break from the previous high/low and on breakout draws a breakout box on the chart. The choice of breakout price is given to the user i.e. close or high/low of bar. Alerts can be received on breakouts. Features:- Multi-time frame Alerts, notifications & emails Usage:- Breakout signals Check how price action is evolving with the help of boxes Get multi-time frame bias
This indicator is based on Linda Bradford Rashkes First Cross system.
Normally trend based systems follow the trend from beginning to end, but this indicator instead selects a piece of the trend. This approach can be a very reliable alternative way of trading a trend.
It waits for the 1st move to become exhausted then enters in anticipation of a sudden surge. The trend if found using a faster momentum indicator. When we get a cross on the 2nd oscillation we get our signal. Hence we capture
Ferox Least Squares Regression is an algorithm that uses regression and is design by Ferox Quants-Labs to use method like typical quantitative algorithm, using statistics and use past data to predict the future. * None Repaint indicator * Quantitative algorithm *Great For Swing Trading * Histogram Up is Long, Down is Short *Works On ALL Timeframe *Works On Any MT4 Pair
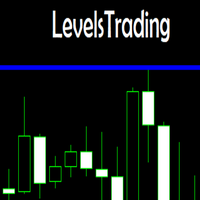
This indicator is a simple stripped down version of any advanced support and resistance indicator. All the support and resistance indicators work from a number of bars that have developed over time. Get rid of clutter and confusing levels. Find levels according to a number of bars. Look at days, session, numbers of hours, periods of consolidation. Watch levels develop and use as breakout points, or areas of buyers and sellers. Features and things to consider This indicator is for a frame of

Please read the comment section for more introduction about indicator. ( i cant put all lines in here their is limit ) Entry conditions ---------------- Scalping - Long = Green over Red, Short = Red over Green Active - Long = Green over Red & Yellow lines Short = Red over Green & Yellow lines Moderate - Long = Green over Red, Yellow, & 50 lines
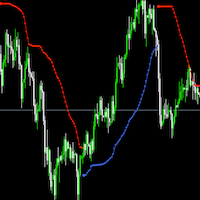
Bbandtrend 一款趋势指标,可以用来判断外汇、黄金等商品的趋势,用于辅助交易,提高交易的胜率。每个人都可以调整参数,适应不同的货币。 指标多空颜色可以自定义。 extern int Length=60; // Bollinger Bands Period extern int Deviation=1; // Deviation was 2 extern double MoneyRisk=1.00; // Offset Factor extern int Signal=1; // Display signals mode: 1-Signals & Stops; 0-only Stops; 2-only Signals; extern int Line=1; // Display line mode: 0-no,1-yes extern int Nbars=1000;
The sample on the right corner of the chart uses Font Size 20. The characters/numbers will start from the right side/corner of the chart, so that when increase the font size, the text will expand out to the left/top and won't goes to the right/bottom and get hidden. Able to change these Inputs. a. Other Symbol. Current chart symbol will always be displayed. b. Fonts. c. Font size. d. Text color (All the text label, local time, bid, ask, spread, lots, number of trades, Margin, Free Margin, Mar

PRO Renko Arrow Based System for trading renko charts. 准确的信号交易任何外汇工具. 另外,我将免费提供系统的附加模块! PRO Renko系统是RENKO图表上高度准确的交易系统。该系统是通用的。 该交易系统可应用于各种交易工具。 该系统有效地中和了所谓的市场噪音,打开了获得准确反转信号的通道。 该指标易于使用,只有一个参数负责产生信号。 您可以很容易地使算法适应您感兴趣的交易工具和renko酒吧的大小。 我很乐意通过提供任何咨询支持来帮助所有客户有效地使用该指标。 祝您交易成功!购买后,立即写信给我! 我将与您分享我的建议和我的renko发电机。 另外,我将免费提供系统的附加模块!
標準化趨勢逆轉多時間框架指標 標準化趨勢反轉多時間框架指標已被開發為極其可靠的趨勢反轉指標。 標準化趨勢反轉多時間框架指標適用於所有外匯貨幣對和金屬,並可以與各種時間框架圖表匹配。 標準化趨勢反轉多時間框架指標在單獨的窗口中使用兩個修改後的移動平均線系統的交叉來生成信號。 這些平均水平稱為標準化趨勢反轉多時間框架指標。 藍色平均水平稱為快速標準化趨勢反轉多時間框架指標,而慢速標準化趨勢反轉多時間框架指標繪製為紅色平均水平。 每當快速藍色標準化趨勢反轉多時間框架指標越過較慢的紅色標準化趨勢反轉多時間框架指標時,它被視為看漲交叉信號,表明買入進入市場。 另一方面,當緩慢的紅色標準化趨勢反轉多時間框架指標交叉並保持在快速藍色指標之上時,就會出現看跌交叉。 有一個買家支持小組,請在評論中詢問。 一般信息 標準化趨勢逆轉多時間框架指標具有指導功能。 這意味著指標本身會在當前安裝的圖表上向您顯示交易示例。 入口和出口通過虛線可視化並明顯連接。 因此,您可以使用標準化趨勢反轉多時間框架指標不斷改進您的交易。 我們建議使用此電子通信網絡帳戶以獲得最佳結果,因為標準化趨勢反轉多時間框

您在图表上看到的趋势并不总是趋势,或者更准确地说,是可以赚钱的趋势。关键是有两种趋势。: 1) 由稳定的基本经济原因引起的真实趋势,因此可以为交易者提供可靠的利润; 2) 并且存在看似趋势的虚假趋势区域,是由于一连串随机事件使价格(主要)向一个方向移动而出现的。这些虚假趋势部分很短,可以随时反转方向(通常在识别后立即反转);因此,通过它们赚钱(并非偶然)是不可能的。从视觉上看,真实和错误的趋势在开始时是无法区分的;此外,随机价格变动或由它们产生的虚假趋势总是叠加在真实趋势上,从而为真实趋势创造回调。需要识别随机回调,并将其与由新的基本经济原因引起的逆转区分开来。 Casual Channel 指标通过绘制随机价格变动通道来区分这两种趋势。如果您将此指标附加到货币对图表,那么这些图表通常会完全处于随机游走的通道内,其中许多趋势部分(但不是全部)都是错误的。同时,价格将从一个通道边界移动到另一个仅触及通道边界。如果您将“休闲通道”附加到大时间范围内的指数、差价合约或股票图表,那么在某些情况下,您可能会发现它们的报价在很长一
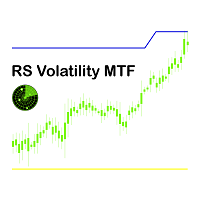
雷达信号波 动率多时间帧指示器 元交易者 4 雷达信号波 动率 多 时间帧指示器 已被开 发为极其可靠的趋势指标。 雷达信号波 动性多时间框架 适合所有外 汇货币对,可以匹配各种时间框架图表。 雷达信号波 动率多时间帧指示器 基于移 动平均系统和价格的交叉生成趋势信号。 考 虑到平均真实范围,现在定义了确切的入口点。 黄 线显示 了 这个可能的切入点。 当价格越 过黄线时,即可开仓。 蓝线显示可能的获利。 当价格穿 过蓝线时,可以关闭交易。 两条 绿线显示了当收盘价突破带点的绿线时趋势发生变化的区域。 这条带点的绿线可用作可能的止损点、可能的盈亏平衡点或可能的追踪止损点。 一旦价格触及 绿色,没有点的绿线可用作强劲趋势期间的可能重新进入。 有一个 买家支持小组,在评论中询问。 一般信息 我们推荐使用此电子网络通信帐户以获得最佳结果,因为雷达信号波动率多时间框架指标已通过经纪商 Roboforex 的电子通信网络数据馈送进行了优化。 参数 在 设置中,可以为雷达信号波动率指标设置相应的时间帧、上带价格、下带价格、突破模式、移动平均周期、移动平均方法、平均真实
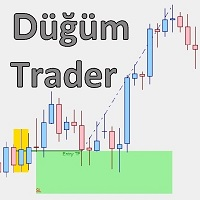
Düğüm Trader是一款基于我们研发团队的渐进式价格行动方法而开发的进入区检测器和交易建议指标。这个工具将帮助交易者更深入地了解潜在的支撑和阻力区。
该指标有特殊的计算方法来寻找高密度挂单区域作为进入区,并通过价格行动规则来过滤它们。在生成新的进入区后,它将等待验证,即带有 "进入 "标签的绿色线。在这一验证之后,根据区域的突破面(向上或向下)指标决定订单类型。当价格回到入市价时,该订单将被视为市场交易,SL矩形将被画出,以明确显示交易的寿命。
当盈利点等于或大于SL点时,交易将是一个有利可图的订单。这意味着,当RR至少为1:1时,指标将把交易算作赢家交易。这使用户放心,指标的设计和操作有一个严格的方法。此外,如果有其他成功的交易,因为进场价格的修饰,这些交易将不会在最终结果统计或图形演示或指标本身的任何其他部分被提及。
如前所述,我们对胜率的计算采取了悲观的态度。每笔交易如果不能达到1:1的风险回报比,即使在触及SL之前达到盈利(小于SL点),也会被视为SL。然而,指标给出了SL/TP和平均风险回报率的概述,以帮助交易者为其交易策略进行适当的设置。
对于胜率的

METATRADER 5 的警报向上 - 向下
当价格离开 UP 和 DOWN 线之间的区域时,该指标会生成警报。
您可以生成各种类型的警报,例如:
> 声音
> 留言框
> 在专家框中留言
> 邮件(之前配置)
> 推送通知(先前配置)
线条必须从指标属性配置,而不是从线条属性配置,因为如果从线条属性完成,finonacci 可能会受到影响。
在这些设置中,您可以更改颜色、线条样式和宽度。 线条必须从指标属性配置,而不是从线条属性配置,因为如果从线条属性完成,finonacci 可能会受到影响。
在这些设置中,您可以更改颜色、线条样式和宽度。 线条必须从指标属性配置,而不是从线条属性配置,因为如果从线条属性完成,finonacci 可能会受到影响。
在这些设置中,您可以更改颜色、线条样式和宽度。

The new update makes this indicator a complete tool for studying, analyzing and operating probabilistic patterns. It includes: On-chart Multi-asset percentage monitor. Configurable martingales. Twenty-one pre-configured patterns , including Mhi patterns and C3. An advanced pattern editor to store up to 5 custom patterns. Backtest mode to test results with loss reports. Trend filter. Hit operational filter. Martingale Cycles option. Various types of strategies and alerts. Confluence between patte

The Driver trend technical indicator is used to analyze price movements in the Forex market. It is included in the so-called arrow indicators. And it is very practical in that it forms arrows in places where buy signals appear, or, conversely, sell signals.
The indicator helps to analyze the market at a selected time interval. He defines the mainstream. The Driver trend indicator makes it possible to classify the direction of price movement by determining its strength. Solving this problem he

The Others indicator is a trend-type indicator. In those moments when you need to make a decision to enter a position and give the trader a direction. The indicator gives the trader the opportunity to visually determine which trend will be present at a particular time interval. These are auxiliary tools for technical analysis of the market. Recommended for use in conjunction with any of the oscillators.
The main application of the Others indicator is to generate buy and sell signals. Determin

The Spurts trend indicator is used to determine the strength and direction of a trend and to find price reversal points.
The trend can be ascending (bullish) and decreasing (bearish). In most cases, the trend grows for a long time and falls sharply, but there are exceptions in everything. The price movement can be influenced by economic and political news. A trend is a stable direction of price movement. To find it, the indicator uses calculations designed to smooth out sharp fluctuations tha

Haine is a reversal indicator that is part of a special category of instruments. The indicator not only analyzes the price movement, but also indicates the points of possible reversals. This facilitates fast and optimal opening of buy or sell orders (depending on the current situation). In this case, the historical data of the analyzed asset must be taken into account. It is the correct execution of such actions that largely helps traders to make the right decision in time and get a profit.
T

I suggest that everyone who is interested in the Smoking indicator try to trade.
Smoking is a technical analysis tool that uses mathematical calculations to determine various aspects of price movement and is based on historical data. Smoking reveals special aspects of price movement and allows traders to make the right decision. All trading indicators analyze the price from different angles based on historical data. Therefore, it is not entirely correct to say that they can predict the future

Signal Alien is a handy tool if you are used to trading on a clean chart, but sometimes you need to take a look at this indicator. That is, everything is as simple as possible, positions are closed in the opposite way, that is, as soon as a signal is received to open an order in the direction opposite to your position. For example, you opened a long position (sell), close it when a red arrow appears pointing down.
If you are not sure how to determine the inflection point of the trend and are

This indicator is good for small time frames like 1 and 5 minutes and made for day trading. The indicator never repaints or recalculates. The indicator works is for trading swing points in day trading, following bulls or bears. Its a simple to use, non cluttered indicator with a high success rate. This indicator works well to capture ranges. All indicators come with limitations and no indicator or system is always accurate. Use money management for long term trading success. Place in backte

Signal Finding is a trend indicator, a technical analysis tool that helps to determine the exact direction of a trend: either an upward or a downward movement of the price of a trading instrument. Although these indicators are a little late, they are still the most reliable signal that a trader can safely rely on. Determining the market trend is an important task for traders. With this indicator, you can predict future values. But the main application of the indicator is to generate buy and sel

RSI Scanner Plus Indicator scans RSI values in multiple symbols and timeframes. Plus trend line buffer on the chart. Features:
-Trend Line : We add trend line on the chart in the hope it help you to see current trend on the chart while following oversold and overbought from RSI. This is additional feature in the indicator. We consider that following the trend is very important in trading. -Changeable Panel Display : Change the value of Max.Symbols/Panel and the indicator will adjust the d
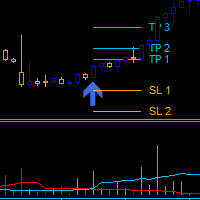
Dark Power is an Indicator for intraday trading. This Indicator is based on Trend Following strategy, also adopting the use of an histogram to determine the right power . We can enter in good price with this Indicator, in order to follow the strong trend on the current instrument. The histogram is calculated based on the size of the bars and two moving averages calculated on the histogram determine the direction of the signal
Key benefits
Easily visible take profit/stop loss lines Int

Ing (inguz,ingwar) - the 23rd rune of the elder Futhark ᛝ, Unicode+16DD. Add some runic magic to your trading strategies. The correct marking of the daily chart will indicate to you the successful moments for counter-trend trading. Simple to use, has high efficiency in volatile areas. Be careful in lateral movements.
Signals ᛝ are generated when the main lines of construction intersect.
Red arrow down - recommended sales
Blue up arrow - recommended purchases
rare purple arrows indicate
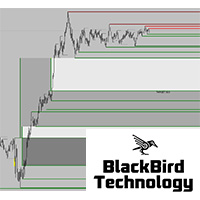
New market liquidity indicator, more accurate with two levels, will really unhide the "hidden agenda" of the price action in any timeframe. For more information about market liquidity, a manual on how to use this indicator please send me a message.
A lot of information can be found on the net. (search liquidity trading/ inner circle trader)
https://www.youtube.com/watch?v=yUpDZCbNBRI
https://www.youtube.com/watch?v=2LIad2etmY8& ;t=2054s
https://www.youtube.com/watch?v=wGsUoTCSitY& ;t
a tool for working with binary options well identifies the trend and possible market reversals
can be used for forex scalping
it works very well on binary options if used with oblique levels or wave analysis, it will be a good assistant in determining the entry point
recommended expiration time from 1-15 depending on the selected timeframe
the next update will add the ability to customize the tool.

This is a multi-timeframe multi-currency Fibo (Fibonacci levels) and Pivots scanner which also shows Missed Pivot count and Fibo Golden Ratio Zones. Select separate Pivot Timeframes for each Dashboard Timeframe Check when price is near a Pivot point Check for Price Crossing Pivot Point Use Mid Pivots (Optional) Show Missed Pivots (Optional) Show High Volume Bar Use Fibo (Optional) Use Fibo Golden Ratio (Optional) Set your preferred Timeframe for Fibo or Pivots
Check out Common Scanner Settin

Smart ADR as an indicator displays the average daily range of 3 timeframes such as Daily, Weekly, and Monthly. Using the combination of 3 timeframes of ADR as a reference to shows fixed range and dynamic range targets as lines on your charts.
Inputs
Smart ADR Parameters Indicator Name - Display the indicator name Daily Periods - Display the Daily Periods of ADR Weekly Periods - Display the Weekly Periods of ADR Monthly Periods - Display the Monthly Periods of ADR Daily Line Show ON - Set

Master scalping with this indicator. Trade on any time frame for scalps on buy or sells. Follow trends using a 200 moving average and stops and targets. Use with your own system. This indicator can give pips if following it correctly. Stick to rules and pick up pips daily. Use as entries in a trend, scalp for a few pips or exit on opposite signal. Best to follow higher time frame trends. Indicator doesn't repaint or recalculate. Rules: Don't trade overnight, only trade during active sessi

Use Stochastic Oscillator (STO) Oversold and MACD < 0 show buy signal Use Stochastic Oscillator (STO) Overbought. and MACD > 0 show sell signal
Please check support resistance before opening an order. This indicator is only a helper. Can't tell you 100% right.
"Selling pigs" is a trivial matter. "Sticking on a mountain" is a challenge. Thanks you. welcome.
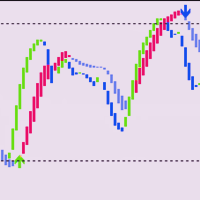
Necessary for traders: tools and indicators Waves automatically calculate indicators, channel trend trading Perfect trend-wave automatic calculation channel calculation , MT4 Perfect trend-wave automatic calculation channel calculation , MT5 Local Trading copying Easy And Fast Copy , MT4 Easy And Fast Copy , MT5 Local Trading copying For DEMO Easy And Fast Copy , MT4 DEMO Easy And Fast Copy , MT5 DEMO
Auxiliary indicators It wait s for the hunt, waits for the price limit to appear, waits for
MetaTrader市场是 出售自动交易和技术指标的最好地方。
您只需要以一个有吸引力的设计和良好的描述为MetaTrader平台开发应用程序。我们将为您解释如何在市场发布您的产品将它提供给数以百万计的MetaTrader用户。
您错过了交易机会:
- 免费交易应用程序
- 8,000+信号可供复制
- 探索金融市场的经济新闻
注册
登录