适用于MetaTrader 4的新技术指标 - 16

An extended version of the indicator for visualizing the time ranges of key trading sessions: Asian, European and American. The main advantage of this indicator is the automatic construction of a price profile for a trading session. The indicator has the functionality to set the start and end time of each trading session, as well as automatically determine the time zone of the trading server. The indicators include the ability to work with minimal CPU usage and save RAM. In addition, the option

An indicator for visualizing time ranges of key trading sessions: Asian, European, and American. The indicator features functionality for setting the start and end times of each trading session, as well as an adjustable timezone of the trading server. The main advantages of the indicator include the ability to operate with minimal CPU load and memory usage. Moreover, it offers the option to specify the number of displayed historical days, providing the user with flexible market dynamics analysis
FREE
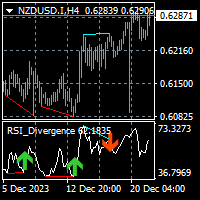
The indicator shows/alerts divergences of RSI indicator. note: You can check the free EA here that utilizes this indicator. repaint and lag issue Divergence indicators are usually repaint and lagging in their nature. You may have experienced in trading when you see a divergence on chart but the divergence continues further or just disappear. pivots_period input The smaller this value is the more and faster signals are generated. The greater this value you will have less and late signals. displa
FREE

ALQANNAS (Sniper) Indicator Overview: Welcome to ALQANNAS, your ultimate sniper in the forex market! ALQANNAS is a powerful and versatile trading indicator designed to enhance your trading experience. Whether you're a beginner or an experienced trader, ALQANNAS provides you with accurate non repainting signals, trend direction and strength, and advanced features to elevate your trading strategy. Key Features: Buy and Sell Signals: ALQANNAS is equipped with a sophisticated algorithm that genera

McS Super Trend -This is one of the most popular classic trend indicators. It has a simple setting, allows you to work not only with the trend, but also displays the stop loss level, which is calculated by this indicator. Benefits:
Instruments: Currency pairs , stocks, commodities, indices, cryptocurrencies. Timeframe: М15 and higher. Trading time: Around the clock. Shows the direction of the current trend. Calculates the stop loss. It can be used when working with trading. Three types of no
FREE

Just an excellent arrow indicator with 96 percent accuracy. It uses trend moving averages to detect trend direction change and alert with corresponding arrow. It does not repaint and the alert is optional on the basis of current bar or previous bar. Please this indicator is not responsible for every of your trading position and it must be used in conjunction with other indicators to make trading.

Introducing our cutting-edge product, an innovative MACD Oscillator with a dynamic level enhanced by a decimal point Moving Average (MA) also with the versatility of multiple moving average modes. This advanced trading tool brings precision and flexibility to your technical analysis, offering a seamless experience for traders seeking a competitive edge in the financial markets.
Key Features: Dynamic Level Precision Our MACD Oscillator is equipped with a dynamic level feature, providing traders
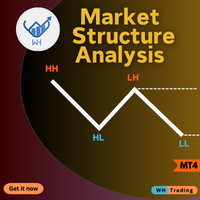
Are you tired of missing crucial market movements? Do you wish for a tool that not only identifies swing points but also provides insights into price action movements?
Look no further – our Market Structure Analysis indicator is here to revolutionize the way you analyze markets on MQL5! MT5 Version : WH Market Structure Analysis MT5 Key Features:
Swing Point Detection: Our indicator excels at identifying significant swing points in the market, helping you understand key turning points with p
Simple but effective entry improving indicator that you want to use. Combine with other indicators and your trading strategies. Explore different ways to use it and find your perfect entry.
Basic instructions: Buy Signal Example: colour change from red to green Sell Signal Example: colour change form green to red
Check screenshots below for examples of use.

Introducing our advanced MQL4 Indicator, a groundbreaking tool for identifying support and resistance zones with unmatched precision. Elevate your trading strategy with a host of features, including a dual-color upper and lower box system that allows for easy visual recognition of market trends.
Key Features: Dual-Color Box for the Support and Resistance Zones Customize your analysis with dual-color box. The upper and lower boxes offer distinct colors, providing a clear visual representation o

Introducing our revolutionary intra-day trading indicator, meticulously crafted to optimize your trading insights within the 24-hour market cycle. Immerse yourself in historical data with precision using two distinctive modes - "All History" and "Last X Hours."
Key Features: All History Mode Uncover a comprehensive view of the day's dynamics. Instantly analyze the preceding day's high and low, 50% mid-point, and the open versus close price for the current day. Decode critical patterns to infor

تمكين الصفقات الخاصة بك مع مؤشر الأمل الجيد تحقيق التكامل لنقاط دخول قوية إذا كنت تبحث عن طريقة لتحسين تداولك في الفوركس، فإن مؤشر الأمل الجيد موجود هنا لإرشادك. يتميز هذا المؤشر بقدرته على الدمج الفعال لمختلف المؤشرات المعروفة، مما يؤدي إلى نقاط دخول قوية وتحليل شامل للسوق. ما الذي يميز الأمل الجيد؟ <أ ط=0>1. تكامل المؤشر: تتفوق شركة Hope Good في استخدام مجموعة متنوعة من المؤشرات المعروفة ودمجها بشكل فعال، مما يوفر لك تحليلًا شاملاً للسوق. <أ ط=0>2. نقاط الدخول القوية: يعمل المؤشر على توليد نق
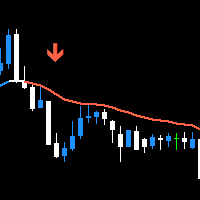
Trend Swift is the trend finding indicator that can estimate the trend volume for you. It help you seeking for the possible trend reversal so you can enter the trade with confident. Because it's indicator you can trade with your decision and really safe to use with any Prop Firms without worry about the rule that doesn't allowed to use EA to trade. This indicator isn't the the normal indicator that just blindly follow EMA, it's the trading system that surely find major trend with EMA but measur

The Trend Analysis Indicator is an innovative tool designed for traders and investors who seek to navigate the complexities of the financial markets with greater precision and insight. This powerful indicator is engineered to adeptly identify whether a market is trending or not, offering users a vital edge in their trading strategy. Key Features: Accurate Trend Detection : The core functionality of the Trend Analysis Indicator lies in its ability to accurately detect market trends. It analyzes p

推介 Market Structure Break Out for MT4 – 您的专业 MSB 和不间断区域指标 该指标正在持续更新。 我们努力提供基于市场结构的高精度进场和出场点。当前版本为1.6,以下是最新的更新内容,欢迎加入我们: 买卖目标: 清晰了解买入和卖出仓位的最佳止盈水平。 最新MSB方向: 通过显示最近的市场结构突破方向,保持最新动态,做出更好的决策。 增强视觉模式: 使用新的美观模式自定义您的图表,包括浅色、深色或个性化主题。 实时回测开关: 通过屏幕上的新按钮轻松打开或关闭实时回测功能。 加入 考拉交易解决方案频道 在 mql5 社区了解所有考拉产品的最新消息,加入链接如下: https://www.mql5.com/en/channels/koalatradingsolution
Market Structure Break Out:纯粹分析市场波动的方式
此指标旨在绘制市场结构和运动波动,以找出最佳的 MSB 或市场结构突破,当市场有运动并打破最近的结构时,可以确定此突破的因素有多大,如果它超过特定因素,就意味着可以确认突破,因此您可以在此工具中

体积轮廓(Volume Profile)作为一种卓越的分析工具,为交易者提供了对市场动态的复杂视角——捕捉价格波动随时间推移的持续变化。这种实时图形表示组织了拍卖数据,揭示了市场运动内在的集体行为模式。 其核心是价值区域(Value Area),包含了每日交易活动的68%的价格范围。这个区域,相当于一个标准差,反映了大部分交易的发生地。 在体积轮廓中,重要的标志包括控制点(VPOC)或公平价格——在一段时间内成交量最大的价格水平。此外,值得注意的边界是价值区域高(VAH)和价值区域低(VAL),划定了价值区域的上限和下限。 发展中的价值区域(Developing Value Area)描绘了随着时间推移而变化的动态。通过观察发展中的VA(由表示发展中价值区域高和低的线条指示),可以提供有价值的见解。 该指标适用于MT4的逐笔、分钟和范围条,可以灵活调整价值区域和回顾期,帮助精确识别支撑和阻力水平。价值区域高和低的准确性提供了深刻的市场视角。 此外,该指标持续绘制当前和前一天蜡烛图的价值区域和VPOC(分别为实线和虚线)。这种可见性延伸到较低时间框架,提供了对价值区域和VPOC水平的精确

水平指标基于前一天的数据。 数学公式决定进场和出场水平。
交易建议。 在欧洲交易时段开始时,当波动出现时进行 Levels 交易。 在波动不足的情况下,使用一半的止盈位出场。 如果价格在一半止盈位反转,则在反转时也在一半止盈位寻找目标。 如果价格从进场水平反弹,那么在反方向上价格可以达到第二个止盈。
不应总是在突破时进场。建议等待回测(突破水平并从反方向测试)。 如果市场上有几个最低成交量水平,则回测效果很好。请参阅 UPD1 剖面水平指标。
输入参数 。
Start Hour - 一天从几点开始。 00 - 默认 。
Visual Button - 按钮显示(启用/禁用) 。 Corner - 按钮锚定角度 。 X indent - 以像素为单位的水平填充 。 Y indent - 以像素为单位的垂直填充 。
Label Visual - 显示级别标签 。 Label Font Size - 字体大小 。 Label Shift Bars - 在酒吧的铭文的缩进 。 Label Tooltip - 在关卡上方的光标下显示文
FREE

指标从另一种编程语言转换为 MQL。RTI 是以震荡方式识别图表趋势的强大工具。
以下是原始程序员的一些说明:
概述 由 Zeiierman 开发的相对趋势指数 (RTI) 是一种创新的技术分析工具,旨在衡量市场趋势的强度和方向。与某些传统指标不同,相对趋势指数具有独特的适应能力,能对市场波动做出反应,同时还能将微小的短期市场波动的影响降至最低。
相对趋势指数融合了趋势跟踪和均值回复的特点,并采用可定制的直观方法来衡量趋势强度,其对价格走势的敏感性使该指标脱颖而出。
使用该相对强弱指标代替 RSI 的好处 相对强弱指数 (RSI) 和相对趋势指数 (RTI) 都是强大的技术指标,各有千秋。 不过,RTI 与相对强弱指数有一些关键的不同之处,尤其是在识别趋势和超买/超卖(OB/OS)区域方面,RTI 可以说更加复杂和精确。

**IRDeS(距离和峰值检测指标)**是一种从零水平测量力量和距离的指标,几乎完美地确定市场入场时机。 它由一个蓝色的连续线组成,用于测量距离和从零水平的波动,以及一个直方图,红色在零水平以上,绿色在零水平以下,用于测量特定蜡烛中交易的强度和力量,生成一个强大的推动,即“峰值”,在图表的特定点。 IRDeS对于技术分析是一种宝贵、创新和多功能的工具,适用于现代时代,因为它将两个指标合并成一个,能够在进入市场后测量运动的动力质量。 尽管IRDeS具有明显的优点,但与任何指标一样,分析师必须谨慎行事,只关注图表的特定区域,避免其他区域。 特别是,交易员可能会诱使使用该指标来寻找超买或超卖的条件,但这并不总是有效的。IRDeS可以取任何值,这使得准确识别“过量阈值”成为不可能的任务。遵循我们的指导,经过足够的时间和经验,几乎任何人都能够分析图表数据并有效地使用IRDeS。 需要留意的内容: 峰值 (零水平以上的连续线); 深度 (零水平以下的连续线); 明显高的红色或绿色直方图条; 零水平的交叉; 分歧。 峰值: 峰值由IRDeS的蓝色线表示,当其形状为尖峰时在零水平以上。峰值以正值表示,

Martingale Arrow 是一种箭头型 mt4 指标,专为 Martingale 二元期权交易而设计,该箭头打印在柱开盘/柱内并发出警报。 如何使用:箭头出现时开始交易,如果交易获胜,则等待下一个信号并交易同一手数。如果交易在下一个信号时损失双倍手数并继续这样做直到信号获胜,则重置并使用第一个交易手数进行交易。 建议的时间范围:任意 最低存款:200 个单位。 此指示器实时不:重漆/背漆
-------------------------------------------------- -------------
参数 :
指标周期:改变时会给出不同的信号
指标价格/类型
超买/超卖水平
警报输入
箭头样式
===========================================

Indicator Waiting Volatility - an indicator for determining volatility zones and flat conditions.
Over time, the price on the chart is in different trends, goes down, goes up, or stays the same. The indicator helps the trader determine which trend the price is in.
In its work, it uses several tools for technical analysis; first, the direction of the trend is determined, then, in this direction, the indicator monitors changes in volatility.
If the price fluctuates within the noise, it is in tr

This indicator presents an alternative approach to identify Market Structure. The logic used is derived from learning material created by DaveTeaches (on X)
When quantifying Market Structure, it is common to use fractal highs and lows to identify "significant" swing pivots. When price closes through these pivots, we may identify a Market Structure Shift (MSS) for reversals or a Break of Structure (BOS) for continuations. The main difference with this "protected" logic is in how we determine

This is the best Support and Resistance Indicator on the market, and it shows both confirmed Support and Resistance as well as Retests. Support & Resistance: Support marks where buying demand halts price declines, acting as a safety net. Resistance caps price surges, driven by selling pressure. Traders leverage these levels to predict reversals, plan entries, exits, and manage risks, making them trading's fundamental guideposts. You can also find Premium and Discount Levels, Strong High/Low, Wea
FREE

This indicator provides the ability to recognize the SMC pattern, essentially a condensed version of the Wyckoff model. Once the pattern is confirmed by RTO, it represents a significant investment opportunity. There are numerous indicators related to SMC beyond the market, but this is the first indicator to leverage patterns to identify specific actions of BigBoy to navigate the market. Upgrade 2024-03-08: Add TP by RR feature. The SMC (Smart Money Concept) pattern is a market analysis m
Trendfinder MA Pro are based on Colored candlesticks showing the trend based on two Moving Averages as Signal and two Moving Averages as a Buy and Sell Zone, the slope of the slow Signal moving average and ATR and Volume increasing. This indicator will give you the color change on the next bar on the confirmation candle and will provide alert on Buy and sell signal, when it enters the buy and sell zone and when the market test the buy or sell zones as support or resistance and will never repain
FREE

The "Trend Edges" indicator determines whether the trend is rising or falling. It is suitable for any time frame (tested on DAX).
The indicator should be treated like Bollinger Bands, meaning that if it breaks out upwards, you can buy with a stop loss below the lower edge.
Find a trending pair, index or CFD. Additionally :
-Sound alert on trend change.
-Alert Notification
-Alert Notification on your mobile phone Check my other indicator "Trend Edges histogram"
FREE

This indicator is not only for trading but also for learning, thanks to it, you can learn to identify trend, support and resistance.
You've probably heard about the Dow trend theory, where higher highs and higher lows indicate an uptrend, and lower highs and lower lows indicate a downtrend. This indicator determines this trend based on the Dow Theory. You just need to enter a number representing the number of candles between extremes. The optimal solution is the number 3 (H1 TF), unless you
FREE

This indicator is an addition to "Trend Edges."
The "Trend Edges histogram" indicator determines whether the trend is rising or falling. It is suitable for any time frame (tested on DAX).
Find a trending pair, index or CFD. Additionally :
-Sound alert on trend change.
-Alert Notification
-Alert Notification on your mobile phone Check my other indicators.
FREE

Introducing the advanced trading tools of 2023. MTF PPAAF Model S. This is sub window version of my best trading tool : MTF Precise Price Action Arrow Filtered. Click here to learn more about MTF PPAAF . This trading tool is equipped with various powerful features : MTF = Multi Time Frame = Time Frame can be changed. On/off button. Non Repaint Arrows. Customizable parameter, color etc. Can show all time frame (ATF) crossover arrows of fast stochastic main line & fast stochastic signal line (

Just another plain Super Trend indicator.
On this one i have added another buffer (on index 2) which can be used on EA; the values is -1 to identify a bearish trend while for bullish trend the value is 1.
Here a code snippet:
int trend = ( int ) iCustom ( NULL , Timeframe, "SuperTrend" , Period , Multiplier, 2 , 1 ); It work on every timeframe.
If you need help to integrate it on your EA, don't hesitate to contact me.
FREE

QuantumAlert RSI Navigator is a free indicator available for MT4/MT5 platforms, its work is to provide "alerts" when the market is inside "overbought and oversold" regions in the form of "buy or sell" signals. This indicator comes with many customization options mentioned in the parameter section below, user can customise these parameters as needful. Join our MQL5 group , where we share important news and updates. You are also welcome to join our private channel as well, contact me for the pri
FREE

This indicator will show yesterday and today high low, very useful to understand the market sentiment. To trade within the range/ break out. Previous day low- can act as support- can used for pull back or break out Previous day high- can act as resistance- can used for pull back or break out The previous day high low breakout strategy refers to the day trading technique that provides traders with multiple opportunities to go either long or short . The main idea is to identify the trend in its m
FREE

FusionAlert StochRSI Master is an indicator available for MT4/MT5 platforms, it is a combination of RSI & Stochastic indicator which provide "alerts" when the market is inside "overbought and oversold" regions combined for both indicators, results in more precise and accurate signals to be used as a wonderful tool, in the form of "buy or sell" signals. This indicator comes with many customization options mentioned in the parameter section below, user can customise these parameters as needful. Jo
FREE

QuantumAlert Stoch Navigator is a free indicator available for MT4/MT5 platforms, its work is to provide "alerts" when the market is inside "overbought and oversold" regions in the form of "buy or sell" signals. This indicator comes with many customization options mentioned in the parameter section below, user can customise these parameters as needful. Join our MQL5 group , where we share important news and updates. You are also welcome to join our private channel as well, contact me for the p
FREE

QuantumAlert CCI Navigator is a free indicator available for MT4/MT5 platforms, its work is to provide "alerts" when the market is inside "overbought and oversold" regions in the form of "buy or sell" signals. This indicator comes with many customization options mentioned in the parameter section below, user can customise these parameters as needful. Join our MQL5 group , where we share important news and updates. You are also welcome to join our private channel as well, contact me for the pri
FREE

Default settings:XAUUSD(GOLD)M1,M5,M15 No repaint, no redraw, no recalculate Can be optimized in all pairs You can fully optimize it and apply it to your strategy You can use it alone or in addition to your strategy. Suitable for beginners You will see the trading zones and identify the most profitable points to open positions. To open an order, the price must be in the yellow zone Full entry points, 5 different take profit zones https://www.mql5.com/en/users/ummuhan/seller For your questions an

This indicator is a histogram showing the trend based on 3 different moving averages. When all averages are set in ascending order, the indicator is green, and when in descending order, it is red. If the averages do not show a trend, the color is yellow. Additionally, each average can have different settings, such as Mode MA and Price MA. You can also set an alert and receive notifications on your phone.
To enable the alert and push notification, you need to activate them first in the MT4 setti
FREE

The indicator still has a few bugs but is ready for testing.
This is my first indicator that determines entry and exit points. The entry point is based on breaking the peaks determined by a channel indicating highs and lows (invisible channels). TP1 is a probable target at which most positions can be closed. The channel determining the opening and closing of positions is based on different assumptions. The red stop loss line is determined based on lows and highs.
The stop loss can be adjusted
FREE

The risk-to-reward ratio is used for assessing the potential profit (reward) against the potential loss (risk) of a trade. Stock traders and investors use the R/R ratio to fix the price at which they'll exit the trade, irrespective of whether it generates profit or loss. A stop-loss order is generally used to exit the position in case it starts moving in an opposite direction to what a trader anticipated.
The relationship between the risk and reward helps determine whether the potent
FREE

The Cossover MA Histogram indicator is a simple tool showing the trend based on crossover of moving averages. Simply specify two mobving averages and addicional parameters like MA method and Applied price. When fast MA is above slow MA the histogram is green, indicating an uptrend. When MA fast is below MA slow the histogram is red, indicating an downtrend.
FREE
WONNFX iSTATS - information indicator showing profit/loss on your MT4 account (pips, lots, currency, percentage) current profit profit for today profits for the current week profits for the current month profit for the current quarter profit for the current year
A convenient format for displaying statistics of your trading account in real time. (the indicator can be installed on any MT4 terminal chart)
FREE

Are you searching for a tool that can uncover hidden market imbalances and guide your trading decisions? Look no further than the Fair Value Gap Indicator. This powerful tool acts as a magnet, pulling the price back to its starting point before making a move. By identifying these gaps on charts, you can take advantage of bearish bias trades and predict potential future price movements with greater accuracy. Created by a three-candle sequence, the Fair Value Gap Indicator is suitable for both bul

The “ Ticks Overcome Signal ” indicator, as outlined in your provided code, is a custom tool designed for use with MetaTrader 4 (MT4), a popular platform for Forex trading. This indicator seems to focus on tracking the momentum and direction of price movements by counting consecutive up and down ticks. Here’s an overview of the psychological aspects, logic benefits, and usage instructions for this indicator on MT4: Decision Support : Traders often face psychological challenges in decision-making
FREE

IX Power 终于将 FX Power 的无与伦比的精确性带到了非外汇交易符号中。
它能准确判断您喜爱的指数、股票、商品、ETF 甚至加密货币的短期、中期和长期趋势强度。
您可以 分析 终端提供的 一切 。试试吧,体验一下您在交易时如何把握 时机 。
IX Power 主要功能
100% 精确的非重绘计算结果 - 适用于您终端中的所有交易符号 下拉式选择预配置以及可单独配置的强度分析周期 通过电子邮件、消息和手机通知的无数种通知选项
可访问的 EA 请求缓冲区 可自定义计算限制,以获得更好的性能
为希望查看更多信息的用户提供特殊的多实例设置 无尽的图形设置,让您在每个图表中都能找到最喜欢的颜色
采用 Windows 11 和 macOS 风格的圆角新面板设计
神奇的移动指标面板,可在子窗口和主图表之间无缝移动 适用于高分辨率 QHD、UHD 和 4K 显示器,并针对平板电脑和触摸屏进行了优化
IX Power 参数 最重要的参数不言自明,但我们很快会在另一篇文章中为您提供所有 IX Power 参数的完整说明。
使用别名 "参数可为技术交易

如果您在TradingView上使用Inside Bar,在那里发现内部柱轻松且令人愉悦,但在MQL市场找不到它 - 您的搜索到此结束。 InsideBar Highlight为什么? 简单易懂:内部柱变得简单。我们的工具专注于蜡烛本体,让您看到重要的部分,没有任何麻烦。 您的风格,您的选择:喜欢五颜六色还是全部相同?由您决定。轻松发现上升或下降的动态。 贴心适配:我们的突出显示不仅仅是为了好看。它完美适应每根蜡烛,使您的图表清晰易读。 援助之手: 如果您遇到任何困难或对使用我们的工具有疑问,我们在这里为您提供帮助。欢迎您的留言,我们将竭诚为您提供所需的任何帮助。InsideBar Highlight 4不仅仅是一个工具; 它是一个支持性的社区,您的问题和经验都很重要。
FREE
这是一个简单的VWAP,但我们加入了通知功能,当价格触及或穿过VWAP线时进行通知。 这是MetaTrader 4(MT4)的传统VWAP指标。 默认参数与常规VWAP相同,但您可以修改VWAP的计算,最好的是: 当价格触及或穿越VWAP时,您将通过警报、手机通知、电子邮件或声音事件得知。 MetaTrader 4的锚定VWAP指标 。 参数: VWAP周期 VWAP在一定时间范围内进行计算。传统的VWAP每天开始一次新的分析,但在这个指标中,除了有这个选项作为默认设置外,您还可以选择要用于计算VWAP的所需周期。这意味着,即使在M1的时间框架上进行操作,也可以查看H1的VWAP计算,每次在H1时间框架上的新条形图后更新。该计算的重新启动取决于您选择的时间周期。 然而,目前无需担心,因为默认参数已根据传统VWAP进行设置。只需下载此VWAP指标并将其添加到您的MetaTrader 5(MT5)图表中。 价格类型 VWAP的默认计算使用收盘价格(Close),这对应于简单VWAP的传统方法。然而,您可以选择不同类型的价格来进行VWAP的计算。可选的类型包括: Close Open Hig
FREE

此代码最初由 LuxAlgo 以其他编程语言发布。
它具有可接受的趋势预测能力,可用于多种交易目的。以下是代码生成器的一些说明:
该指标以之前发布的 Nadaraya-Watson 平滑器为基础。在这里,我们创建了一个基于核平滑的包络指标,并集成了价格和包络极值之间交叉的警报。与 Nadaraya-Watson 估计器不同,该指标采用逆向方法。
请注意,默认情况下,该指标可能会重新绘制。用户可以使用设置中提供的非重绘平滑方法。三角形标签的设计使该指标在实时应用中仍然有用。 在测试仪上进行回测时,请等待第一根 500 点蜡烛线通过,这是测试仪对指标使用以前历史数据计算参数的限制。 -----------------------------------

二元期权和外汇"公路利润"的指标是基于在通道线后面找到价格的原则。 价格离开通道并逐渐开始回到通道后,信号就会出现。 交易这样的指标非常容易和方便。 即使是新手交易者或具有多年经验的交易者也可以交易它。
您需要为每个资产选择自己的设置。 例如,在变量"A_Period"中设置的计算趋势柱的周期。 趋势由通道中的中线指示。 绿色意味着购买,红色意味着销售。
您还需要在不同的交易时段调整通道宽度,这是在"范围"变量中设置的。 其中的数字值越高,通道越宽。
那么,在较低的变量中,您可以选择您方便的箭头和线条参数。 厚度,箭头与条形的距离,它们的代码和颜色。
箭头不是实时绘制的。 他们不会从一个酒吧跳到另一个酒吧然后消失。 但是在切换时间戳之后,它们会更改它们的值。..
祝大家好运!!!

ADX MA: The Ultimate Trend Strength Guide
In forex trading, the Average Directional Index (ADX) is a vital indicator for gauging trend strength. Here's a streamlined approach to using ADX for effective trading:
1. Add ADX to your forex chart. 2. Interpret ADX values: <20 is weak, >40 is strong. 3. Identify trend direction: +DI above -DI indicates an upward trend, and vice versa. 4. Execute trades based on ADX and trend: Strong up trend, consider buying; strong down trend, consider selling;

Level Breakout Indicator is a technical analysis product that works from upper and lower boundaries, which can determine the direction of the trend. Works on candle 0 without redrawing or delays.
In its work, it uses a system of different indicators, the parameters of which have already been configured and combined into a single parameter - “ Scale ”, which performs gradation of periods.
The indicator is easy to use, does not require any calculations, using a single parameter you need to selec
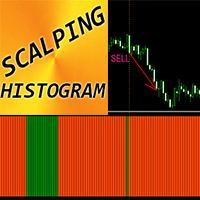
MT4 外汇指标“剥头皮直方图”
倒卖直方图指标可用于在小幅价格调整后寻找进入主方向价格动量的入场信号 倒卖直方图有两种颜色:橙色表示看跌动量,绿色表示看涨动量。 一旦您看到至少 10 个相同颜色的连续直方图条,就意味着出现了强劲的势头 入场信号是直方图中具有相反颜色的一列,下一列具有初始动量颜色(参见图片) 使用倒卖目标 - 图表上最接近的高点/低点 指示器内置移动和 PC 警报 如何使用指标: - 对于买入信号:至少 10 个连续的绿色直方图条(动量)+ 直方图上的 1 个橙色条(修正)+1 个绿色条(在此处打开多头交易) - 对于卖出信号:至少 10 个连续的橙色直方图条(动量)+ 直方图上的 1 个绿色条(修正)+1 个橙色条(在此处打开空头交易)
// 这里提供更多优秀的 EA 交易和指标: https://www.mql5.com/en/users/def1380/seller 它是仅在该 MQL5 网站上提供的原创产品。

Indicator is converted from another programming language code by programmer " sbtnc ". MQL version is simplified to be more useful by less settings complexity. There is some clues from programmer about indicator: The indicator tracks and reports the percentage of occurrence of daily tops and bottoms by the time of the day. At certain times during the trading day, the market reverses and marks the high or low of the day. Tops and bottoms are vital when entering a trade, as they will decide if y
FREE

up down stars indicator is no repaint indicator. it hold long way to signals. suitable all pairs and all timeframes. it needs at least 1000 bars on charts. 1 is critical level for signals. if red line reach 1 it gives red star to sell.. if blue line reach 1 it gives blue star to buy.. signals comes mostly exact time. sometimes lower timeframes it makes consecutive signals.

Introducing ISIS SCALPER for MetaTrader 4: Innovation Beyond the Traditional! Discover the future of trading strategies with our innovative indicator, carefully designed to transcend the limitations of conventional products. This is not just another indicator, but a flexible and powerful tool that empowers traders to explore the full potential of the market. Exceptional Features: Unlimited Versatility: Designed to adapt to any asset and time frame, our indicator allows you to create custom strat

TREND HARMONY MT4 – Multi Timeframe Trend and Phase and Pullback Level Visualizer indicator for Metatrader4 The TREND HARMONY indicator automates deep trend analysis and generates visualizations for you. Take control of your trades by eliminating uncertainty! Revolutionize your trading experience with precision and insight through the TREND HARMONY Multi Timeframe Trend Indicator – your ultimate MT4 trend visualization indicator. Are you tired of missing trading opportunities or consistently e
Всем добрый день, Это Вадим Сергеевич Лепехо. Выложил на общее обозрение очередной свой продукт(индикатор). Индикатор прост. В этом индикаторе я добавил формулу расчета точек входа. Сам индикатор я скачал в бесплатных индикаторах в mql mt4: arrows_template(шаблон стрелок). В свойствах, описании индикатора я указал имя автора. Суть индикатора рисует стрелки, знаки куда ходить, что делать и т.д...... Стратегия входа построена на пересечении двух 'машек' (MA) с разными периодами, объем, parabolic s

This automated AK Edge Scalping Indicator can be employed to oversee trades and identify optimal entry points for all time frames and both buying and selling when the price starts trending upwards or downwards. It is designed to recognize zones for Sell/Buy trades by utilizing the Moving Average and the MACD. Additionally, it incorporates the Average True Value to fine-tune the Stop Loss and the Take Profit. It can be effectively used in conjunction with other strategies to facilitate prompt en
FREE

With the Trend and News indicator you will always be up to date!
Tells you in which direction it is safer to open positions 3 in 1: trends + news + news influence index
news for the selected period actual trends for five timeframes (M5, M15, H1, H4, D1 by default)
news impact index calculated by assessing the actual values of published news
News Displayed on the chart as vertical lines with a description in the form of a tooltip The text displays two news: the previous published and the ne

Arrow signal indicator for scalping Has three sensitivity levels
Quickly detects changes in price direction and provides signals to open positions Equipped with built-in audio and visual alerts about trend changes. Can send notifications to a smartphone or email. Works on all timeframes, all currency pairs, metals, indices and cryptocurrencies. Can be used when working with binary options.
Distinctive features Does not redraw; Three sensitivity options; Three types of alerts; Simple and cl

Всем добрый день, Это Вадим Сергеевич Лепехо. Выложил на общее обозрение очередной свой продукт(индикатор). Индикатор прост. В этом индикаторе я добавил формулу расчета точек входа. Сам индикатор я скачал в бесплатных индикаторах в mql mt4: arrows_template(шаблон стрелок). В свойствах, описании индикатора я указал имя автора. Суть индикатора рисует стрелки, знаки куда ходить, что делать и т.д...... Стратегия входа построена на пересечении двух 'машек' (MA) с разными периодами. Данный индикатор н
FREE

A powerful trend analysis tool for traders of all levels Super Trend Analyzer is a technical analysis tool that uses the Relative Strength Index (RSI) and Moving Average (MA) indicators to identify trends in the market. It is a versatile tool that can be used by traders of all levels of experience.
How does it work An uptrend begins when the main trend line and the auxiliary trend line cross from below and the lower minor oscillator is on the rise. A downtrend begins when the main trend line a
FREE

You've probably heard about the Dow trend Theory, where higher highs and lows indicate an uptrend, and lower highs and lows indicate a downtrend. This indicator determines this trend based on the Dow Theory. You just need to enter a number representing the number of candles between extremes. The optimal solution is the number 3, unless you want to have the trend from M5 but you're on M1, then you need to multiply this number by 5. Check various combinations to trade with the trend. In the scree
FREE

The Finding Average Volume indicator for MetaTrader 4 is a technical analysis tool that calculates the average volume of swing bars. Swing bars are a type of price chart pattern that identifies potential turning points in the market. The indicator is displayed as a zigzag trend line that is bounded by two vertical lines. The average volume is calculated for the entire swing bar pattern. Benefits of Using the Finding Average Volume Indicator Identify potential trend changes: The Finding Average

Всем добрый день, Это Вадим Сергеевич Лепехо. Выложил на общее обозрение очередной свой продукт(индикатор). Индикатор прост. В этом индикаторе я добавил формулу расчета точек входа. Сам индикатор я скачал в бесплатных индикаторах в mql mt4: arrows_template(шаблон стрелок). В свойствах, описании индикатора я указал имя автора. Суть индикатора рисует стрелки, знаки куда ходить, что делать и т.д...... Стратегия входа построена на пересечении двух 'машек' (MA) с разными периодами + обьемы. Данный ин
Всем добрый день, Это Вадим Сергеевич Лепехо. Выложил на общее обозрение очередной свой продукт(индикатор). Индикатор прост. В этом индикаторе я добавил формулу расчета точек входа. Сам индикатор я скачал в бесплатных индикаторах в mql mt4: arrows_template(шаблон стрелок). В свойствах, описании индикатора я указал имя автора. Суть индикатора рисует стрелки, знаки куда ходить, что делать и т.д...... Стратегия входа построена на пересечении двух 'машек' (MA) с разными периодами, объемы, parabolic

Всем добрый день, Это Вадим Сергеевич Лепехо. Выложил на общее обозрение очередной свой продукт(индикатор). Индикатор прост. В этом индикаторе я добавил формулу расчета точек входа. Сам индикатор я скачал в бесплатных индикаторах в mql mt4: arrows_template(шаблон стрелок). В свойствах, описании индикатора я указал имя автора. Суть индикатора рисует стрелки, знаки куда ходить, что делать и т.д...... Стратегия входа построена на пересечении двух 'машек' (MA) с разными периодами? объемы, parabolic

Pivots Indicator Traders have been using this indicator for a long time, but the main difference or might better call it betterment applied to well known pivots indicator is that you can change how the pivot can be illustrated. There are two ways to get the pivots on the chart. you can use either number of candles or the movement of the market using points of retracement. you can find out more on the video. furthermore pivots lines can be drawn to see the possible support and resistance prices w

Overview Automated smart money market structure identification following smart money concept and inner circle trader concept, it gives an unprecedented edge on your smart money and market structure analysis by automatically identifies valid market structure using smart money concept: Identify impulsive and corrective moves Identify valid pullbacks built by impulsive and corrective market moves Idenitfy bearish or bullish leg and their inducements for smart money concept Identify valid market st

The Starting Points indicator for MetaTrader 4 is a technical analysis tool that shows the monthly, weekly, and daily starting points, as well as the 1000-point and 500-point levels, in the forex market. The indicator is displayed as a series of horizontal lines that represent the starting points and levels. Benefits of Using the Starting Points Indicator Identify potential trend changes: The Starting Points indicator can help traders identify potential trend changes by highlighting areas wher
FREE
Oscillators and Volatility: Oscillators like RSI and Stochastic are particularly useful in assessing the market sentiment and potential turning points in volatility. However, it's essential to use them in conjunction with other indicators and analyses for a comprehensive view. Divergences between price movements and oscillator readings can be powerful signals. For example, if a volatility index is making new highs, but the oscillator fails to confirm these highs, it may indicate weakening momen
FREE
学习如何在MetaTrader AppStore上购买EA交易,MetaTrader平台的应用程序商店。
MQL5.community支付系统支持通过PayPay、银行卡和热门付款系统进行交易。为更好的客户体验我们强烈建议您在购买前测试EA交易。
您错过了交易机会:
- 免费交易应用程序
- 8,000+信号可供复制
- 探索金融市场的经济新闻
注册
登录