适用于MetaTrader 4的新技术指标 - 17

CycleView is an indicator that highlights possible phases of expansion and contraction in the different time frames, it helps to highlight the correct timing to make the entry. The cycle can be changed via external settings. After installing the indicator, you can contact me by message for the best settings and time frames to use.
The indicator works by analyzing the price action. When the indicator is downloaded, you need to move the EX4 file from "Market-Expert" to "Market-indicator".

MR BEAST INDICATOR ATR SUPLIED AND DEMAND ¡Descubre la herramienta definitiva para la toma de decisiones financieras con nuestro asesor experto! Diseñado para operar en la vanguardia de los mercados globales, este asesor se destaca por su capacidad única para analizar tendencias en tiempo real utilizando el indicador Average True Range (ATR) y el equilibrio de oferta y demanda. Al aprovechar el ATR, nuestro asesor experto evalúa la volatilidad actual del mercado, proporcionándote una visión clar
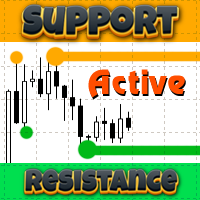
The Support Resistance Active indicator for MT4 identifies highs and lows across various timeframes, displaying support and resistance lines. Notably, previously tested highs and lows are eliminated to avoid clutter on the chart.
This indicator focuses on weekly and daily levels, termed as sell zones and buy zones. It draws support or resistance lines (fractal lines) for these zones. Tested areas are visually connected with a line, enhancing clarity on the chart.
The indicator is Multi-Time

Indicator Statistics MultiPairs for MT4 1. Current Openning Ords - Symbols Openning + Buy Orders + Buy Volume + Sell Orders +Sell Volume - DrawDown by Symbols - Floating by Symbols 2. Closed Orders - Statistics by Today, Week, Month, YTD and Volume - Sum of Closed Orders by Symbol 3. Statistics by Day - Statistics by Say and Volume 4. DrawDown by Day - Each day DrawDown in Week - Percent of DrawDown Contact me at Telegram @MaiMew68

Разворотный индикатор высчитывает все диапазоны цен за определенный период на основе исторических данных и выводит информацию ввиде уровней с цифрами,которые показывают вероятность разворота цены в процентах. Очень хорошая отработка на дневных и недельных графиках. Может применяться как отдельно для торговли,так и в связке с индикаторами уровней,разворотных паттернов,осцилляторов и скользящих средних.Работает абсолютно на всех инструментах Форекс,индексах,сырьевых товаров и акциях.

AI趨勢指標 - инновационный торговый индикатор, созданный с использованием для точного опреде ления направления тренда на финансовых рынках。 Этот индикатор предоставляет трейдерам интуитивный и информативны й на глуб оком анализе динамики цен。
Основные характеристики:
Нейронная сеть для прогнозирования тренда: AI 趨勢指標 мощную нейроннуц р ических данных。 Эта сеть способна выявлять скрытые закономерности и тенденции в движони цо гноз направл ения тренда。
Многомерный анализ: Индикатор проводит мно
FREE

本产品接收指标/信号工具的信息,在满足特定条件时显示箭头或通知。
例如,当MA25和MA50交叉、SAR反转、MACD改变正负值或收盘价穿过布林线时,都会显示箭头和通知。
具体配置请参考示例设置图。
详细手册和配置文件:
https://www.mql5.com/en/blogs/post/755082
免费版本也可供下载。
箭头可以以多种配置显示,组合方式无限,任您想象。
如果您在设置与信号工具和指标的链接时遇到困难,请联系我们寻求帮助。
我们还可以向您的智能手机、电子邮件、Slack、Line、Discord等推送通知,最多添加8个参数,或根据您的要求单独链接到指标。您可以将其用作信号工具的补充或事件的通知功能。 https://www.mql5.com/zh/users/mt4kabukimono
FREE

外汇和二元期权的箭头指示器是基于蜱数量. 与许多交易量指标不同,"超级交易量"指标计算看涨和看跌交易量,并根据其中任何一个交易量的优势给出信号。 如果,比如说,目前在这个范围内有看涨的优势,那么信号将是买入。 或者,如果占主导地位的是看跌量,那么,相应地,信号将是卖出。
在"成交量"变量的指标设置中,您可以增加或减少信号的频率。 值越高,信号越少。 默认情况下,剩下"2"。
在"HistoryBars"变量中,您可以增加历史记录上的信号数量。 默认情况下留下500。 不建议留下超过这个数字。 因为更大的数字将加载终端。
那么,在设置的最后一部分中,您可以选择更改箭头与蜡烛的距离,箭头的厚度,代码和颜色。
信号和箭头根本不画!!! 即使在改变时间框架之后。
严格建议在固定图表上的箭头后使用指标信号进行交易。 信号蜡烛关闭后,它们被彻底固定.
外汇和二元期权的指标基于MT4中的2个标准指标:ADX和RVI。
当两个指示器的线同时相交时,信号被接收。 但信号的反面也被写入代码中。 这是当信号被转换在相反的方向。 您还可以启用和禁用每个指标。 在RVI中也可以使用两种类型的信号:1)当一条线高于/低于另一条线时(这很适合用作无后坐力趋势价格走势);和2)当2条线彼此相交时。
您还可以在设置中启用内置的统计面板,其中包含有关重新计算统计信息的条数以及更新统计信息的条数后的说明。
在filter_bar变量中,您可以更改信号的类型以及相反的类型。
在alert_bar变量中,您可以设置警报将在哪个蜡烛上触发:0-在信号蜡烛上,1-在新蜡烛的打开上。
那么,在设置部分的底部,您可以更改:
1)箭头间隙-箭头从蜡烛(酒吧)的距离
2)arrow_width-箭头的大小
3)arrow_codUP和arrow_codDN-箭头代码
4)arrowa_colorUP和arrowa_colorDN是箭头的颜色。
所有的箭头和信号根本不画!!! 即使在改变时间框架。 如果箭头固定在图表上,它们不会在任
The arrow indicator for Binary Options and Forex is a reversal indicator. Created and written on the basis of reversal patterns. It is recommended for Binary Options to put it on the M5 chart. Enter into transactions for 1-3 bars. Depending on the trading sessions, you need to select your expiration time for a different asset.
You can change settings in external variables. Thus, you can both increase and decrease the frequency of signals. The arrows of the indicator do not draw at all. So yo

The arrow indicator "Anaconda LD" is a reversal indicator for the Forex market and mainly for Binary options. The algorithm is written on the basis of reversal patterns. It is better to use it together with other indicators to filter signals. Even with the standard ones in MT4, even with other custom ones. Any channel indicators or level indicators are especially suitable...
You need to select your expiration time for different assets. Which are 1-5 bars on different pairs.

如何使用倒賣指標進行交易:藍色箭頭 - 買入,紅色箭頭 - 賣出。 一切都很簡單。 此策略適用於所有貨幣對。 建議時間範圍:M5、M15、H1、H4。 交易不需要其他指標。 整個交易策略完全建立在一個交易指標「Click Scalper」之上。 這是 Metatrader4 剝頭皮指標的最新開發。 只需將指標放置在貨幣對的圖表上,然後按照箭頭方向操作即可。 如果圖表上出現紅色箭頭,則您需要開立賣出交易。 我們將止盈設定為最低,因為我們進行倒賣。 如果出現藍色箭頭,則開啟買入交易。 我們也設定了最低止盈。 止損總是會在相反方向觸發。 如果交易是買入,那麼我們將在相反方向(紅色箭頭)收到止損訊號。 如果賣出交易已打開,那麼您需要在出現藍色箭頭時將其關閉。 即使對於交易初學者來說,該策略也盡可能簡單易懂。 我們建議的最低交易餘額為 100 美元。 每次交易操作應在餘額的 2% 至 5% 之間。
如何開始交易? 從 www.mql5.com 下載 此指標將自動安裝在您的 Metatrader4 上 將指標安裝在您想要交易的任何貨幣對的圖表上 選擇建議的時間範圍之一 按照指示器指示操作。

Exclusive Arrival: Presenting for the First Time . This is your secret weapon for predicting which way the wind will blow with the next market shift. It assists you in developing your trading strategy by predicting the direction of the next candle. Compatible with forex, stocks, and cryptocurrencies on all timeframes, but higher timeframes are recommended. MT5 Version - https://www.mql5.com/en/market/product/108937/ How does it work ? It's pretty neat. The algorithm separates green and red can

indicator is no repaint trend indicator. when red stars up to line that is probably end of long trades. when blue stars up to line that is probably end of down trades. indicator can use all pairs and lower than weekly charts, to use weekly chart need to at least 500 bars data on back.and lowering processing value 500. it is also suitable for 1m charts. indicator hold long way to go. there is not too many signals.

注意️测试模式使用时: 1.为获得最接近实际使用的体验,测试模式需要使用即时价格测试,并把测试速度调到合适水平(价格跳动频繁但是K线步进缓慢)。 2.测试指标前 单击 “指标属性” -> 单击“重设” 以恢复指标默认参数。 截图内容只是冰山一角
____由于MT4的画线功能比较基础,迈达克官方也无意改进升级,但是后起之秀TradingView的出现极大拓展了画线分析部分的功能(当然TV的优势远不止于此),甚至国内的很多看盘软件的画线功能也比MT4原生的画线功能要强大。当然市面上传播的画线工具肯定也是有很多的包括五年前我写的一些相对简单的工具。但是现存的所有加起来也无法和便捷画线工具第三版相提并论,这是MT史上最强的画线工具没有之一,这是使用画线工具的朋友给出的评价。本工具初版5-6千行代码,经过一年的升级优化写到第三版已经超过2万行代码(当然空行大括号和注释的占比也不会很低估计在10-20%左右我的代码很规范 每一个变量都不会瞎命名也不会对只用得到一两次的功能单独写一个函数当然也不会在需要反复调用的时候一遍遍复制雷同代码),最终功能呈现就是本文档所见这样几十个功能改进当然有些细

ZeusArrow Smart Liquidity Finder
Smart Liquidity Finder is Ai controlled indicator based on the Idea of Your SL is My Entry. It scan and draws the major Liquidity areas on chart partitioning them with Premium and Discount Zone and allows you find the best possible trading setups and help you decide the perfect entry price to avoid getting your Stop Loss hunted . Now no more confusion about when to enter and where to enter. Benefit from this one of it's kind trading tool powered by Ai an trade
This automated VOLUME SCALPING INDICATOR can be utilized to manage trades and identify potential areas of support and resistance for both buying and selling. It is designed to identify zones for Sell/Buy trades based on the volume analysis and can be effectively used in conjunction with other indicators, such as order block indicators, and more. Currently designed for MT4, it will later be adapted to function on MT5. We also offer the opportunity to customize the robot according to your trading
FREE

Check my paid tools they work great and I share Ea's based on them for free please r ate
The Dual Timeframe RSI (Relative Strength Index) indicator is a novel trading tool that allows traders to monitor RSI readings from two different timeframes on a single chart. This dual perspective enables traders to identify potential trend confirmations and divergences more effectively. For instance, a trader might use a 1-hour RSI alongside a daily RSI to ensure that short-term trades align with the bro
FREE
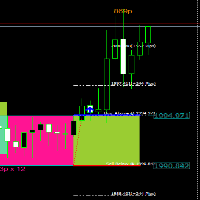
Hi All, " FCK Support Resistance BreakOut " indicator is very simple indicator for new users. You can choose which indicators and timeframes you want to calculate. " FCK Support Resistance BreakOut" that gives NON-REPAINT Buy/Sell signals "FCK Support Resistance BreakOut" provides the trend for buy/sell trades. Opposite side you the stop loss or hedging trade. * - Draws Dynamic S/R Boxes based on consolidation areas; * - consolidation areas are defined by a minimum period of time during whi

Multi Divergence Indicator for MT4 - User Guide Introduction Overview of the Multi Divergence Indicator and its capabilities in identifying divergences across multiple indicators.
Importance of divergence detection in enhancing trading strategies and decision-making.
List of Indicators RSI
CCI
MACD
STOCHASTIC
AWSOME
MFI
ACCELERATOR
OSMA
MOMENTUM
WPR( Williams %R)
RVI Indicator Features
Indicator Selection: How to enable/disable specific indicators (RSI, CCI, MACD, etc.) for diverg
FREE

ASR (Accurate Support Resistance) Indicator Uniqe formula behind this indicator makes it one the world's best support resistance indicator. watch the tutorial video
It is user-friendly and here are some key features : -- different calculations for swing traders and scalpers. -- the lower the accuracy number the further the lines distance is. --easily applicable on all charts. ( try to find the best accuracy number ) recommended accuracy number for Gold is 5or 6, for eurusd 6 or 7. other instru

For some trader's charts analysis use, specially for multi timeframe trading strategies . When you need to check something of the time within different timeframe at the same symbol chart, even different symbol charts, this indicator will show the crosshair at sync moving. You just need to load this indicator into some charts, then the crosshair will shown automatic.
FREE

This trend reversal arrow indicator has an alert signal that is a valuable tool for forex traders, providing several advantages that contribute to making more informed trading decisions and potentially increasing profits. Here are some advantages: Early Identification of Reversals: The primary advantage is the early identification of potential trend reversals. This arrow indicator can visually signal when a trend may be losing momentum or about to reverse, allowing traders to be proactive rather
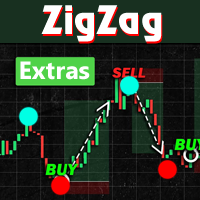
Introducing ZigZag Extras MT4, a Forex indicator that simplifies market analysis:
- Visualizes highest highs and lowest lows over a specified "Depth" period. - Highlights potential reversal points with filled blue and red dots. - Optional display of BreakOut points, indicating probable peaks and bottoms. - Helps avoid common pitfalls of mistaking repainted points for market tops or bottoms. - Designed to enhance understanding and serve as signals for various trading strategies.
Instructions
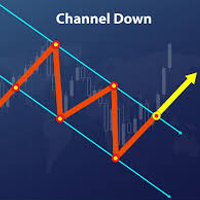
Trend channels are vital tools in technical analysis for identifying optimal buy or sell points. - Upper Line: Marks resistance. - Lower Line: Marks support. - Tops and bottoms of channels indicate potential support or resistance zones. - Bearish Channels: Negative slope (down). - Bullish Channels: Positive slope (up). Creating Channels: - Up Channel: Draw a parallel line matching the uptrend angle, touching the latest peak. - Down Channel: Draw a parallel line ma

What are Heiken Ashi Candles?
Heiken Ashi, derived from the Japanese term 'Heikin Ashi,' translates to average price bars. It's an indicator depicting price bars on a chart.
Formula for Heiken Ashi candles:
- Heiken Ashi opening price: (previous candle's opening + closing price) / 2 - Closing price Heiken Ashi: (opening + high + low + closing) / 4 - Heiken Ashi peak: Max of high, opening, or closing price - Heiken Ashi bottom price: Min of low, opening, or closing price
How to Read Heik

The MT4 Channel Standard Deviation Indicator automatically plots support and resistance channels on the price chart using price standard deviation. It indicates BULLISH and BEARISH market conditions and is suitable for both new and advanced forex traders.
This indicator offers support, resistance, entry, and exit levels, along with stop-loss and take-profit points. It accurately identifies BULLISH and BEARISH market trends, making it effective for both intraday and long-term trading across va
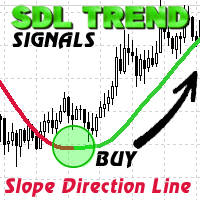
SDL Trend Signals is a custom MQL4 indicator named "Slope Direction Line" for MetaTrader 4. It employs weighted and simple moving averages to create customizable trend lines on charts.
Using two trend line buffers (Uptrend and Downtrend) and one for indicator values (ExtMapBuffer), the indicator calculates trend lines. Bullish slopes appear in BLUE, signaling an upward trend, while Bearish slopes are in RED, indicating a downward trend.
In a Bullish trend, traders can enter a BUY position w

This is a unique Gold Indicator On channel trading pullbacks and gives accurate entries on gold and major Fx Pairs on M15tf. It has the ability to pass any prop firm Challenge and get accurate entries on gold and major fx pairs.
EA FOR PROP FIRM AND CHANNEL INDICATOR IS FREE ALONG WITH THIS POWERFUL INDICATOR ALONG WITH THE BEST SET FILE FOR FIRST 25 USERS. Strategy tester report is in comment section. INDICATOR FEATURES: INDICATOR IS BEST ON M15 GIVES ACCURATE ENTRIES EA AND CHANNEL INDICAT

This indicator cuts right through the price, in a straight line
100% non repaint, you get a new value at the opening of each new bar
It is perfect for mean reversal strategies : open far from the line and close when the price touches the line It works really well for mean reverting pairs specially (CHF, NZD).
It has absolutely no lag when there is a sudden move up or down and follows trend exactly !
This indicator should be a must have tool in the toolbox of every trader

An Implied Fair Value Gap (IFVG) is a three candles imbalance formation conceptualized by ICT that is based on detecting a larger candle body & then measuring the average between the two adjacent candle shadows.
This indicator automatically detects this imbalance formation on your charts and can be extended by a user set number of bars.
The IFVG average can also be extended until a new respective IFVG is detected, serving as a support/resistance line.
Alerts for the detection of bull

Consolidation is when price is moving inside a clear trading range. When prices are consolidated it shows the market maker placing orders on both sides of the market. This is mainly due to manipulate the un informed money. This indicator automatically identifies consolidation zones and plots them on the chart. The method of determining consolidation zones is based on pivot points and ATR, ensuring precise identification. The indicator also sends alert notifications to users when a new consolida

The TLR indicator is a market trend identification indicator. The idea behind this indicator is to use 3 linear regression lines, one short-term, one medium-term, and one long-term. The UPTREND will be determined when: The long-term linear regression line and the medium-term linear regression line have an uptrend. The long-term linear regression line has an uptrend, the medium-term linear regression line has a sideway, and the short-term linear regression line has an uptrend. The DOWNTREND will
FREE

An integrated analysis system that moves the trader from the random trading stage to professional trading And seeing and understanding the market with one glance instead of moving between different charts and currencies, even in times of high liquidity
It will be easy for you to read the market with our excellent Price Action Expert signals and confirm entry opportunities With accurate analysis tools integrated into our analysis system, which we can work with on a daily basis One of the most

QualifiedEngulfing - 是 ProEngulfing 指标的免费版本 ProEngulfing - 是 Advance Engulf 指标的付费版本, 点击此处下载。 ProEngulfing 的免费版与付费版有什么区别?免费版每天只能发出一个信号。 介绍 QualifiedEngulfing - 你的专业 Engulf 模式指标,适用于 MT4 通过 QualifiedEngulfing 发挥精准性的力量,这是一款设计用于辨识和突显外汇市场中合格 Engulf 模式的前沿指标。专为 MetaTrader 4 开发,QualifiedEngulfing 提供了一种细致入微的 Engulf 模式识别方法,确保您只收到最可靠的交易信号以做出决策。 QualifiedEngulfing 的工作原理: QualifiedEngulfing 采用先进的算法分析 Engulf 模式,超越了简单的模式识别,确保模式的合格性。以下是其工作原理: 资格标准:该指标评估实体百分比相对于整个蜡烛大小的百分比,并考虑影子百分比相对于蜡烛大小的比例。这种仔细的评估确保只有高概率的 Engul
FREE

up-down indicator is no repaint and works all pairs and lower than weekly time frames charts. it is suitable also 1 m charts for all pairs. and hold long way to signal. dont gives too many signals. when red histogram cross trigger line that is up signal.and price probably will down when blue histogram cross trigger line that is down signal.and price probably will go up. when the signals not seen press + button on terminal . too see weekly chart because of low data on chart ,it needs to lower p

每售出5份副本后,价格将增加30美元。
首要指标的设计意图是为了确定整体市场趋势。这一指标引入了一套明亮和深色的色彩系统,旨在辨识市场的强势和弱势条件。通过在图表上显示不同颜色,投资者可以更清晰地了解市场的变化和趋势。 从我的观点来看,这个指标是独一无二的;在市场开始活跃时,其表现格外出色。这种独特性可能归因于其设计和算法,使其在市场波动较大时表现出色。
如果您更喜欢在较长时间范围内使用指标,例如1小时、4小时或日间时间框架,以期望获得更准确的结果,请毫不犹豫地采用这一策略。这样的时间框架可以帮助您更好地捕捉市场趋势,从而做出更明智的交易决策。
当颜色变为绿色时,它表示了一个购买机会;而当颜色变为红色时,它则表示建议开启空头头寸。这种简单而清晰的信号系统有助于投资者迅速做出决策,特别是对于那些希望在市场波动中迅速把握机会的交易者而言。
为了实现最佳效果,请考虑使用趋势货币对进行交易。这种方法基于市场趋势的理念,可以提高交易的成功概率。趋势货币对通常表现出较强的方向性,因此选择这些货币对有助于更好地利用市场趋势。
如果您在使用过程中遇到任何问题,我将随时帮助您解决

BUY INDICATOR AND GET EA FOR FREE AS A BONUS + SOME OTHER GIFTS! ITALO TRIANGLE INDICATOR is the best triangle indicator ever created, and why is that? Using Geometry and Fibonacci the Indicator works on all time-frames and assets, indicator built after 7 years of experience on forex and many other markets. You know many triangle indicators around the internet are not complete, does not help, and it's difficult to trade, but the Italo Triangle Indicator is different , the Italo Triangle Indi

「趨勢反轉ml4」是一個獨特的指標,旨在即時確定價格反轉的時刻。 這是Metatrader4現成的交易系統。 該指標不會重繪其值! 該指標基於先進的演算法和技術分析,為您提供有關可能的市場進入和退出點的清晰訊號,幫助您做出明智的決策。
此指標的優點: 訊號精度高。 指標本身向交易者顯示其配置是否正確。 在零蠟燭附近,指標繪製總計值。 如果該值為負,那麼您需要調整指標設置,如果該值為正,則表示設定選擇正確,您可以開始交易。 此指標不會重繪其值。 此指標可用於所有時間範圍和所有貨幣對。 這是一個現成的交易系統。
特點:
反轉箭頭: 紅色箭頭清楚地表明可能的開倉賣出交易點,警告即將到來的價格下跌。 藍色箭頭突出顯示了開啟買入交易的區域,表明可能出現上漲趨勢。
多時期分析: 此指標支援多個時間間隔的分析,使您能夠考慮不同時間等級的趨勢和反轉。
各種市場條件下的應用: Precision Reversal Pro 策略是基於對波動性和流動性的仔細研究,使其成為平靜和活躍市場條件下的有效工具。
設定的靈活性: 此指標可讓您根據您的喜好和交易風格自訂參數
使用方便: 輕

This automated DOJI BAR FINDER INDICATOR can be utilized to manage trades and identify potential areas of support and resistance for both buying and selling. It is designed to identify zones for Sell/Buy trades and can be effectively used in conjunction with other indicators, such as order block indicators, and more. Currently designed for MT4, it will later be adapted to function on MT5. We also offer the opportunity to customize the robot according to your trading strategy. https://t.me/FXTSPr
FREE
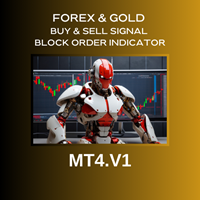
Forex and Gold OBI is an innovative indicator based on a study of price and market dynamics, utilizing the RSI indicator. This indicator helps you find the best moment to enter the forex market by signaling when the market is in overbought or oversold conditions. Moreover, The indicator calculates two possible targets and the stop loss for each trade, allowing you to optimize your risk/reward ratio. Price This indicator is easy to use and set up, working with any currency pair and timeframe. If
FREE

With this easy to set up indicator you can display and set alerts for the following candlestick formations: Bull Breakout, Bear Breakout, Hammer, Pin, Bullish Engulfing, Bearish Engulfing. I'd appreciate if you would review the indicator
Input parameters: ShortArrowColor: The color of the Arrows, displaying a Bearish candle formation LongArrowColor: The color of the Arrows displaying a Bullish candle formation BullishEngulfing: Disabled/Enabled/EnabledwithAlert BearishEngulfing: Disabled/Ena
FREE

Technically, the indicator represents the difference between two fractal adaptive moving averages. Fractal Adaptive Moving Average (FRAMA) is a smart adaptive moving average developed by John Ehlers. FRAMA takes price changes into account and closely follows the price level, remaining straight during price fluctuations. FRAMA takes advantage of the fact that markets are fractal and dynamically adjusts the lookback period based on this fractal geometry. The indicator has the ability to send notif

Pivot, support and resistance levels are one of the main indicators on the charts of any professional trader. The PivotPointsMT4 indicator will help you determine the current entry points on any currency pair and any timeframe. It is convenient because it shows historical pivot, support and resistance levels on all timeframes, and you always see what worked in the recent past. Taking into account the news context, most often it is not so difficult to determine the current level and right entry

SX Currency Strength indicator allows users to analyze currency strength through a selected period, with results resetting periodically and accumulating thereafter. It displays the historical relative strength of eight major currencies (USD, EUR, GBP, JPY, AUD, CHF, CAD and NZD) across a selected timeframe. Assessing a currency's relative strength aids in evaluating its performance against a basket of other currencies. Users can select to visualize relative strength of the currencies in the shap

ICT Kill zone and Macros Indicator mark and display the following zone times on the chart: Kill zones Kill zone Forex Asian
London Open New York Open London Close Central Bank Dealing range
Kill zone Indices Asian London Open New York AM New York Lunch New York PM Power Hour
Macros London 1 London 2 New York Am 1 New York AM 2 New York Lunch New York PM 1 New York PM 2
Silver bullet London Open New York AM New York PM
Sessions Asian London New York
Chart The display of Kill zone ,

In Forex trading, understanding support and resistance is crucial. Virtually every trading strategy incorporates these levels.
MetaTrader lacks built-in support and resistance calculation features, but there's a solution— the Support and Resistance Lines indicator.
This powerful MetaTrader indicator automatically calculates and displays support and resistance levels for any chosen currency pair or trading instrument.
Benefits of the Support and Resistance Lines indicator:
1. Identify be

This pass-band oscillator reduces lag in market data by filtering out high and low frequencies. It uses two EMAs (Exponential Moving Averages) with periods of 40 and 60.
Trigger points are added using an RMS cyclic envelope over the Signal line. The pass-band waveform output is calculated by summing its square over the last 50 bars and taking the square root to create trigger levels.
Buy when the pass-band crosses above its -RMS line and short when it crosses below the RMS line. The indicat
Доброго времени суток уважаемые трейдеры и инвесторы.
Вашему вниманию предлагается индикатор, определяющий за любой промежуток времени : Максимальную цену. Минимальную цену. 50 % от от максимума до минимума. Цену закрытия периода. Кроме того, в зависимости от настроек - индикатор может добавлять 10 процентных уровней как вниз, так и вверх, эти уровни указываются, но по стандарту начинаются от 50% с шагом 50% до 500%. В обе стороны. Индикатор реализован максимально удобно, при смене тайм-фрейма

The Waddah Attar Explosion (WAE) indicator is a potent tool in Forex trading, offering buy, sell, exit buy, and exit sell signals. It assesses trends as trend power and momentum as explosion power.
Trend Direction: - Green bars indicate a bullish trend. - Red bars indicate a bearish trend.
Signal Line: - A line serves as a threshold for momentum.
Buy Trade Setup: **Entry:** Go long when a green bar crosses above the threshold. Place a stop loss below the entry candle. **Exit:** Close the

In MetaTrader, TP & SL values aren't visible when hovering over corresponding lines. Our indicator fixes this by showing values on-screen. It displays defined SL and TP values in your account currency, facilitating easy tracking of positions. Note : The indicator estimates values, excluding commissions, and allows customization of colors and distance from SL/TP lines.

SURE REVERSAL is a histogram overbought/oversold type indicator that gives key reversal points that indicates a bull or bear market movment this indicator is fusion between moving average and the rsi indicator ,this indicator is non repainter , and is not delayed . Parameters : Ma period Ma Method Ma Price Sure Period (Rsi) Sure Price (Rsi) ==============

ENIGMERA:市场核心 https://www.enigmera.com
简介 该指标和交易系统是金融市场的一种非凡方法。ENIGMERA 利用分形周期精确计算支撑位和阻力位。它能显示真实的累积阶段,并给出方向和目标。 该系统无论在趋势中还是在修正中都能发挥作用。
它是如何运行的? ENIGMERA 由三条线组成:支撑/阻力线、目标线和偏离线。与一般市场指标将过去的数据推断为现在和未来的情况不同,该系统能提供当前的完整情况。如果你处于支撑位,这意味着真正的支撑;如果你处于阻力位,这意味着真正的阻力。如果突破某一水平,则表示趋势发生变化。没有重绘。
由于市场在不断变化,ENIGMERA 不断调整其评估工具,定期修改策略。 这保证了每种情况都能得到全面评估。这一市场指标的独特性显而易见,其能力不言而喻。
ENIGMERA 为金融分析师和咨询师提供服务,他们需要可靠的见解与客户分享,也为投资者提供服务,他们需要最精确和最可靠的保证。 该系统能够达到最佳精度,使交易者能够自信、清晰地评估他们的选择。
ENIGMERA 将 20 年的交易专长和知识整合到一个综合软件

- Real price is 80$ - 40% Discount ( It is 49$ now ) Contact me for instruction, add group and any questions! Related EA Product: Bitcoin Expert Introduction The breakout and retest strategy is traded support and resistance levels. it involves price breaking through a previous level. The break and retest strategy is designed to help traders do two main things, the first is to avoid false breakouts. Many false breakouts start with a candlestick that breaks out of a level but ends with an immedi
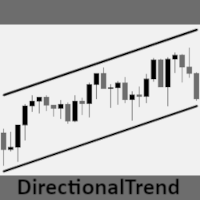
DirectionalTrend 交易指标是一种创新工具,旨在提供清晰准确的金融市场趋势视图。该指标以历史市场数据为基础,可识别并显示特定时间段内市场的总体走向。其主要目的是通过提供有关市场主导趋势的明确信号,帮助交易者做出明智决策。该指标采用直观的界面设计,易于理解和使用,适合各种经验水平的交易者。信号清晰地显示在图表上,便于做出明智的决定。交易者可以多种方式使用 DirectionalTrend,如确认进场和出场信号、识别趋势反转点以及设置止损和止盈水平。通过将该工具整合到技术分析中,交易者可以做出更明智的决策,提高市场盈利能力。该指标的用户界面直观易用,适合各种经验水平的交易者使用。其简洁明了的设计可让用户即时了解市场趋势。
参数 趋势、 颜色、线条粗细和默认颜色
FREE
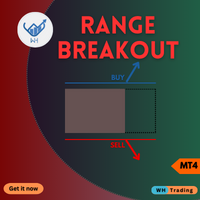

Black horse 指标的目标是找出价格走势与VWAP指标之间的背离。它使用过滤器来排除许多虚假的背离,提供高质量、准确的信号。
红色点位于蜡烛上方,表示看跌的背离,而绿色点位于蜡烛下方,表示看涨的背离。
背离的主要过滤器聚焦在ATR(平均真实范围)和过去蜡烛的价格变动,直到回顾期结束。当回顾期内的价格变动足够急剧,超过ATR倍数乘以ATR时,将确定存在背离。
由于计算的特性,在处理较高时间框架时,建议将ATR倍数和回顾期设置得较低。在较高的时间框架上,价格波动往往更为平滑,例如15分钟图表,急剧的价格波动发生的频率较低,通常包含在较少的蜡烛中,而这些蜡烛通常出现在较低的时间框架上。较不波动的股票,如HSBC,也应使用较低的ATR倍数和较短的回顾期。
在“视觉设置”下,您可以更改VWAP线的颜色,显示交替的VWAP颜色,调整背离信号的大小,并显示或隐藏VWAP线。
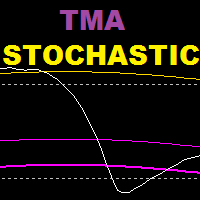
TMA 随机指标是一个基于随机震荡指标和 tma 波段指标的指标,该指标基于反转策略。
建议时间范围:15岁及以上
推荐设置:剥头皮交易的值较低,波段交易的值较高
=================================================== =====================
参数 :
tma 历史:返回多少条柱线来显示随机指标上的 tma 波段
K 周期(随机)
D 期(随机) S 期(随机) TMA期
TMA转变
极端tma偏差:远带的偏差
tma偏差:内带偏差 ----------------------------------------------------------------------------

Candle Power Signals is a trend indicator that uses a strategy of searching for potential volatile signals to make trading decisions.
By analyzing the market, the indicator identifies zones of increased and decreased volatility within the directional trend movement.
The main signal generation parameters have already been configured, the remaining settings and periods are indexed into 2 parameters for manual configuration:
1. "Candle calculation method" - 2 signal generation modes, it is rec

标题:“Daotradingfx - 7年经验的波浪交易的完美关键”
外汇交易永远不是一件容易的事情,但通过daotradingfx指标,我找到了一个可靠的伙伴,为波浪交易打开了成功之门。建立在我七年的交易经验基础上,这个指标不仅仅是一个工具,更是市场理解和交易便利性的全面画布。
Daotradingfx以使用多个时间框架的能力而脱颖而出,这是一个关键功能,帮助我更深入地理解市场趋势和来自不同角度的市场动态。同时监控多个时间框架使我能够做出更准确的交易决策,提高任何策略成功的可能性。
Daotradingfx的另一个显着优势是其在跟踪多个货币对方面的灵活性。这种多样化不仅使我能够专注于多个货币对,而且扩大了市场观察范围,增加了发现交易机会的潜力。
特别是,daotradingfx非常适合波浪交易,在这种交易中,我可以利用短期波动来获取利润。多时间框架的功能是在趋势之间灵活转变的关键,帮助我抓住机会并避免不必要的风险。
Daotradingfx易于使用的特性不仅限于其功能;它还在于其易用性。即使对于初学者来说,适应这个指标的界面也是一种便利的体验。它的简单性不会降低
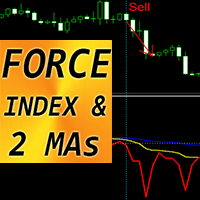
MT4 的外汇指标“FORCE 指数和 2 条移动平均线”
该指标非常适合趋势方向的动量交易。 “力量指数和 2 条移动平均线”指标可让您查看力量指数的快速和慢速移动平均线 力量指数是将价格和成交量数据结合成单个值的顶级指标之一 力量指数本身是强大的振荡器 - 衡量用于移动价格的力量大小 指标提供了尽早看到趋势变化的机会 通过参数设置该指标非常容易,它可以在任何时间范围内使用 您可以在图片上看到买入和卖出的入场条件 ............................................................................................................. // 这里提供更多优秀的 EA 交易和指标: https://www.mql5.com/en/users/def1380/seller 它是仅在该 MQL5 网站上提供的原创产品。

- Real price is 70$ - 50% Discount ( It is 35$ now )
Contact me for instruction, any questions! Introduction The Elliott Wave in technical analysis describes price movements in the financial market that are related to changes in trader sentiment and psychology. The 5 W Pattern (Known as 3 Drives) is an Elliott Wave pattern that is formed by 5 consecutive symmetrical moves up or down. In its bullish form, the market is making 5 drives to a bottom before an uptrend forms. In a bearish 5-dri

RSI divergence indicator is a multi-timeframe and multi-symbol indicator that help us find divergences between price chart and RSI indicator. Always use the divergence indicators with other technical assets like support resistance zones, candlestick patterns and price action to have a higher possibility to find trend reversals. This indicator will identify the peaks and troughs of both price and the RSI indicator. You can adjust the parameters to adjust the strength and weakness of these peaks a
FREE

The "Yesterday High Low" indicator for the MetaTrader 4 (MT4) trading platform is a powerful tool designed to help traders identify key price levels from the previous trading day. This indicator provides a visual representation of the high prices, low prices, high/low price averages, and intermediate average levels on the chart.
Primarily used by institutional and professional traders, this indicator offers an instant view of price levels that are often considered crucial in financial markets
FREE

This indicator integrates the Bollinger Band strategy in calculation with a volume-over-MA
calculation to further narrow down "Areas of Interest" levels for a potential re-test zone to the right of the chart.
We added a Moving Average calculation for a multi-level cloud and further broke down more conditions to highlight both
volume flow crossover on the High and Extreme High MA's and also high and extreme high volume spikes on set period average
without bull\bear conditions. Original Bull
FREE
Wedge Chart Pattern Indicator - Unleash the Power of Wedge Patterns in Your Trading Embark on a journey of precision trading with the "Wedge Chart Pattern Indicator." Crafted for MetaTrader, this advanced tool is your ultimate companion for identifying wedge chart patterns, empowering you to make informed and strategic trading decisions. Whether you're a seasoned trader or just starting, this indicator simplifies the process of spotting wedge patterns, providing you with a valuable edge in the m
FREE
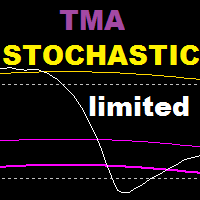
TMA Stochastic is an indicator based on stochastic oscillator and tma bands indicator , this indicator is based on a reversal strategy . Recommended time frame : 15 and above Recommended settings : lower values for scalping , higher values for swing trading WORKS ONLY ON EURUSD , GET THE FULL VERSION : https://www.mql5.com/en/market/product/108378 ======================================================================= Parameters : tma history : how many bars back to show tma bands on stochas
FREE

Symmetrical Triangle Pattern Indicator - Mastering Trend Recognition in MetaTrader Unlock the power of trend recognition with the "Symmetrical Triangle Pattern" indicator for MetaTrader. This innovative tool simplifies the identification of symmetrical triangle patterns, providing traders with clear signals for potential trend continuation or reversal. Elevate your trading strategies with this MQL offering. Key Features : Accurate Pattern Recognition : The Symmetrical Triangle Pattern Indicator
FREE
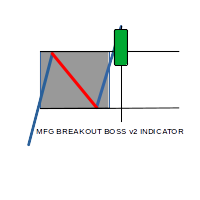
MFG breakout boss indicator is a Semi Autom ated Asian session range breakout System which seeks to identify the High and low of the asian session when the Market is ranging with no major movement, With the help of sofisticated Algorithm within the system, a breakout in either direction coupled with momentum the system gives High Accurate entries, with predefined Stop loss and 3 Take profit levels.
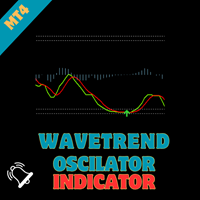
WaveTrend Oscillator - Bringing Tradingview's Renowned Indicator to MQL Elevate your trading strategies with the "WaveTrend Oscillator," an MQL port of the renowned TS/MT indicator created by Lazybear on tradingview. This powerful indicator provides valuable insights into market dynamics, offering clear signals for optimal entry and exit points in your trades.
Key Features : Proven Effectiveness : Based on the popular TS/MT indicator, the WaveTrend Oscillator brings a time-tested and proven ap
MetaTrader 市场 - 在您的交易程序端可以直接使用为交易者提供的自动交易和技术指标。
MQL5.community 支付系统 提供给MQL5.com 网站所有已注册用户用于MetaTrade服务方面的事务。您可以使用WebMoney,PayPal 或银行卡进行存取款。
您错过了交易机会:
- 免费交易应用程序
- 8,000+信号可供复制
- 探索金融市场的经济新闻
注册
登录