适用于MetaTrader 4的新技术指标 - 56

Unknown Star is a Forex indicator that performs mathematical calculations, predicting market changes and greatly facilitating the calculation of prices in the future. The mission of market indicators does not end with price predictions. It informs the trader about important changes - including the second when the price gains or exceeds the value. The work of Unknown Star frees the trader from making calculations with his own hand. The market participant can only correctly assess the indicator's

One of the main definitions for monitoring the currency market is the trend. The Trins indicator is designed to display the trend in a visual form. Trend is a stable direction of price movement. To find it, the indicator uses calculations designed to smooth out sharp fluctuations that do not affect the overall picture of price movement.
The trend can be increasing (bullish trend) and decreasing (bearish trend). In most cases, the trend is growing for a long time and drops sharply, but in all

Distinctive is a forex trending arrow indicator for identifying potential entry points. I like it, first of all, because it has a simple mechanism of work, adaptation to all time periods and trading tactics. Created on the basis of a regression channel with filters. Plotting the Lawrence indicator signals on a price function chart using a mathematical approach.
How it works - when the price breaks out in the overbought / oversold zone (channel levels), a buy or sell signal is generated. Every

Hacksaw is a trend indicator used in the Forex markets. Sharp price fluctuations are ignored, as well as noise around average prices. Signal points, where the color changes, can be used as potential market reversal points. The advantage of the indicator is its simplicity of settings and a call to action.
Naturally, do not forget that any indicator is only an assistant, and not a magic tool, by the will of which you will become fabulously rich.
Unfortunately, many novice traders forget about

The trend step indicator Cattivo analyzes the state of the market, the phase of its movement and largely determines the success of a trader in his difficult work. Cross points of the Cattivo technical indicator can be used as potential market reversal points. Thus, all intersection points will be optimal points at which the movement changes taking into account the indicator period.
Many newbies who first enter the market are often more fortunate than a professional who has spent years learnin
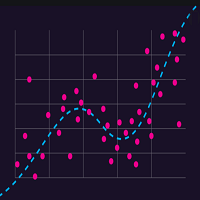
The Regression Channel consists of two lines equidistant above and below the regression trend line. The distance between the channel boundaries and the regression line is equal to the deviation of the maximum closing price from the regression line, only this definition corresponds to the most recent regression points.
The term regression refers to the field of statistics. The center line of the channel is the trend line. To calculate it, the method of least squares is used. The line above the

The Judge indicator shows potential market reversal points. The indicator shows favorable moments for entering the market. The indicator's smart algorithm detects the trend, filters out market noise and generates input signals. The indicator can be used as the main one for determining the trend. The indicator can work both for entry points and as a filter. Uses two parameters for settings. The indicator uses color signaling: blue - when changing from descending to ascending, and red - on the con

It is extremely important for any trader to correctly determine the direction and strength of the trend movement. Unfortunately, the only true solution to this problem is missing. Many traders trade at various time intervals. For this reason, the received signals are perceived subjectively.
Trend indicators provide an opportunity to classify the direction of price movement, determining its strength. Solving this problem helps investors to enter the market on time and get a good return.
The

The Investment Castle Chances indicator will show signals on the chart for entering a buy or sell trade. There are 2 types of signals for each direction as follows: Buy / Sell (Orange colored candlesticks) Strong Buy (Green colored candlesticks) / Strong Sell (Red colored candlesticks) You may place a buy trade once you see the Buy arrow or vise versa, or you might prefer to wait for a further confirmation “Strong Buy” / “Strong Sell”. This indicator works best with the high time frames H1, H
FREE

The indicator displays the signals of the RSX oscillator on the price chart. (To display these signals in a separate window, along with the oscillator, another indicator is used - RSX Osc 4 AM ). It is optimal to use the indicator signals as signals to open a trade when the price overcomes the maximum or minimum of the bar at which the signal was given. An opposite signal cancels the previous signal.
Settings: Data period for indicator calculation - data period for indicator calculation; Data
FREE
The indicator generates signals for opening positions. The principle of operation is to compare the current closing price with a range of average prices over a longer period. The signals are confirmed when the price exceeds the High/Low of the bar where the indicator generated the signal. Maintenance of an open position is carried out on a smaller TF. Indicator signals to open an opposite position on a smaller TF are a signal to close the deal. This indicator does not repaint or not recalculat
FREE
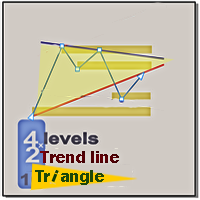
To download the one-month demo version of the indicator, refer to the following link https://s21.picofile.com/file/8445191876/L_TL_T_exp_2022_02_02.ex4 Supply and demand In all indicators that have the task of drawing support and resistance, the number of levels is so high that it causes a trader to make a mistake. We draw the last 4 important and valid levels for you using the Price Action method These surfaces are not easily broken and their breaking is done with long and powerful candlest

The principle of operation of the Channel Intellect indicator is to work inside the channel. But the parameters and width of the channel are selected in such a way that when the channel is broken and the trend moves, there will be a close in the red and these disadvantages are balanced enough, which is shown on the chart by the inscriptions near the arrows. You can see that the arrow signal does not appear every time the channel is broken. Because the indicator has a volatility filter that has

AnalizatorMTF is an oscillator indicator, a more progressive version of the indicator, with easy customization and ease of use. The following levels are used to identify signals: 0; 0.75 / -0.75; 0.9 / -0.9, as well as the configuration of the indicator curve itself. The difference from other similar indicators is in the pointers of entry points in the form of arrows of the corresponding direction and color and the possibility of displaying higher timeframes on lower ones.
The indicator can b

AnalizatorSSRC is an oscillator indicator that is easy to set up and easy to use. The following levels are used to identify signals: 0; 0.75 / -0.75; 0.9 / -0.9, as well as the configuration of the indicator curve itself.
Its main difference is the absence of a signal line and signals associated with its intersections. The indicator can be used as part of various strategies. Like other oscillators, it shows trend and flat zones, as well as oversold and overbought areas.

The Wonderful trend technical indicator is used to analyze price movements in the Forex market. It is very practical in that it forms arrows in places where buy signals appear, or, conversely, sell signals. The indicator helps to analyze the market at a selected time interval. He defines the mainstream. The Driver trend indicator makes it possible to classify the direction of price movement by determining its strength. Solving this problem helps investors enter the market on time and get a good

Contact me after payment to send you the User-Manual PDF File. This indicator gives a signal when the probability of starting a trend is high. To calculate entry points, it uses a combination of some indicators like "Moving Average", "ADX", RSI with support and resistance points. This indicator is a trend follower and it doesn't determine that TP because it is not necessary, it uses the stop-loss trailing system (Of course, the indicator determines the SL, but you have to move it yourself becau

Pro Price Trade indicator is designed for signal trading. This indicator generates trend signals. It uses many algorithms and indicators to generate this signal. It tries to generate a signal from the points with the highest trend potential. This indicator is a complete trading product. This indicator does not need any additional indicators. The indicator certainly does not repaint. The point at which the signal is given does not change. Thanks to the alert features you can get the signals

Fx Perfect Signal indicator is designed for signal trading. This indicator generates trend signals. It uses many algorithms and indicators to generate this signal. It tries to generate a signal from the points with the highest trend potential. This indicator is a complete trading product. This indicator does not need any additional indicators. The indicator certainly does not repaint. The point at which the signal is given does not change. Thanks to the alert features you can get the signals

Pro Magic Signal indicator is designed for signal trading. This indicator generates trend signals. It uses many algorithms and indicators to generate this signal. It tries to generate a signal from the points with the highest trend potential. This indicator is a complete trading product. This indicator does not need any additional indicators. The indicator certainly does not repaint. The point at which the signal is given does not change. Thanks to the alert features you can get the signals

Entry Signal Arrows indicator is designed for signal trading. This indicator generates trend signals. It uses many algorithms and indicators to generate this signal. It tries to generate a signal from the points with the highest trend potential. This indicator is a complete trading product. This indicator does not need any additional indicators. The indicator certainly does not repaint. The point at which the signal is given does not change. Thanks to the alert features you can get the sign
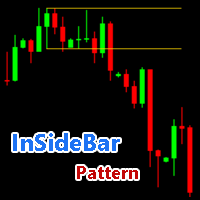
An “inside bar pattern” is a two-bar price action trading strategy in which the inside bar is smaller and within the high to low range of the prior bar, i.e. the high is lower than the previous bar’s high, and the low is higher than the previous bar’s low. Its relative position can be at the top, the middle or the bottom of the prior bar. - Find Insidebar Patterns - Support all time frames - Returns parameters ( 0 = Upper Line , 1 = Lower Line )
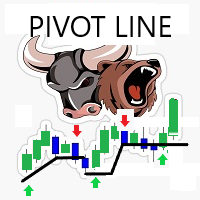
Simple smart strategy... Strategy Built on Candle patterns ... Used on any Time frame M1, M5, M30, H1, H4, D1 I prefer Higher ones like M30 and higher Used on any currencies Symbol chart and Stocks chart too No input required except the numbers of bars for drawings and the arrows UP / DOWN colors Alerts available - Can be enabled or disabled - it occur when a pivot line is crossed up / down

Advanced Entry Points indicator is designed for signal trading. This indicator generates trend signals. It uses many algorithms and indicators to generate this signal. It tries to generate a signal from the points with the highest trend potential. This indicator is a complete trading product. This indicator does not need any additional indicators. The indicator certainly does not repaint. The point at which the signal is given does not change. Thanks to the alert features you can get the s
Magic Super Signal indicator is designed for signal trading. This indicator generates trend signals. It uses many algorithms and indicators to generate this signal. It tries to generate a signal from the points with the highest trend potential. This indicator is a complete trading product. This indicator does not need any additional indicators. The indicator certainly does not repaint. The point at which the signal is given does not change. Thanks to the alert features you can get the sign

Warning: Our product works with 28 symbols. The average accuracy level of the signals is 99%. We see signals below 15 pips as unsuccessful.
Best Fx Signal indicator is designed for signal trading. This indicator generates trend signals.
It uses many algorithms and indicators to generate this signal. It tries to generate a signal from the points with the highest trend potential.
This indicator is a complete trading product. This indicator does not need any additional indicators.
The in

Auto Fibonacci Button The Fibonacci retracement is a popular and reliable technical analysis tool for traders to determine support and resistance areas. It employs the "Golden Ratio," a mathematical pattern seen throughout nature and even the universe, to forecast particular levels of support level and resistance level. This tool is generated in technical analysis by dividing the vertical distance between two extreme points on the chart (typically a peak and a low) by the important Fibonacci
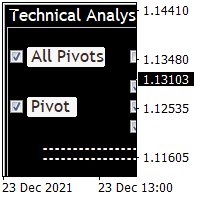
Technical Analysis 4 in 1 give you Pivot points, Resistances, Supports, Fibo, OHCL all together with any timeframe and you can back as you want in candles Pivot points have been a trading strategy for a long time. Using this method, you can understand where the market is going in a day through a few simple calculations. you can switch on/off any line you want. please check the pictures to understand more about this indicator.
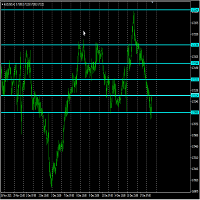
Support and Resistance technical indicator for mt4 that identifies the Strong support and resistance levels based on Zigzag indicator with full control of Zigzag indicator setting , selectable Timeframes as well as SRL lines formats .
Inputs: - Time frame. ----------------- Zigzag setting: ------------------ - Depth. - Deviation. - Backstep. -------------------- Peaks and valleys setting: - Min peaks gap in Points. // to be considered as a new level. - Peak sensitivity. // min no. of peaks

价格通道是交易者分析当前市场情况的主要工具。在它的帮助下,您可以成功预测未来的价格行为,但获利的主要因素是及时的决策。这通常是一个问题,因为根本不可能经常看显示器。
该指标自动构建和更新具有不同周期(快和慢)的两个趋势通道。趋势是使用线性回归确定的。也可以使用 1 个自定义频道,您可以自行构建。
该指标将通道划分为百分比区域。您可以指定您感兴趣的区域的百分比。当价格达到此区域时,您将收到通知。
该指标的一个有趣特征是接收背离信号 - 这是当价格处于不同时期的相反通道区域时。这是一个强烈的信号。
“shift”参数在构建通道时定义了一个小前锋。
可以使用以下类型的通知:电子邮件、推送通知、警报,以及以 wav 格式播放您选择的任何声音。

该指标在当前时间范围内构建较高时间范围的预测。以彩色蜡烛的形式进行可视化。有助于更好地了解市场中的流程及其规模和动态。所有这些都可以成为灵感的源泉,并引导您找到成功交易策略的正确途径。该指标简化了烛台形态的搜索。可以启用具有不同参数的多个指标并同时查看多个时间范围。在设置中,您可以更改每个方向的蜡烛颜色及其宽度。该指标可用作与交易顾问结合使用的工具。时间框架选项 - 必须大于当前时间框架,否则指标将无法启动并报告错误。下面的视频演示了如何在不同模式和测试仪中工作。 重要的!如果指标没有绘制任何内容,则要么是时间框架参数选择不正确(它必须大于当前参数),要么您的终端没有所选时间框架的历史记录。要加载它,只需在此时间范围内打开图表并确保所有内容都加载到所需的数量。

Please feel free to contact me if you need any further information.
Please let me know if you have any questions.
I hope the above is useful to you. MT MERIT PullBack : It is an indicator created to find pullback signals filter trend. Use a complex method to find signals.
Suitable for short-term profit, able to make profit in many cycles. Suitable for people who trade by yourself, do not use with ea (non auto trade)
manage risk management by yourself (Stop Loss,TP, Risk Reward, ...)
and

" A NEW TRADING METHOD… AN AMAZING TRADING STRATEGY! " Buy ProTrading Arrow Indicator And You Will Get Forex Trend Commander Indicator for FREE!
Like any system, there are losing signals, but you can also lock in profit from market movement. It should not be forgotten that trading is not an event, but a process. This process has no end, i.e. it should never stop completely and completely. Planning the trading strategy takes some time, but it takes much longer to implement it in practice. Pr

因为风格很重要
我知道每次都要点击属性来改变蜡烛的颜色、背景是浅色还是深色,以及放置或删除网格是多么令人厌烦。这里有一个一键式的解决方案。 三个可定制的按钮可以选择交易者想要的蜡烛样式。 一个按钮可以在白天和夜晚模式之间切换。 一个按钮可以在图表上显示或隐藏网格。 ***** 在设置中,你可以选择按钮在屏幕上的显示位置*****。 请考虑查看我的其他产品 https://www.mql5.com/en/users/javimorales.fer/seller
什么是随机RSI?
随机RSI(StochRSI)是技术分析中使用的一个指标,其范围在0和1之间(或在某些图表平台上为0和100),是通过将随机震荡器公式应用于一组相对强度指数(RSI)值而不是标准价格数据来创建的。
作者简介
Javier Morales,交易算法的创始人。
FREE

Towers - Trend indicator, shows signals, can be used with optimal risk ratio. It uses reliable algorithms in its calculations. Shows favorable moments for entering the market with arrows, that is, using the indicator is quite simple. It combines several filters to display market entry arrows on the chart. Given this circumstance, a speculator can study the history of the instrument's signals and evaluate its effectiveness. As you can see, trading with such an indicator is easy. I waited for an a

Batman is a trend indicator, a technical analysis tool that helps to determine the exact direction of the trend: either the upward or downward movement of the price of a trading currency pair. Although these indicators are a little late, they are still the most reliable signal that a trader can safely rely on. Determining the market trend is an important task for traders.
Using the Batman Forex indicator algorithm, you can quickly understand what kind of trend is currently developing in the m

The Stream indicator is based on the process of identifying the rate of change in price growth based on the intersection of two lines created according to a special algorithm and allows you to find points of entry and exit from the market. A fundamental technical indicator is used, which allows you to assess the current market situation in order to enter the market of the selected currency pair in the trend and with minimal risk. The indicator is well suited for detecting a reversal or a large s

The Catchs indicator analyzes the price behavior and if there is a temporary weakness in the trend, you can see this from the indicator readings, as in the case of a pronounced trend change. The advantage of working with the Catchs signal indicator is that the trader does not need to conduct technical analysis of the chart on his own. The tool generates ready-made signals in the form of directional arrows. It is not difficult to enter the market, but it is much more difficult to stay in it. Wit

Chinatown is one of the most interesting trend indicators. On the highs, you can get several hundred pips in one trade with the trend. The indicator shows the direction of the trend. This is an arrow tool that provides ready-made signals. If an upward trend begins, the indicator draws a blue upward arrow. At the beginning of a downtrend, the instrument shows a red down arrow.
One of the secrets of short-term trading is knowing when to enter a trade. At the same time, having the potential to e

Tired of adjusting the indicator settings, wasting precious time? Tired of the lack of confidence in their optimality? Frightened by the unknown in their profitability? Shawshank - Unique indicator for identifying trends. The new system adapts to the market, eliminates additional conditions and copes with its task. A revolutionary new way to identify the start of a trend early. The Shawshank indicator is just for you. It will save you a lot of time that can be spent on more useful activities, fo
Please feel free to contact me if you need any further information.
Please let me know if you have any questions.
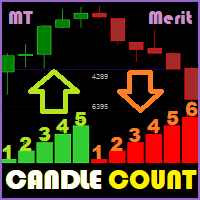
I hope the above is useful to you. MT Merit Candle Count : It is an indicator created to trade Binary option by counting the number of up or down bars candlesticks,
For to trade with other indicators to find signal open martingale or normal orders (one order),
The indicator is especially useful for experienced Martingale traders and can also be used to trade forex,
It can be
FREE

This indicator recognizes all support and resistance levels. A number of unique high-performance techniques have been applied, which made the existence of this indicator possible.
All formed channels are naturally visible: horizontal linear linear parabolic cubic (Polynomial 3 degrees - Wave) This is due to a bundle of approximating channels. The formed channels form "standing waves" in a hierarchical sequence. Thus, all support and resistance levels are visible.
All parameter management is

The Before indicator predicts the most likely short-term price movement based on complex mathematical calculations.
Most of the standard indicators commonly used in trading strategies are based on fairly simple calculations. This does not mean that there were no outstanding mathematicians in the world at the time of their creation. It is just that computers did not yet exist in those days, or their power was not enough for the sequential implementation of complex mathematical operations. Nowa
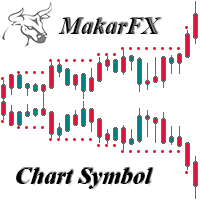
该指标创建一个带有在设置中选择的交易品种图表的子窗口 Currency pair ......... 显示指定条数的高低水平 Period resistance & support ........
可调整大小 Width resistance & support ........
显示的可用历史限制 Month limiting history / false-all available ........ 可定制颜色 Bullish candle & resistance color ........
Bearish candle & support color ........
Bars & Bid line color .......... 显示带有每根蜡烛信息的弹出窗口
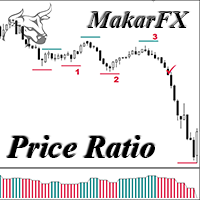
Oscillator MTF & NRP
The indicator calculates the price ratio between two timeframes
Selecting timeframes in the settings First timeframe for analysis
Second timeframe for analysis
The oscillator shows the change in the price ratio
Calculates support and resistance levels and shows them on the chart
Displays pop-up windows with the price of the current level
I found a bearish pattern for myself (fig. 1)
and a bullish pattern (fig. 2)
You can find patterns to your liking
Can
Hello, This indicator is a unique high reliability 7-in-1 multicurrency indicator comprising these sub-indicator’s: A Trend Power Crossover Indicator. A Percent Change Crossover Indicator. A Currency Overbought/Oversold Indicator. A Currency Deviation Indicator. A Currency Impulse Signal Indicator. A Trend Power Indicator. A Currency Volatility Indicator. The main advantage of this indicator is that it's reasoning by currency and not by currency pair. The values of each sub-indicator are calcul
FREE
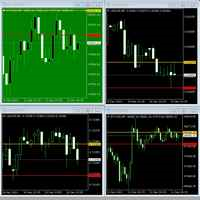
特别是如果您一次查看大量图表,您很容易错过价格走势的开始。该指标可帮助您根据汇率是否在某个范围内或离开该范围来更改图表的颜色。试想一下:例如,您有 30 个黑色图表,其中 1 个变为绿色。你一定要注意!
用法:将指标拖到图表上,设置所需的背景颜色,通过设置“向下”和“向上”线定义所需的波段。准备好!
跟着我!我定期放置新项目。
特别是如果您一次查看大量图表,您很容易错过价格走势的开始。该指标可帮助您根据汇率是否在某个范围内或离开该范围来更改图表的颜色。试想一下:例如,您有 30 个黑色图表,其中 1 个变为绿色。你一定要注意!
用法:将指标拖到图表上,设置所需的背景颜色,通过设置“向下”和“向上”线定义所需的波段。准备好!
跟着我!我定期放置新项目。
This indicator is a new version of the SuperTrend AM indicator. The indicator allows to open a position at the very beginning of the price movement. Another important feature of the indicator is the ability to follow the trend as long as possible to obtain all the potential profit while minimizing the potential losses. This indicator does not repaint or not recalculate. Signal of the indicator dot appearing above the price graph - possible start of a downtrend; dot appearing below the price grap

1.这是什么 上涨波动和下降波动是不一样的,无论是学术研究还是实际检验都说明了这一点。 原始的ATR指标是把上涨波动和下降波动放在一起进行计算。本指标则是把上涨波动和下降波动分开进行计算,这样能更好的帮助你研究市场。
2.指标说明 本指标的计算有两种模式,如下表所示: 0 1 2 3 4 5 波动方向 + - + + - + TR 15 20 17 5 16 8 原始ATR (15+20+17+5+16+8)/6=13.5 模式1 不以0填充位置,周期数改变 模式1上涨TR 15 17 5 8 模式1下跌TR 20 16 模式1上涨ATR (15+17+5+8)/4=11.25 模式1下跌ATR (20+16)/2=18 模式2 以0填充位置,周期数不变 模式2上涨TR 15 0 17 5 0 8 模式2下跌TR 0 20 0 0 16 0 模式2上涨ATR (15+0+17+5+0+8)/6=7.5 模式2下跌ATR (0+20+0+0+16+0)/6=6
如上表。比如周期为6的序列中,有4个上涨2个下跌。模式
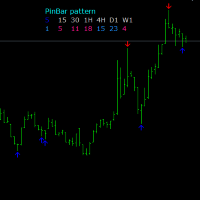
One of the Price Action patterns called PinBar is implemented in a custom indicator. Usually means a large candle with a small body and a large tail. Such candles appear at the end of a movement or candles that indicate a continuation of the trend. The peculiarity of this PinBar indicator is that it determines the pattern on all timeframes. Information output by arrows is organized for the active timeframe and additionally for timeframes H1, H4, D1.

Bonsosu attack is Binary indicator for binary option trade highly winrate and highly return ........... Design for full auto trade with bot or connetor from MT4 to Binary Broker ...____ Easy to use, No repaint,,, ___ Time frame M1 only, ..... ___ Work with 28 forex pair without martingale, ....__ Support all binary broker, .... Trading with experation .....

Bonsosu P is Binary indicator for binary option trade highly winrate and highly return ........... Design for full auto trade with bot or connetor from MT4 to Binary Broker ...____ Easy to use, No repaint,,, ___ Time frame M1 only, ..... ___ Work with 28 forex pair without martingale, ....__ Support all binary broker, ....__ Trading with experation ..... __

Bonsosu Toon is Binary indicator for binary option trade highly winrate and highly return ........... Design for full auto trade with bot or connetor from MT4 to Binary Broker ...____ Easy to use, No repaint,,, ___ Time frame M1 only, ..... ___ Work with 28 forex pair without martingale, ....__ Support all binary broker, ...._ Trading with experation .....

Bonsosu Magic is Binary indicator for binary option trade highly winrate and highly return ........... Design for full auto trade with bot or connetor from MT4 to Binary Broker ...____ Easy to use, No repaint,,, ___ Time frame M1 only, ..... ___ Work with 28 forex pair without martingale, ....__ Support all binary broker, ...._ Trading with experation .....
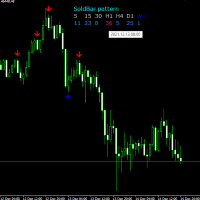
The Soldbar indicator is a price action candlestick pattern indicator. It indicates the begin or end of a trend. The information panel shows the last Soldbar of the found pattern on all time frames. When you hover the mouse arrow over an information bar, the pop-up menu shows the time of that bar. The signal of the active window is displayed by arrows, it is separately possible to turn on additional information timeframes H1, H4, D1.
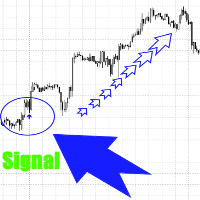
Данный индикатор не перерисовывает сигналы и это значит , что там, где он нарисует стрелку там она и останется. Сигналы рисуются здесь и сейчас, а не спустя время , когда цена прошла уже далеко.
Индикатор отлично подойдёт для трендового рынка.
Индикатор является помощником в торговле, он даёт сигнал на покупку или продажу, а вы принимаете решение использовать рекомендации индикатора или нет.
Цена на индикатор минимальна и может вырасти в любое время.
Работает на любых инструментах,т

The Bolliger Bands On-Off let you control the indicator using the keyboard or a button . You can choose if you want the indicator always shown or always hided while switching among different time frames or financial instruments . ---> This indicator is part of Combo Indicator OnOff
The Bollinger Bands identify the degree of real-time volatility for a financial instruments . A lower amplitude corresponds to a low volatility, conversely a greater bandwidth corresponds to high volatility. N
FREE

Tool converted from tradingview. A simple indicator that plots difference between 2 moving averages and depicts convergance/divergance in color coded format.
Anything <= 0 is red and shows a bearish trend whereas > 0 is green and shows bullish trend.
Adjust the input parameters as following for your preferred time frame :
4-Hr: Exponential, 15, 30
Daily: Exponential, 10, 20
Weekly: Exponential, 5, 10
FREE

Macd Trend System indicator is designed for trend and signal trading. This indicator generates trend signals. It uses many algorithms and indicators to generate this signal. It tries to generate a signal from the points with the highest trend potential. This indicator is a complete trading product. This indicator does not need any additional indicators. You can only trade with this indicator. The generated signals are displayed on the graphical screen. Thanks to the alert features you can g
Trend Signal System indicator is designed for trend and signal trading. This indicator generates trend signals. It uses many algorithms and indicators to generate this signal. It tries to generate a signal from the points with the highest trend potential. This indicator is a complete trading product. This indicator does not need any additional indicators. You can only trade with this indicator. The generated signals are displayed on the graphical screen. Thanks to the alert features you can

Signal Undefeated indicator is designed for trend and signal trading. This indicator generates trend signals. It uses many algorithms and indicators to generate this signal. It tries to generate a signal from the points with the highest trend potential. This indicator is a complete trading product. This indicator does not need any additional indicators. You can only trade with this indicator. The generated signals are displayed on the graphical screen. Thanks to the alert features you can g

Strength Dashboard is an advanced and easy to use MT4 dashboard indicator that detects and shows latest strength percentage of each currency during all 28 pairs. It's very good for trend detection and scalping trade even when the market is flat and range ,it shows each pairs which need to open order in certain direction ,when there is up trend that pair will be in Green color for buy signal and vice versa for sell signal is in Red color and then the color is in Grey ,means the market is neutral/

This Scanner will help you to get Pivot points , Resistance and Support Points on the Symbols in your watchlist, using this and the best part is it give alert in all format whether its a e-mail, or Phone Notification alert, or Pop-up Alerts. There are multiple points as : 1) Standard Pivot Points 2) Fibonacci Pivot points 3) Camarilla Pivot points 4) Woddie Pivot points. 5) Bollinger Bands.
Type of Alerts are : 1) Cross Alert. 2) Near_Alert. 3) Cross and Bounce Alert. 4) Bounce only Alert.

Stochastic Cross Arrow is an indicator that automatically places arrow when stochastic K and D line crosses each other on a certain level.
Buffer Guide For Developers: Buffer 0 =Buy Arrow Buffer 1 =Sell Arrow Inputs: ---Stochastic Settings--- %K - %K value. %D - %D value. Slowing - Slowing value . Stochistic Method - Moving Average method. It can be any of enumeration values. Newbar - arrow only appear on new bar. Buy_Msgs - type info message when buy arrow appears. Sell Msgs - type inf
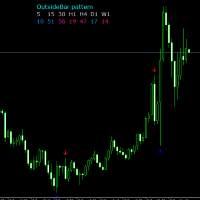
Outsidebar is an indicator of price action candlestick patterns. The following information changes in the indicator menu 1. The number of bars in history. 2. Indent of the information panel. 3.Filter by trend. 4. Turning on the arrows of the current chart. 5. Turning on the arrows of the typhreys H1, H4, D1. 6. Inclusion of alert, signal, e-mail, push notification. 7.Select a signal. 8. Arrow indent.

This simple, yet powerful indicator is very good way to determine actual S/R levels. It's main purpose is making your overview on markets much better.It has built-in arrow signal system, which should be used along with MT indicators for best results.Just try it.
Recommended MT indicators to use along:
Bollinger Bands (default) RSI (period 3, levels 10/90)

Matrix Arrow Indicator Multi Timeframe Panel MT4 是一个免费的附加组件,是您的 Matrix Arrow Indicator MT4 的重要资产。它显示了当前 Matrix Arrow Indicator MT4 信号,用于 5 个用户自定义的时间范围和总共 16 个可修改的符号/工具。用户可以选择启用/禁用 Matrix Arrow Indicator MT4 包含的 10 个标准指标中的任何一个。所有 10 个标准指标属性也是可调整的,如 Matrix Arrow Indicator MT4 。 Matrix Arrow Indicator Multi Timeframe Panel MT4 还提供了更改它所附加的当前图表的选项,方法是单击 16 个可修改符号按钮中的任何一个。这将使您能够更快地在不同符号之间工作,并且不会再次错过交易机会。
如果您想使用这个免费的 Matrix Arrow Indicator Multi Timeframe Panel MT4 插件,您需要在此处单独购买 Matrix Arrow Indicat
FREE
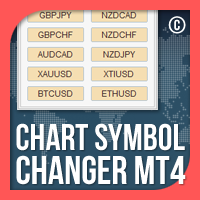
MT4 的图表符号更改器是一个指标/实用程序,它为您提供更改当前图表符号的选项,该选项通过单击其面板上的符号按钮来更改。 MT4 的图表符号转换器让您可以选择根据个人喜好配置 32 个符号按钮,方法是添加您想要密切关注和交易最多的货币对。这样您就不会错过任何机会,因为只需点击几下,您就可以在图表上更快地查看市场。
MT4 安装/用户指南的图表符号转换器 | 更新购买的产品
特征 面板上有 32 个可自定义的符号,让您可以在同一图表上监控您喜欢的工具 在任何交易品种/工具、账户类型或经纪商上顺利运行
MT4 的图表符号转换器也以交易面板的形式出现,以帮助您进行交易和风险管理以及一般的手动交易。 手动交易面板 MT4: https://www.mql5.com/en/market/product/72964
如果您对购买感到满意,我将不胜感激。 如果您不是, 请与我联系以找到解决方案 。
检查我所有的产品: https://www.mql5.com/en/users/eleanna74/seller 联系我以获得支持: https:/
FREE

移动平均线 (MA) 指标的多货币和多时间范围修改。 在仪表板上,您可以看到指标的当前状态 - 快速 MA 和慢速 MA 的突破和触及(按价格),以及 MA 线彼此之间的交叉点(移动平均线交叉)。 在参数中,您可以指定任何所需的货币和时间范围。 此外,该指标还可以发送有关价格触及线及其交叉的通知。 通过单击带有句点的单元格,将打开该符号和句点。 这是 MTF 扫描仪。您可以在图表上运行多个仪表板。
该指标在当前图表上显示快速 MA 线和慢速 MA 线。 您可以为图表选择 MA 时间范围并从其他时间范围观察 MA (MTF MA)。 两组MA的热键默认为“1”和“2”。
默认情况下,从图表中隐藏仪表板的键是“D”。
参数 Fast MA — 快速MA Averaging period — 平均周期。 Shift — 转移。 Averaging method — 平均法。 Applied price — 适用价格。
Slow MA — 慢MA Averaging period — 平均周期。 Shift — 转移。 Averaging method — 平均法。 Ap

外匯指標是一種交易系統,它在圖表上以線的形式向交易者顯示價格變動的方向。紅線表示下降趨勢運動,藍線表示上升趨勢運動。該指標適用於使用剝頭皮系統進行交易。當線為藍色且價格低於線時,我們買入。當價格上漲到線以上時關閉訂單。當線為紅色且價格高於線時,我們賣出。當價格低於線時,我們關閉交易。這是一種非常簡單的交易策略,即使是新手交易者也可以進行交易。
指標參數: period - 更改計算趨勢的周期。參數值越低,圖表上的信號就越多。參數值越高,圖表上的信號就越少。 建議: 時間範圍 M5、M30、H1 貨幣對:GBPUSD、EURUSD、XAUUSD、AUDUSD、EURJPY。 我們一次只打開一筆交易。僅當我們關閉之前的交易時,我們才會開啟新的交易。
MetaTrader市场提供了一个方便,安全的购买MetaTrader平台应用程序的场所。直接从您的程序端免费下载EA交易和指标的试用版在测试策略中进行测试。
在不同模式下测试应用程序来监视性能和为您想要使用MQL5.community支付系统的产品进行付款。
您错过了交易机会:
- 免费交易应用程序
- 8,000+信号可供复制
- 探索金融市场的经济新闻
注册
登录