适用于MetaTrader 4的新技术指标 - 102

BeST_Trend Scanner is an MT4 Indicator that uses a proprietary algorithm in order to identify the most likely levels and probable moment for an upside or a downside trending price move.
BeST_Trend Scanner is a very useful tool that defines in advance and with a high statistical percentage of accuracy the subsequent Resistance & Support Levels of the anticipated upside or downside trending move of price and so
When used at its Reverse Entries Mode :
It generates Buy or Sell arrows at the

This indicator is based on the ADX indicator and indicates the trend very easily.
You can customize the indicator to your needs: ADXPeriod ADXSignal_Level BarWidth CandleWith HeikenAshi
The Adx color candles indicator is fully FREE and compatible with the other part of the system; the Acc arrow >>>> https://www.mql5.com/en/market/product/33770 ENJOY and check out my other indicator: https://www.mql5.com/en/market/product/32111
FREE

Risklimiter
Limit your risk with this dynamic stop loss indicator. It will show you exactly where to place your initial stop & subsequent stops as the price goes in your favour. Works on any time frame as well as any symbol. It is not restricted in any way nor does it need optimisation. Simply drag and drop on to a chart for it to display a stop loss. You may find at times, it shows a stop on the other side of your trade, this will change as soon as price closes above/below it.
DOES NOT RE
FREE

The indicator allows you to trade binary options. The recommended time frame is М1 and the expiration time is 1 minutes. The indicator suitable for auto and manual trading. A possible signal is specified as a arrows above/under a candle. You should wait until the candle closes! Arrows are not re-painted Trade sessions: London and New York section Currency pairs: EUR/GRB Working time frame: M1 Expiration time: 1 minute The indicator also shows good results when using the martingale strategy - "
FREE
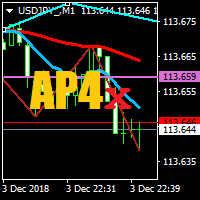
Horizontal Zone Break Alert
This indicator uses two horizontal lines, H1 and H2, to create a horizontal channel. You can move these horizontal lines anywhere on the chart in order to create your Horizontal Channel Zone, H1 must always be above H2. An alert and a notification is sent once the zone has been broken.
Alert:-
If the alert is set to true, then when a candle closes above H1 or below H2 an alert will be sent.
If the alert is set to false, then when the Moving Average moves above

Elliot's Triangle is taken from 1 of the 13 patterns within the Elliot Wave Theory that says social or crowd behaviour tends to reverse in recognisable patterns and of which they reveal a structural pattern that appears in nature, as well as the mass psychology of trading participants. From this, he has devised various identifiable patterns that appear in market prices. One of these is what I have named Elliot's Triangle.
This triangular pattern appears to reflect a balance of forces, causing
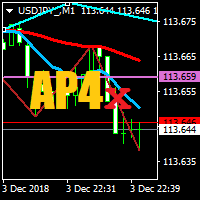
Trend Zone Break Alert
This indicator uses two trend lines, T1 and T2, to create a trend channel. You can move these trend lines anywhere on the chart in order to create your Trend Channel Zone, T1 must always be above T2.
An alert and a notification is sent once the zone has been broken.
Alert:-
If the alert is set to true, then when a candle closes above T1 or below T2 an alert will be sent.
If the alert is set to false, then when the Moving Average moves above T1 or below T2 an alert
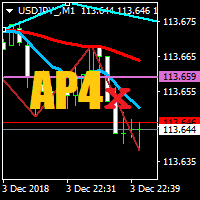
Moving Average Crossover Alert
This indicator uses two moving averages, fast MA1 and slow MA2, to indicate a change in trend or direction of movement.
You change the default MA's, one fast and one slower, to your preference.
An alert and a notification is sent once MA's cross each other. Note: you can change the default settings of the 2 moving averages.
I hope you will find this indicator very useful, as I do.

Time Bubble ***Specialized for GBPJPY 1H time frame***
(tested for two years with success rates about 82%)
Time Circle's smart algorithm detects the price circles with time . give strong signals at the right time as result of combine the price and time.
our team spent months to develop this indicator specially for GBPJPY ..with high success rates about 82% win trades over two years .tested from December 2016 to November 2018.
*** in last two years total signals 1012 with 829 Wins and

This indicator is based on the ADX indicator and gives you safe entry points.
You can customize the indicator to your needs: RISK SSP COUNTBARS
The only condition that has to be met when entering a trade is, that the arrow faces in the same direction as the Adx color candles.
Download the FREE DEMO and test it!
The Acc arrow indicator is compatible with the other part of the system; the fully FREE Adx color candles
>>>> https://www.mql5.com/en/market/product/33768
ENJOY and ch

One of the main components of successful trading is the correct determination of the direction of the market. This indicator shows the general directionality of the price movement and is painted in the corresponding color. Allows you to conduct trend and counter trend trading It works on all timeframes, on any currency pairs, metals and cryptocurrency Can be used when working with binary options
Distinctive features Does not redraw; Simple and clear settings; Works on all timeframes and symbo

BIG CANDLE ALERT https://www.mql5.com/en/users/earobotkk/seller#products P/S: If you like this indicator, please rate it with 5 stars in the review section, this will increase its popularity so that other users will be benefited from using it. This indicator draws a bullish and bearish vertical line inside a candle whenever the size of a candle body exceeds the minimum size specified in the input. INPUT Bullish Candle Color: choose the color of your choice. Bearish Candle Color: choose the co
FREE

The indicator draws the time scale on the chart. You can specify the time offset, adjust the size and font to display on the chart (it is displaying your local time on your chart instead of MT time). You can also select the desired format for displaying the date and time. While holding down the middle mouse button, and moving the cursor, a slider will appear on the scale. You may be interested in my other product , which contains a more advanced version of the Time Scale.
Parameters Hours (tim
FREE

The Advanced Trend Scalper indicator is designed to help both novices and professional traders. The indicator analyses the market and gives you buy and sell signals. It does not use any other indicators, it works only with the market actions. The signal appears right after the candle close and it does not repaint. The efficient algorithm provides a high degree of reliability of such signals. Advanced Trend Scalpe r for the MetaTrader 5 terminal : https://www.mql5.com/en/market/product/3334

BeST_Keltner Channels Variations & Strategies is an MT4 Indicator based on the original Keltner Channels Technical Analysis Indicator and it is a very useful Visual Tool that can display in the Chart all the known Variations of Keltener Channels and also the corresponding 10 totally Strategies i.e. all ENTRY signals (BUY and SELL) and also any corresponding EXIT signal, in which the Enrty and Exit Signals are derived exclusively by using Keltner Channels Variations. Every variation of K

FuturePriceM15 - один из немногих индикаторов, который делает прогноз цены прямо на ценовом графике. Алгоритм расчета индикатора основан на быстром преобразовании Фурье. Имея колебательное поведение цены, функция Фурье прогнозирует ее поведение в дальнейшем. Индикатор устанавливается обычным образом на график с торговым инструментом указанным в переменной symbol с периодом M15 , данный временной период является самым оптимальным для работы с любыми торговыми символами. После установки, индикато
FREE
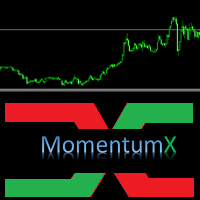
MomentumX is a great tool for traders to find possible direction change and continuation in trend. MomentumX indicator inverts momentum and is best used together with Momentum found in your MT4(See picture 2) It can be used for short term trading and mid term trading on any timeframe and instrument.
Only setting is period and color of the line.
Check out my other products: https://www.mql5.com/en/users/tkjelvik/seller#products
To spot entries, you can trade crossover between MomentumX an
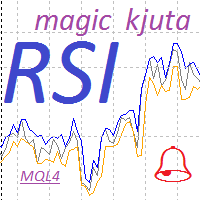
Индикатор RSI magic kjuta.
Пользовательский Индикатор ( RSI magic kjuta ) на основе стандартного Индикатора Силы ( Relative Strength Index, RSI ) с дополнительными настройками и функциями. К стандартной линии RSI добавлены линии максимального и минимального значения RSI на графике. Теперь можно визуально наблюдать прошедшие максимумы и минимумы RSI , а не только значения по закрытию баров, что позволяет избежать путаницы при анализе торгов. Например, советник открыл или закрыл ордер, но н

"Simple Daytrader" indicator is an indicator for daytrading. It calculates entry points with an own simple exit strategy.
Main features Indicator shows you when to enter the market Enter the market on candle close Indicator calculates stop loss on candle high/low No optimization needed, indicator is optimized Usable on every pair Input Parameters SLCalculation - Calculates SL-Line on high/low of the last x bars

Reverse scalper is a scalper which detects small reverse signals on every pair and timeframe. It is easy to understand for rookie and experienced traders. For correct entry wait till candle closes before entering.
Features Easy to understand Usable for every pair and timeframe How to trade Open long if histogram closes below -0.20 Open short if histogram closes above 0.20

Daedal 该指标是一种价格变动的图形分析,用于即时确定市场状态,它使您可以确定它处于状态的哪个阶段。指标绘制在下方的单独窗口中,与主图表分开。使用该指标,您可以获得有关价格变动方向可能发生变化的信息,从而获得在所需方向上开仓的可能性。 指标设置说明: bar_limit - 将指标的显示限制为一定数量的柱线,如果 = 0 则显示在所有可用的柱线上
该指标是一种价格变动的图形分析,用于即时确定市场状态,它使您可以确定它处于状态的哪个阶段。指标绘制在下方的单独窗口中,与主图表分开。使用该指标,您可以获得有关价格变动方向可能发生变化的信息,从而获得在所需方向上开仓的可能性。 指标设置说明: bar_limit - 将指标的显示限制为一定数量的柱线,如果 = 0 则显示在所有可用的柱线上

Opening positions in the direction of the trend is one of the most common trading tactics.
This indicator determines the direction of the local movement and colors the candles on the chart in the appropriate color.
Allows you to enter the transaction at the very beginning of the movement
Thanks to the flexible settings you can use on any currency pairs, metals and cryptocurrency
Can be used when working with binary options
Distinctive features Does not redraw. Additional parameters for
FREE
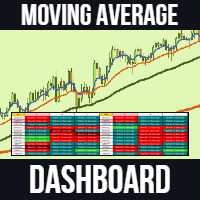
Moving Average Dashboard Pro is an improved and advanced indicator of the free version "Moving Average Crossover Bars ago Dashboard" The moving average dashboard pro gives you a dashboard view of bullish and bearish moving average crossovers. For example, if there was a bullish moving average crossover 5 sessions ago, then you would see 5 bars ago . This indicates that there was a bullish crossover 5 sessions ago. This indicator is useful if you want to catch the trend early on when using moving
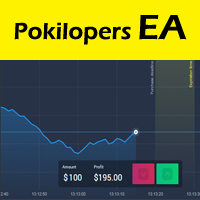
Pokilopers - the finished trading system is presented as an indicator for the Metatrader4 platform. When added to a chart, Pokilopers automatically analyzes the situation on the market, determines the direction of the trend, resistance points, the price movement channel and other market factors that affect the current and future price movements. After that, Pokilopers automatically determines the most effective point for opening a trade and gives the trader a signal in the form of an arrow. Afte

Ultimate Volatility Scanner (Multi Pair And Multi Time Frame) : ---LIMITED TIME OFFER: NEXT 25 CLIENTS ONLY ---46% OFF REGULAR PRICE AND 2 FREE BONUSES ---SEE BELOW FOR FULL DETAILS Volatility expansion and contraction is a fundamental market principle that will NEVER go away.
And some of the largest institutions in the world invest enormous amounts of capital into various
types of volatility strategies. Not only for profit driven trading strategies, but also for risk control.
VOLATI

The Average Price indicator calculates the average prices of BUY (LONG) and SELL (SHORT) open positions, taking into account the size of open positions, commissions and swaps.
The indicator builds the average line of LONG open positions, after crossing which, from the bottom up, the total profit for all LONG positions for the current instrument becomes greater than 0.
The indicator builds the average line of SHORT open positions, after crossing which, from top to bottom, the total profit f

The indicator allows you to trade binary options. The recommended time frame is М1 and the expiration time is 1 minutes. The indicator suitable for auto and manual trading. A possible signal is specified as a arrows above/under a candle. You should wait until the candle closes! Arrows are not re-painted Trade sessions: London and New York section Currency pairs: AUD/CAD Working time frame: M1 Expiration time: 1 minute The indicator also shows good results when using the martingale strategy - "Ma
FREE

What is SuperMA?
SuperMA is an advanced custom indicator converting standard moving averages into a powerful tool. With help of this tool you will be able to see any moving average from the higher chart period on any lower timeframe.
In standard MA indicator, once the user changes chart period (e.g. from daily to 1h) MT4 calculates new moving average for the 1h chart – which is completely different from the moving average for the daily chart. SuperMA makes it possible to see the exact movin

Ultimate Engulfing Bar Scanner (Multi Pair And Multi Time Frame) : ---LIMITED TIME OFFER: NEXT 25 CLIENTS ONLY ---46% OFF REGULAR PRICE AND 2 FREE BONUSES ---SEE BELOW FOR FULL DETAILS Nothing is more important than institutional price action and order flow.
And a strong engulfing candle is a clear indication that the institutions have flipped their sentiment.
Engulfing bar patterns are widely used by institutional traders around the world. As they allow you to manage
your trades with

The indicator allows you to trade binary options. The recommended time frame is М1 and the expiration time is 1 minute. The indicator suitable for auto and manual trading. A possible signal is specified as a arrows above/under a candle. You should wait until the candle closes! Arrows are not re-painted Trade sessions: TOKYO section (Half end) and LONDON section (First half) Currency pairs: EUR/USD Working time frame: M1 Expiration time: 1 minute. The indicator also shows good results when using
FREE

The indicator allows you to trade binary options. The recommended time frame is М1 and the expiration time is 1,2,3 minutes. The indicator suitable for auto and manual trading. A possible signal is specified as a arrows above/under a candle. You should wait until the candle closes! Arrows are not re-painted Trade sessions: TOKYO section (Half-end) Currency pairs: USD/JPY Working time frame: M1 Expiration time: 1,2,3 minutes. The indicator also shows good results when using the martingale strateg
FREE

The indicator allows you to trade binary options. The recommended time frame is М1 and the expiration time is 1 minute. The indicator suitable for auto and manual trading. A possible signal is specified as a arrows above/under a candle. You should wait until the candle closes! Arrows are not re-painted Trade sessions: LONDON and NEWYORK section Currency pairs: GRB/USD Working time frame: M1 Expiration time: 1 minute. The indicator also shows good results when using the martingale strategy - "Mar
FREE
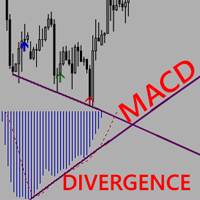
MACD Divergence with arrows complements the MACD indicator. It scans for divergence within the MACD oscillator then draws arrows on the entry points in the chart window. NB:The indicator does not bring up the MACD window nor does it draw lines on the MACD window. The screenshots are a mere description of how they work. The user will become alerted whenever a divergence is in progress and should WAIT for the perfect moment to make an entry. Perfect entries can be anything basic such as support an

Trend indicator with Multi-level Take Profit indication. Possibility to setting in normal or Aggressive mode. Fully customizable in color and alarm. Very useful to understand the trend and where price could go No need to explain, see the images. You'll se the trend, 3 possibly target and stop loss (or other take profit) when the trend change. You can adopt various strategy, for example. 1) Open trade and try to close it at target 1 2) Open 2 trade, close 1 at target 1, stop in profit for 2 and t

Индикатор очень своевременно показывает входы в рынок на любом инструменте. Каждая стрелка имеет свою ценовую составляющую, равную(как правило) значению экстремума на используемом таймфрейме, что можно использовать в качестве установки стоповых ордеров или других действий при применении индикатора в советниках. Индикатор имеет минимальное количество параметров, позволяющих без особого труда настроить его работу. Параметр Level_Open отвечает за скорость выдачи сигнала. Чем больше этот парамет

this indicator Construction on Gann angles and it,s very effective .you can use it as (Support and resistance)
it,s very successful and easy to use.if candle Cross through level thats mean price is going ti next level
but with on condition. The price cames from a previous level
There is a variable of angles for frames the best is 1h frame and stander variable.........
FREE

Door 该指标反映了市场价格动态的趋势。价格动态有三个主要趋势:向上运动、向下运动和横向价格运动。该指标有助于确定价格变动的主要方向。简单来说,它们可以让您直观地了解市场趋势。使用该指标,您可以始终按照趋势方向进行交易。此外,该指标可用于识别通道或支撑和阻力位。建议使用 M15 图表周期上的指标。 指标设置: bar_limit - 显示指标的柱数,当 = 0 时,它显示在所有可用柱上。 该指标反映了市场价格动态的趋势。价格动态有三个主要趋势:向上运动、向下运动和横向价格运动。该指标有助于确定价格变动的主要方向。简单来说,它们可以让您直观地了解市场趋势。使用该指标,您可以始终按照趋势方向进行交易。此外,该指标可用于识别通道或支撑和阻力位。建议使用 M15 图表周期上的指标。 指标设置: bar_limit - 显示指标的柱数,当 = 0 时,它显示在所有可用柱上。
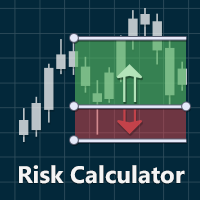
The Visual Risk Calculator is the indicator that allows calculating the risks, before placing an order.
Features:
- Calculation of potential profits and losses in points, interest and in the base currency, including the brokerage commission.
- calculation of the ratio of profit to potential loss.
- informing about the calculated levels of stop-loss and take-profit.
- the ability to drag the levels of entry into the market, stop-loss, and take-profit on the graph for preview before pl

DoAid
DoAid indicator is a simple channel indicator with an advance timeframe correlation board. DoAid indicator: can be used with any instrument provided by your broker and MetaTrader, be it Currency , Commodity ,Stock, or Cryptocurrencies.
DoAid indicator can be used for swing, scalping and day trading.
DoAid indicator is also a multi time-frame indicator {MTF}. DoAid indicator can be used with any timeframe. It does not repaint.It does not repaint.
When To Buy
if the market

1. What is Floating Nest?
This indicator is designed to automate the construction of decision zones (can act as support-resistance levels) according to the Floating Socket strategy.
The same indicator allows you to significantly reduce the time when analyzing the behavior of prices in decision areas on historical data.
It works on any currency pairs. Time frame: M1-H1.
The NEST trading system (Nest) is notable for its simplicity and efficiency when trading currencies, stocks, indice

This version of the indicator Floating Nest works only in the tester, on demo accounts and on real accounts on the USDCHF pair.
1. What is Floating Nest?
This indicator is designed to automate the construction of decision zones (can act as support-resistance levels) according to the Floating Socket strategy.
The same indicator allows you to significantly reduce the time when analyzing the behavior of prices in decision areas on historical data.
It works on any currency pairs. Time frame
FREE

SystemBinaryM1 - a professional indicator for trading short-term binary options, is a complete, self-contained author's strategy for working in the binary options market. The unique algorithm for analyzing the foreign exchange market is based on the calculation of reference points on three different time periods M15, M5. M1. Thus, the indicator simultaneously analyzes the long-term, medium-term and short-term price behavior before issuing a signal. The indicator is set in the usual way and work
LEADING AND LAGGING INDICATORS DASHBOARD https://www.mql5.com/en/users/earobotkk/seller#products P/S: If you like this indicator, please rate it with 5 stars in the review section, this will increase its popularity so that other users will be benefited from using it.
This dashboard scans all time frames(M1,M5,M15,M30,H1,H4,D1,W1,MN1) and shows up trend and down trend for MACD, PSAR, RSI, STOCHASTIC, MOVING AVERAGE, BOLLINGER BANDS by changing the colours of the relevant boxes. It also shows c
FREE

Indicator. Zones of support and resistance levels The most reliable tool in the hands of any technical analyst is support and resistance levels.It is these levels that magically work in the market, because the price then bounces off them, on the contrary, gaining maximum acceleration, punching them and striving for a new price point.However, in practice, many beginners face enormous difficulties in building them.This is due to the fact that the price may react quite differently to them, and ofte
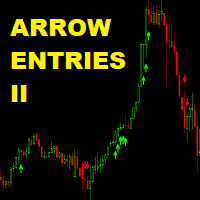
Arrow Entries II Arrow entries II indicator Arrow entries is a tool to help make entry decisions. It draws arrows for buy and sell and is based on 2 Signals and filtered by fast over or under slow Moving Average. Do not confuse this with my other indicator Arrow Entries. The rules for a signal is different. Arrow Entries II produce less signals than Arrow Entries, but are more precise Want an EA to do the job for you? Buy it here: https://www.mql5.com/en/market/product/33266 Check out my ot

Trend Line Finder will project forward a support and resistance lines using 2 previous highs for resistance and 2 previous lows for support. It will then signal to the trader by alert making the trader more aware that a possible good move is about to happen. This is not a stand-alone trading system but is very useful in finding key areas of support resistance levels where price will usually either rebound from or breakthrough. Its down to the trader to decide what to do with use of other s

Super MA Trend indicator is an indicator designed to find trends. It uses a moving average, a set of candle combinations and High/Low levels to find trends. This indicator is a complete trading system. You can trade with this indicator as you like.
Features and Recommendations You can use this indicator on all pairs except for the volatile pairs. It is recommended to use it on M15 and over graphics. The most important element in this indicator are alerts. Do not open orders unless you receive

The MTF MA Trend indicator is an advanced model of the moving average indicator. With this indicator, you can follow the moving averge inductor in the multi time frame from a single graphical display. This indicator shows 7 different time zones on a single graphical display. This display is designed in oscillator style. It is also a new generation trend indicator.
Features It can work in 7 different time zones. different color settings can be made for each time zone. each time zone has a level

This is the FXTraderariel Psychology Indicator . It calcutes a sell and buy zone according to Psychology Levels. The indicators shows also potential Take Profit Targets. Depending on the settings and trading style, it can be used for scalping or long-term trading . The indicator can be used on every time frame , but we advise to use it on H1, H4 and D1 . Especially if you are a novice trader. Pro Traders can also you use it for scalping in smaller timeframes (M1, M5 and M15). This indicator is n
The Stochastic Alerts indicator is an advanced model of the standard stochastic indicator. This indicator is different from the standard indicator 2 level warning feature has been added.
For example, the user will be able to receive warnings at levels above 80 and below 20. It can change the levels you wish. For example 60 and 40 can do. This depends on the user's discretion. you can turn the alerts on or off as desired.
Parameters Kperiod - Standard stochastic kperiod setting Dperiod - Stan
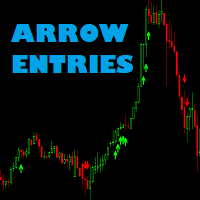
Arrow entries indicator Arrow entries is a tool to help make entry decisions. It draws arrows for buy and sell and is based on 2 MFI indicators and filtered by fast over or under slow Moving Average.
Check out my other products: https://www.mql5.com/en/users/tkjelvik/seller#products
Input variables Period MFI1: How many candels to calculate MFI1. Shift_MFI1: Candels back to be used. Period MFI2: How may candels to calculate MFI2. Shift_MFI2: Candels back to be used. Overbought/Oversold are
Real Trading Signal is an indicator that generates trade arrows. It generates trade arrows with its own algorithm. These arrows give buying and selling signals. The indicator certainly does not repaint. Can be used in all pairs. Sends a signal to the user with the alert feature.
Trade rules Enter the signal when the buy signal arrives. In order to exit from the transaction, an opposite signal must be received. It is absolutely necessary to close the operation when an opposite signal is receive
Индикатор очень своевременно показывает изменение направления рынка на любом инструменте. Более того, этот индикатор мультитаймфреймовый, что позволяет увидеть на текущем периоде графика смену направления движения рынка с более старшего таймфрейма. Стрелка вверх сигнализирует о восходящем движении, стрелка вниз - о нисходящем. Каждая стрелка имеет свою ценовую составляющую, равную(как правило) значению экстремума на используемом таймфрейме, что можно использовать в качестве установки стоповых

不同货币对的行为是相互关联的。 Visual Correlation 指标允许您在一张图表上显示不同的工具,同时保持比例。 您可以定义正相关、负相关或无相关。
有些仪器比其他仪器更早开始移动。 这样的时刻可以通过叠加图来确定。
要在图表上显示工具,请在 Symbol 字段中输入其名称。
亲爱的朋友! 我们提请您注意视觉相关性指标。 主要优点及其工作原理: 不同貨幣對的行為是相互關聯的。 Visual Correlation 指標允許您在一張圖表上顯示不同的工具,同時保持比例。 您可以定義正相關、負相關或無相關。
有些儀器比其他儀器更早開始移動。 這樣的時刻可以通過疊加圖來確定。
要在圖表上顯示工具,請在 Symbol 字段中輸入其名稱。 Version for MT5 https://www.mql5.com/zh/market/product/109155
FREE
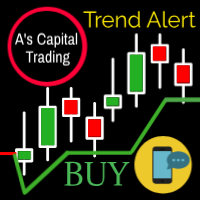
A的Capital Line 是一种复杂的算法,可以检测100%的趋势。 此行标记以下信息: 趋势的入口。 停止亏损。 支持和抵抗。 什么时候拿利润。 通过metatrader向您的手机发送提醒 它适用于任何工具(股票,外汇,加密,商品,指数等)。也可以在任何时间框架内调整任何交易风格。 请参阅屏幕截图以获取示例并在 Instagram 上关注我们。 图片1 每个符号和时间帧的线路设置不同。您必须根据符号,时间范围和交易风格调整最佳参数。 (10个周期和4个因子)(7个周期和3个因子)这是常见的设置。 显示显示,您可以打开/关闭提供的所有信息 警报和移动通知,您可以打开/关闭PC和movil通知。 显示位置,将显示放在其他位置。 您还可以更改显示字体,大小和颜色。 图2 这是所有显示元素。 图3 卖出信号的一个例子,你的风险是什么以及什么时候关闭信号。 图4 在您的PC上发出警报 图5 关于Movile的提醒。 图6 该指标适用于任何符号。 图7 As Capital Line作为抵抗运动的一个例子。

Introduction This indicator detects volume spread patterns for buy and sell opportunity. The patterns include demand and supply patterns. You might use each pattern for trading. However, these patterns are best used to detect the demand zone (=accumulation area) and supply zone (=distribution area). Demand pattern indicates generally potential buying opportunity. Supply pattern indicates generally potential selling opportunity. These are the underlying patterns rather than direct price action. T

Arrow indicator, to determine adjustments and local trends
The arrow appears on the current bar and after closing the bar will not disappear.
Allows you to enter the transaction at the very beginning of the movement
Thanks to the flexible settings you can use on any currency pairs, metals and cryptocurrency
Can be used when working with binary options
Distinctive features Does not redraw. Additional parameters for fine tuning. Works on all timeframes and symbols. Suitable for trading c

Ultimate Moving Average Scanner (Multi Pair And Multi Time Frame) : ---LIMITED TIME OFFER: NEXT 25 CLIENTS ONLY ---46% OFF REGULAR PRICE AND 2 FREE BONUSES ---SEE BELOW FOR FULL DETAILS Institutional traders use moving averages more than any other indicator. As moving averages offer a quick
and clear indication of the different phases of a trend. Such as expansion, pullback, consolidation and reversal.
And viewing the market through the same lens as the institutions is a critical part

Level Gun Pro is an indicator of the automatic construction of the levels of Ghana.
It is based on the theory Ghana, slightly modified algorithm to calculate the vibrations of the market.
The main essence of the indicator is that it takes the entire history of the trading instrument and builds horizontal levels on its basis.
Yearly, monthly and weekly.
The advantage of this indicator is that it applies levels to the chart in advance and does not adjust to its changes.
Yearly le
Introduction
This indicator marks Pin Bars (bars with an unusually long upper or lower candle wick) on your chart. It will also send alerts when one forms, including via e-mail or push notification to your phone . It's ideal for when you want to be notified of a Pin Bar set-up but don't want to have to sit in front of your chart all day.
You can configure all the settings including: What proportion of the bar should be made up of the wick How big or small the total size of the Pin Bar has

Introduction This indicator detects volume spread patterns for buy and sell opportunity. The patterns include demand and supply patterns. You might use each pattern for trading. However, these patterns are best used to detect the demand zone (=accumulation area) and supply zone (=distribution area). Demand pattern indicates generally potential buying opportunity. Supply pattern indicates generally potential selling opportunity. These are the underlying patterns rather than direct price action. T
FREE

SystemPro - a professional indicator, is a full-fledged, self-sufficient author's strategy for working in the Forex market. A unique algorithm for analyzing the foreign exchange market is based on the calculation of reference points for three different time periods. Thus, the indicator simultaneously analyzes the long-term, medium-term and short-term price behavior before issuing a signal. The indicator is set in the usual way and works with any trade symbols.
Advantages of the indicator It i

Square Dashboard is a new generation indicator that has the task of simplifying the technical analysis of the market and speeding up access to the charts. The logic of this indicator is really simple but effective, you can observe the daily, weekly and monthly opening values. The confluence of these values leads to the generation of the warning, red to identify bearish conditions, green to identify bullish conditions, while the gray color identifies the lateral condition. Having the whole market

Most of the time, market reversals / pull backs usually follow volume and price spikes thus these spikes could be the first indication of an exhaustion and possible reversal/pullback. High volume Turns is an indicator that scans the market for price and volume spikes around over-bought/over-sold market conditions. These spikes when spotted serves as the first indication of reversal/pullback.
Note : Though it seems ok now but this is a system that is still under development. We have made it p
FREE

The Hi Lo Breakout is taken from the concept of the ZZ Scalper EA which exploits the inevitable behaviour of price fluctuations and breakouts. The fact that because market prices will always fluctuate to higher highs before ebbing down to lower lows, breakouts will occur.
But here I've added a few more filters which I see work well also as an Indicator.
Range Analysis : When price is within a tight range this Indicator will be able to spot this and only then look for price breaks. Yo

The High Low indicator is a very simple indicator that has the task of showing us the minimum and maximum levels of the time frame that we wish to underline. This indicator also has the ability to show you minimum and maximum price levels of institutional periods as a level, such as quarterly, half-yearly and annual. We believe these minimum and maximum levels are the true key market levels and therefore a correct visualization on the graph is able to show the important price levels.

Zig Zag 123 tells us when a reversal or continuation is more likely by looking at the shift in supply and demand. When this happens a signature pattern appears known as 123 (also known ABC) will often break out in direction of higher low or lower high.
Stop loss and take profit levels have been added. There is a panel that shows the overall performance of your trades for if you was to use these stop loss and take profit levels.
We get alerted if a pattern 123 appears and also if the price

Candlestick Oscillator is a truly unique Oscillator that uses the concepts of within candlestick trading called the Record Session High. This is a method of analysing candlesticks to gauge when a trend might be wearing out and therefore ready for reversal or pause. We call it a record session high when we get 8 or more previous candles that have higher closes. We call it a record session low when we get 8 or more previous candles that have lower closes.
We don't rely on the typical Oscillatio
FREE

Индикатор реализован для определения классического канала движения цены, который используется на крупных биржевых площадках. Не перерисовывается Синий уровень - это уровень поддержки Красный уровень - это уровень сопротивления Белый уровень - является Pivot-уровнем Настройки Period_SEC - ввод значения периода . Примечание: Индикатор определяет уровни только на пятизначных котировках! Метод торговли: Открытие позиций осуществляется от уровней , именно на их значениях происходит отскок цены
FREE

Индикатор выводит первые производные двух MACD. По умолчанию, желтая MACD является более быстрой, чем синяя MACD. В настройках можно задать подходящие вам параметры для каждой из MACD. Одновременное изменение знака производных может являться дополнительным сигналом разворота. Входные параметры
Yellow MACD fast EMA period Yellow MACD slow EMA period Blue MACD fast EMA period Blue MACD slow EMA period
FREE
MetaTrader市场提供了一个方便,安全的购买MetaTrader平台应用程序的场所。直接从您的程序端免费下载EA交易和指标的试用版在测试策略中进行测试。
在不同模式下测试应用程序来监视性能和为您想要使用MQL5.community支付系统的产品进行付款。
您错过了交易机会:
- 免费交易应用程序
- 8,000+信号可供复制
- 探索金融市场的经济新闻
注册
登录