适用于MetaTrader 4的新技术指标 - 11

每售出5份副本后,价格将增加30美元。
首要指标的设计意图是为了确定整体市场趋势。这一指标引入了一套明亮和深色的色彩系统,旨在辨识市场的强势和弱势条件。通过在图表上显示不同颜色,投资者可以更清晰地了解市场的变化和趋势。 从我的观点来看,这个指标是独一无二的;在市场开始活跃时,其表现格外出色。这种独特性可能归因于其设计和算法,使其在市场波动较大时表现出色。
如果您更喜欢在较长时间范围内使用指标,例如1小时、4小时或日间时间框架,以期望获得更准确的结果,请毫不犹豫地采用这一策略。这样的时间框架可以帮助您更好地捕捉市场趋势,从而做出更明智的交易决策。
当颜色变为绿色时,它表示了一个购买机会;而当颜色变为红色时,它则表示建议开启空头头寸。这种简单而清晰的信号系统有助于投资者迅速做出决策,特别是对于那些希望在市场波动中迅速把握机会的交易者而言。
为了实现最佳效果,请考虑使用趋势货币对进行交易。这种方法基于市场趋势的理念,可以提高交易的成功概率。趋势货币对通常表现出较强的方向性,因此选择这些货币对有助于更好地利用市场趋势。
如果您在使用过程中遇到任何问题,我将随时帮助您解决

「趨勢反轉ml4」是一個獨特的指標,旨在即時確定價格反轉的時刻。 這是Metatrader4現成的交易系統。 該指標不會重繪其值! 該指標基於先進的演算法和技術分析,為您提供有關可能的市場進入和退出點的清晰訊號,幫助您做出明智的決策。
此指標的優點: 訊號精度高。 指標本身向交易者顯示其配置是否正確。 在零蠟燭附近,指標繪製總計值。 如果該值為負,那麼您需要調整指標設置,如果該值為正,則表示設定選擇正確,您可以開始交易。 此指標不會重繪其值。 此指標可用於所有時間範圍和所有貨幣對。 這是一個現成的交易系統。
特點:
反轉箭頭: 紅色箭頭清楚地表明可能的開倉賣出交易點,警告即將到來的價格下跌。 藍色箭頭突出顯示了開啟買入交易的區域,表明可能出現上漲趨勢。
多時期分析: 此指標支援多個時間間隔的分析,使您能夠考慮不同時間等級的趨勢和反轉。
各種市場條件下的應用: Precision Reversal Pro 策略是基於對波動性和流動性的仔細研究,使其成為平靜和活躍市場條件下的有效工具。
設定的靈活性: 此指標可讓您根據您的喜好和交易風格自訂參數
使用方便: 輕

With this easy to set up indicator you can display and set alerts for the following candlestick formations: Bull Breakout, Bear Breakout, Hammer, Pin, Bullish Engulfing, Bearish Engulfing. I'd appreciate if you would review the indicator
Input parameters: ShortArrowColor: The color of the Arrows, displaying a Bearish candle formation LongArrowColor: The color of the Arrows displaying a Bullish candle formation BullishEngulfing: Disabled/Enabled/EnabledwithAlert BearishEngulfing: Disabled/Ena
FREE

This automated DOJI BAR FINDER INDICATOR can be utilized to manage trades and identify potential areas of support and resistance for both buying and selling. It is designed to identify zones for Sell/Buy trades and can be effectively used in conjunction with other indicators, such as order block indicators, and more. Currently designed for MT4, it will later be adapted to function on MT5. We also offer the opportunity to customize the robot according to your trading strategy. https://t.me/FXTSPr
FREE
Technically, the indicator represents the difference between two fractal adaptive moving averages. Fractal Adaptive Moving Average (FRAMA) is a smart adaptive moving average developed by John Ehlers. FRAMA takes price changes into account and closely follows the price level, remaining straight during price fluctuations. FRAMA takes advantage of the fact that markets are fractal and dynamically adjusts the lookback period based on this fractal geometry. The indicator has the ability to send notif

Pivot, support and resistance levels are one of the main indicators on the charts of any professional trader. The PivotPointsMT4 indicator will help you determine the current entry points on any currency pair and any timeframe. It is convenient because it shows historical pivot, support and resistance levels on all timeframes, and you always see what worked in the recent past. Taking into account the news context, most often it is not so difficult to determine the current level and right entry

ICT Kill zone and Macros Indicator mark and display the following zone times on the chart: Kill zones Kill zone Forex Asian
London Open New York Open London Close Central Bank Dealing range
Kill zone Indices Asian London Open New York AM New York Lunch New York PM Power Hour
Macros London 1 London 2 New York Am 1 New York AM 2 New York Lunch New York PM 1 New York PM 2
Silver bullet London Open New York AM New York PM
Sessions Asian London New York
Chart The display of Kill zone ,

SX Currency Strength indicator allows users to analyze currency strength through a selected period, with results resetting periodically and accumulating thereafter. It displays the historical relative strength of eight major currencies (USD, EUR, GBP, JPY, AUD, CHF, CAD and NZD) across a selected timeframe. Assessing a currency's relative strength aids in evaluating its performance against a basket of other currencies. Users can select to visualize relative strength of the currencies in the shap

In Forex trading, understanding support and resistance is crucial. Virtually every trading strategy incorporates these levels.
MetaTrader lacks built-in support and resistance calculation features, but there's a solution— the Support and Resistance Lines indicator.
This powerful MetaTrader indicator automatically calculates and displays support and resistance levels for any chosen currency pair or trading instrument.
Benefits of the Support and Resistance Lines indicator:
1. Identify be

This pass-band oscillator reduces lag in market data by filtering out high and low frequencies. It uses two EMAs (Exponential Moving Averages) with periods of 40 and 60.
Trigger points are added using an RMS cyclic envelope over the Signal line. The pass-band waveform output is calculated by summing its square over the last 50 bars and taking the square root to create trigger levels.
Buy when the pass-band crosses above its -RMS line and short when it crosses below the RMS line. The indicat

The Waddah Attar Explosion (WAE) indicator is a potent tool in Forex trading, offering buy, sell, exit buy, and exit sell signals. It assesses trends as trend power and momentum as explosion power.
Trend Direction: - Green bars indicate a bullish trend. - Red bars indicate a bearish trend.
Signal Line: - A line serves as a threshold for momentum.
Buy Trade Setup: **Entry:** Go long when a green bar crosses above the threshold. Place a stop loss below the entry candle. **Exit:** Close the

In MetaTrader, TP & SL values aren't visible when hovering over corresponding lines. Our indicator fixes this by showing values on-screen. It displays defined SL and TP values in your account currency, facilitating easy tracking of positions. Note : The indicator estimates values, excluding commissions, and allows customization of colors and distance from SL/TP lines.
SURE REVERSAL is a histogram overbought/oversold type indicator that gives key reversal points that indicates a bull or bear market movment this indicator is fusion between moving average and the rsi indicator ,this indicator is non repainter , and is not delayed . Parameters : Ma period Ma Method Ma Price Sure Period (Rsi) Sure Price (Rsi) ==============

This trend reversal arrow indicator has an alert signal that is a valuable tool for forex traders, providing several advantages that contribute to making more informed trading decisions and potentially increasing profits. Here are some advantages: Early Identification of Reversals: The primary advantage is the early identification of potential trend reversals. This arrow indicator can visually signal when a trend may be losing momentum or about to reverse, allowing traders to be proactive rather
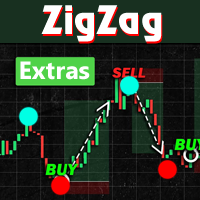
Introducing ZigZag Extras MT4, a Forex indicator that simplifies market analysis:
- Visualizes highest highs and lowest lows over a specified "Depth" period. - Highlights potential reversal points with filled blue and red dots. - Optional display of BreakOut points, indicating probable peaks and bottoms. - Helps avoid common pitfalls of mistaking repainted points for market tops or bottoms. - Designed to enhance understanding and serve as signals for various trading strategies.
Instructions
*** IMPORTANT: I will send you the real file to your email because marketplace doesn't allow DLL files and this indicator needs DLL to request the data from internet. *** My email: dibanfelipe@gmail.com *** My whatsapp: +56962286633 *** My Telegram: FelipeDiban -Retail Traders Sentiment indicator shows the percentage of longs and shorts, volume, positions and average prices in real time. -The sentiment update every 1 minute. -The source of information comes from myfxbook, which collects an imp
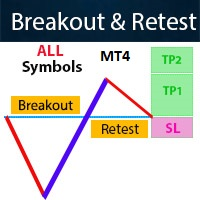
Contact me for instruction, any questions! Introduction The breakout and retest strategy is traded support and resistance levels. it involves price breaking through a previous level. The strategy is designed to help traders do two main things, the first is to avoid false breakouts. Many false breakouts start with a candlestick that breaks out of a level but ends with an immediate candlestick that brings the price back into the level. The second thing that the breakout and retest strategy does

QualifiedEngulfing - 是 ProEngulfing 指标的免费版本 ProEngulfing - 是 Advance Engulf 指标的付费版本, 点击此处下载。 ProEngulfing 的免费版与付费版有什么区别?免费版每天只能发出一个信号。 介绍 QualifiedEngulfing - 你的专业 Engulf 模式指标,适用于 MT4 通过 QualifiedEngulfing 发挥精准性的力量,这是一款设计用于辨识和突显外汇市场中合格 Engulf 模式的前沿指标。专为 MetaTrader 4 开发,QualifiedEngulfing 提供了一种细致入微的 Engulf 模式识别方法,确保您只收到最可靠的交易信号以做出决策。 QualifiedEngulfing 的工作原理: QualifiedEngulfing 采用先进的算法分析 Engulf 模式,超越了简单的模式识别,确保模式的合格性。以下是其工作原理: 资格标准:该指标评估实体百分比相对于整个蜡烛大小的百分比,并考虑影子百分比相对于蜡烛大小的比例。这种仔细的评估确保只有高概率的 Engul
FREE
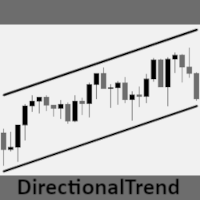
DirectionalTrend 交易指标是一种创新工具,旨在提供清晰准确的金融市场趋势视图。该指标以历史市场数据为基础,可识别并显示特定时间段内市场的总体走向。其主要目的是通过提供有关市场主导趋势的明确信号,帮助交易者做出明智决策。该指标采用直观的界面设计,易于理解和使用,适合各种经验水平的交易者。信号清晰地显示在图表上,便于做出明智的决定。交易者可以多种方式使用 DirectionalTrend,如确认进场和出场信号、识别趋势反转点以及设置止损和止盈水平。通过将该工具整合到技术分析中,交易者可以做出更明智的决策,提高市场盈利能力。该指标的用户界面直观易用,适合各种经验水平的交易者使用。其简洁明了的设计可让用户即时了解市场趋势。
参数 趋势、 颜色、线条粗细和默认颜色
FREE

ENIGMERA:市场核心 https://www.enigmera.com
简介 该指标和交易系统是金融市场的一种非凡方法。ENIGMERA 利用分形周期精确计算支撑位和阻力位。它能显示真实的累积阶段,并给出方向和目标。 该系统无论在趋势中还是在修正中都能发挥作用。
它是如何运行的? ENIGMERA 由三条线组成:支撑/阻力线、目标线和偏离线。与一般市场指标将过去的数据推断为现在和未来的情况不同,该系统能提供当前的完整情况。如果你处于支撑位,这意味着真正的支撑;如果你处于阻力位,这意味着真正的阻力。如果突破某一水平,则表示趋势发生变化。没有重绘。
由于市场在不断变化,ENIGMERA 不断调整其评估工具,定期修改策略。 这保证了每种情况都能得到全面评估。这一市场指标的独特性显而易见,其能力不言而喻。
ENIGMERA 为金融分析师和咨询师提供服务,他们需要可靠的见解与客户分享,也为投资者提供服务,他们需要最精确和最可靠的保证。 该系统能够达到最佳精度,使交易者能够自信、清晰地评估他们的选择。
ENIGMERA 将 20 年的交易专长和知识整合到一个综合软件

在外汇交易中,衡量时间的指标是一个很大的异类。人们普遍认为时间是不可分析的。
该指标的逻辑如下:
我们从物理学中知道,距离等于随时间变化的速度。S=V*t 如果我们考虑时间,它将等于速度除以距离。 t=S/V
外汇交易中的速度就是交易量,因为它不是交易量,而是一定时间内的交易次数,即交易速度。 (我已经做了这样一个指标,并给出了正确的解释,你可以看看)。
我们可以将距离定义为从 A 点到当前点的价格差。因此,我们在指标中设置了一个初始周期。
这就是我们的异域时间指标。
我将其解释权留给您。 如果您有任何意见,我将非常高兴。
在外汇交易中,衡量时间的指标是一个很大的异类。人们普遍认为时间是不可分析的。
该指标的逻辑如下:
我们从物理学中知道,距离等于随时间变化的速度。S=V*t 如果我们考虑时间,它将等于速度除以距离。 t=S/V
外汇交易中的速度就是交易量,因为它不是交易量,而是一定时间内的交易次数,即交易速度。 (我已经做了这样一个指标,并给出了正确的解释,你可以看看)。
我们可以将距离定义为从 A 点到当前点的价格差。因此,我们在指标中

Black horse 指标的目标是找出价格走势与VWAP指标之间的背离。它使用过滤器来排除许多虚假的背离,提供高质量、准确的信号。
红色点位于蜡烛上方,表示看跌的背离,而绿色点位于蜡烛下方,表示看涨的背离。
背离的主要过滤器聚焦在ATR(平均真实范围)和过去蜡烛的价格变动,直到回顾期结束。当回顾期内的价格变动足够急剧,超过ATR倍数乘以ATR时,将确定存在背离。
由于计算的特性,在处理较高时间框架时,建议将ATR倍数和回顾期设置得较低。在较高的时间框架上,价格波动往往更为平滑,例如15分钟图表,急剧的价格波动发生的频率较低,通常包含在较少的蜡烛中,而这些蜡烛通常出现在较低的时间框架上。较不波动的股票,如HSBC,也应使用较低的ATR倍数和较短的回顾期。
在“视觉设置”下,您可以更改VWAP线的颜色,显示交替的VWAP颜色,调整背离信号的大小,并显示或隐藏VWAP线。
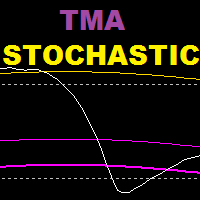
TMA 随机指标是一个基于随机震荡指标和 tma 波段指标的指标,该指标基于反转策略。
建议时间范围:15岁及以上
推荐设置:剥头皮交易的值较低,波段交易的值较高
=================================================== =====================
参数 :
tma 历史:返回多少条柱线来显示随机指标上的 tma 波段
K 周期(随机)
D 期(随机) S 期(随机) TMA期
TMA转变
极端tma偏差:远带的偏差
tma偏差:内带偏差 ----------------------------------------------------------------------------

标题:“Daotradingfx - 7年经验的波浪交易的完美关键”
外汇交易永远不是一件容易的事情,但通过daotradingfx指标,我找到了一个可靠的伙伴,为波浪交易打开了成功之门。建立在我七年的交易经验基础上,这个指标不仅仅是一个工具,更是市场理解和交易便利性的全面画布。
Daotradingfx以使用多个时间框架的能力而脱颖而出,这是一个关键功能,帮助我更深入地理解市场趋势和来自不同角度的市场动态。同时监控多个时间框架使我能够做出更准确的交易决策,提高任何策略成功的可能性。
Daotradingfx的另一个显着优势是其在跟踪多个货币对方面的灵活性。这种多样化不仅使我能够专注于多个货币对,而且扩大了市场观察范围,增加了发现交易机会的潜力。
特别是,daotradingfx非常适合波浪交易,在这种交易中,我可以利用短期波动来获取利润。多时间框架的功能是在趋势之间灵活转变的关键,帮助我抓住机会并避免不必要的风险。
Daotradingfx易于使用的特性不仅限于其功能;它还在于其易用性。即使对于初学者来说,适应这个指标的界面也是一种便利的体验。它的简单性不会降低
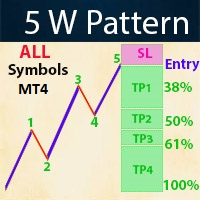
Contact me for instruction, any questions! Introduction The Elliott Wave in technical analysis describes price movements in the financial market that are related to changes in trader sentiment and psychology. The 5 W Pattern (Known as 3 Drives) is an Elliott Wave pattern that is formed by 5 consecutive symmetrical moves up or down. In its bullish form, the market is making 5 drives to a bottom before an uptrend forms. In a bearish 5-drive, it is peaking before the bears take over. 5W Pattern S
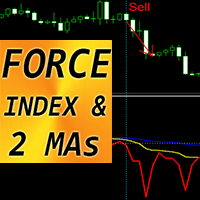
MT4 的外汇指标“FORCE 指数和 2 条移动平均线”
该指标非常适合趋势方向的动量交易。 “力量指数和 2 条移动平均线”指标可让您查看力量指数的快速和慢速移动平均线 力量指数是将价格和成交量数据结合成单个值的顶级指标之一 力量指数本身是强大的振荡器 - 衡量用于移动价格的力量大小 指标提供了尽早看到趋势变化的机会 通过参数设置该指标非常容易,它可以在任何时间范围内使用 您可以在图片上看到买入和卖出的入场条件
// 这里提供更多优秀的 EA 交易和指标: https://www.mql5.com/en/users/def1380/seller // 也欢迎您加入盈利、稳定、可靠的信号 https://www.mql5.com/en/signals/1887493 它是仅在该 MQL5 网站上提供的原创产品。

RSI divergence indicator is a multi-timeframe and multi-symbol indicator that help us find divergences between price chart and RSI indicator. Always use the divergence indicators with other technical assets like support resistance zones, candlestick patterns and price action to have a higher possibility to find trend reversals. This indicator will identify the peaks and troughs of both price and the RSI indicator. You can adjust the parameters to adjust the strength and weakness of these peaks a
FREE

The "Yesterday High Low" indicator for the MetaTrader 4 (MT4) trading platform is a powerful tool designed to help traders identify key price levels from the previous trading day. This indicator provides a visual representation of the high prices, low prices, high/low price averages, and intermediate average levels on the chart.
Primarily used by institutional and professional traders, this indicator offers an instant view of price levels that are often considered crucial in financial markets
FREE
Forex and Gold OBI is an innovative indicator based on a study of price and market dynamics, utilizing the RSI indicator. This indicator helps you find the best moment to enter the forex market by signaling when the market is in overbought or oversold conditions. Moreover, The indicator calculates two possible targets and the stop loss for each trade, allowing you to optimize your risk/reward ratio. Price This indicator is easy to use and set up, working with any currency pair and timeframe. If
FREE

This indicator integrates the Bollinger Band strategy in calculation with a volume-over-MA
calculation to further narrow down "Areas of Interest" levels for a potential re-test zone to the right of the chart.
We added a Moving Average calculation for a multi-level cloud and further broke down more conditions to highlight both
volume flow crossover on the High and Extreme High MA's and also high and extreme high volume spikes on set period average
without bull\bear conditions. Original Bull
FREE
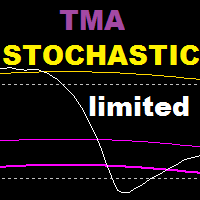
TMA Stochastic is an indicator based on stochastic oscillator and tma bands indicator , this indicator is based on a reversal strategy . Recommended time frame : 15 and above Recommended settings : lower values for scalping , higher values for swing trading WORKS ONLY ON EURUSD , GET THE FULL VERSION : https://www.mql5.com/en/market/product/108378 ======================================================================= Parameters : tma history : how many bars back to show tma bands on stochas
FREE
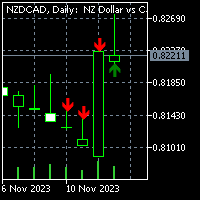
For MT5 version please click here . Introduction Most traders use candle patterns as a confirmation tool before entering a trade. As you know there are lots of candle patterns out there. However I realized most of them can be generalized in simple rules. So I developed my own candle pattern(Although I cannot say for sure this is mine). pattern description The pattern consists of three consecutive candles. This is true for most of the patterns out there (considering there is a confirmation nec
FREE
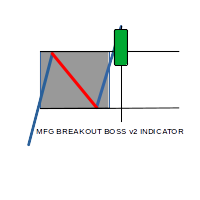
MFG breakout boss indicator is a Semi Autom ated Asian session range breakout System which seeks to identify the High and low of the asian session when the Market is ranging with no major movement, With the help of sofisticated Algorithm within the system, a breakout in either direction coupled with momentum the system gives High Accurate entries, with predefined Stop loss and 3 Take profit levels.

Attractive Numero - Numerology Levels Indicator Description: Discover the fascinating world of numerology in trading with our "Attractive Numero" indicator. This innovative tool allows you to seamlessly integrate numerology principles into your technical analysis, helping you identify critical supply and demand levels that can significantly enhance your trading strategy. How It Works: "Attractive Numero" is designed to harness the power of numerology to pinpoint supply and demand levels. You hav

Symmetrical Triangle Pattern Indicator - Mastering Trend Recognition in MetaTrader Unlock the power of trend recognition with the "Symmetrical Triangle Pattern" indicator for MetaTrader. This innovative tool simplifies the identification of symmetrical triangle patterns, providing traders with clear signals for potential trend continuation or reversal. Elevate your trading strategies with this MQL offering. Key Features : Accurate Pattern Recognition : The Symmetrical Triangle Pattern Indicator
STOCH ARROW is a long short arrow signal type indicator that is based on standard stochastic oscillator this indicator has 3 methods of giving long and short signal that are as follow : 1.whenever stochastic lines cross 2.when a cross happens in overbought and oversold zones (short arrow on overbought zone cross , long arrow on oversold zone cross) 3.when stochastic lines leave overbought and oversold zones (short arrow on leave from overbought zone , long arrow leave on oversold zone) this ind
Supreme Trend is a reversal/continuation type Oscillator type indicator that is based on Moving average and stochastic indicators this indicator can be used in two methods : Reversal Method : short when golden arrow appear after arrows were above upper level (e.g 70) Reversal Method : long when Purple arrow appear after arrows were below lower level (e.g 30) Trend Method : long when arrows cross above 50 level line , short when arrows cross below 50 level line. use higher ma and stochastic peri

Introducing the South African Sniper indicator created by a small group of traders with a few years trading trading the financial market profitably . This is a plug and play indicator that provides you with BUY and SELL (SNIPER ENTRY) signals with TARGET and trail stops. The indicator Works with all MT4 trading instruments. The indicator uses previous chart data as receipt to speculate on future market moves.
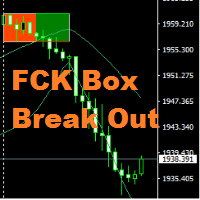
Hi All, " FCK Box Break Out " indicator is very simple indicator for new users. You can choose which indicators and timeframes you want to calculate. "FCK Box Break Out" provides the day's trend for buy/sell trades. Opposite side you the stop loss or hedging trade. NON-REPAINT Buy/Sell signals Recommendations Timeframes: Recommended - H 1 (Still, EA technically works on any Time frames ) Spread : up to 20 Recommended pairs: works on any metal, indices and currency pair
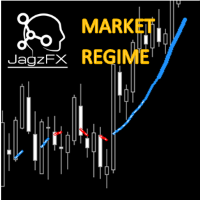
Elevate your trading with the JagzFX Market Regime Filter—adapt, optimize, succeed in navigating through smooth or volatile price movements. Gain a deeper understanding of market dynamics to refine your strategy and make informed decisions. KEY FEATURES Price Action Analysis: Distinguishes between smooth and volatile price movements. Trend Identification: Pinpoints bullish or bearish trends with precision. Strength Assessment : Evaluates the strength of identified trends—whether strong or weak M
Доброго времени суток уважаемые трейдеры и инвесторы.
Вашему вниманию предлагается индикатор, определяющий за любой промежуток времени : Максимальную цену. Минимальную цену. 50 % от от максимума до минимума. Цену закрытия периода. Кроме того, в зависимости от настроек - индикатор может добавлять 10 процентных уровней как вниз, так и вверх, эти уровни указываются, но по стандарту начинаются от 50% с шагом 50% до 500%. В обе стороны. Индикатор реализован максимально удобно, при смене тайм-фрейма

note: this indicator is for METATRADER4, if you want the version for METATRADER5 this is the link: TRENDMAESTRO recognizes a new TREND in the bud, he never makes mistakes. The certainty of identifying a new TREND is priceless. DESCRIPTION TRENDMAESTRO identifies a new TREND in the bud, this indicator examines the volatility, volumes and momentum to identify the moment in which there is an explosion of one or more of these data and therefore the moment in which prices have strong probability of f
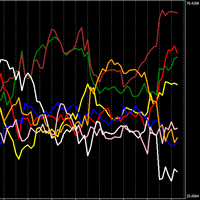
顯示單一貨幣強度的強大指標。
越高,貨幣越強,反之,越低,貨幣越弱。
交易策略N1:線上交叉建倉,如果一個向上交叉,另一個向下交叉,則在正在上漲的貨幣上建倉。
交易策略N2:透過買入最強貨幣並賣出最弱貨幣來建倉。
在設定中,您可以變更時間範圍,我使用預設的時間範圍(時間範圍 1 小時)和週期 24。我還使用時間範圍 1 分鐘和週期 1440。
显示单个货币强度的强大指标。 越高,货币越强,反之,越低,货币越弱。 交易策略N1:在线交叉建仓,如果一个向上交叉,另一个向下交叉,则在正在上涨的货币上建仓。 交易策略N2:通过买入最强货币并卖出最弱货币来建仓。 在设置中,您可以更改时间范围,我使用默认的时间范围(时间范围 1 小时)和周期 24。我还使用时间范围 1 分钟和周期 1440。

交易速度(TRANSACTION SPEED)是最高质量的指标,可显示市场上何时何地积累了大量订单,以及由此带来的好处。它能在早期阶段检测到趋势变化。它既是一个指标,同时也是一个交易系统。概念独特,利润惊人。
在外汇交易中,"tick volume"(交易量)被误称为 "成交量"。实际上,它是单位时间内的价格变化,事实上就是交易速度。 该指标彻底改变了外汇交易中成交量的概念,以正确的逻辑方式定义了成交量,并将这一逻辑应用成为独特而精确的顶级盈利工具。 当速度增加时,就意味着更大的利益以及相应的进入和退出。
如何使用
由于该指标测量并比较市场交易的速度,因此首先要做的是 选择进行比较的时间段。 通常,15 天前是一个很好的比较起点。 在指标中输入日期并运行。 在 30 分钟或 1 小时的时间框架内,最能看出速度周期。 不过,您也可以使用其他更详细或更不详细的时间框架。
周期本身可以在下降趋势或上升趋势中移动。
当交易速度从下降趋势转为上升趋势时 我们就处于价格反转点,可以在此建仓,避免任何风险。这就是大资金进入市场的地方。
这是一款非常严肃的工具,专为最
Supreme Diamond 是一个基于反转和趋势交易策略的多时间框架指标,该指标不会重新绘制或回画,并且信号不会延迟,该指标会给出带有警报的买入和卖出信号。
该指标有 2 种信号模式可供选择(使用最佳条目作为菱形)输入,如果设置为 true,指标将过滤正常模式信号并给出最佳可能的一种作为菱形信号,在菱形模式下您无法调整菱形信号。 正常模式是当(使用最佳条目作为菱形)输入设置为 false 时,这将激活波段设置和正常模式作为布林带策略,如屏幕截图所示 我们强烈建议使用钻石模式,因为它显示出最佳性能 如何交易至尊钻石:当您从指标收到信号时进入交易,将 sl 设置为先前的低点/高点,并将 tp 设置为 1 比 1 的最小 RRR。
建议时间范围:任意
=========================================
参数 : 用于显示信号的时间范围(仅限正常模式) 频段设置(仅限正常模式) 使用最佳参赛作品作为钻石? (普通模式=假/钻石模式=真) 警报设置 信号形状选项 =========================================
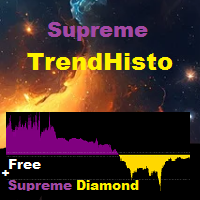
Supreme TrendHisto 是一个趋势指标,可给出下降和上升趋势信号,该指标充当直方图,该指标不会重画/回画/延迟。
战略
买入交易:直方图交叉到0.65上方,我们打开买入交易,至于退出,您可以在直方图达到0.70水平时退出,也可以立即退出。
卖出交易:直方图交叉低于-0.65,我们打开买入交易,至于退出,您可以在直方图达到-0.70水平时退出,也可以立即退出。 ===============================
建议时间范围:任意
推荐期限:默认
=============================================
参数 :
1.指标周期(倒卖较低,波段交易较高)
2.计算类型(收盘/开盘/最高最低价...等)
3.max bar(显示多少历史记录)
4.mode fast(保持true)
=================================================== ==================================================
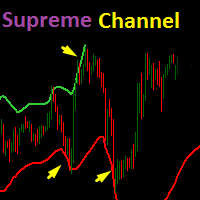
基于 TV ATR 通道指标,Supreme Channel 指标是一个动态支撑和阻力带,为交易者提供当前趋势潜在反转的提示。
建议时间范围:15M及以上
推荐设置:默认,但交易者可以根据需要选择更改。 ==============================================================================
参数 :
1. 通道长度
2.带宽(两条通道线之间的距离)
3.乘数(ATR值乘数)
4. 显示频道(True/False) =========================================================================
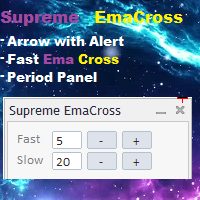
Supreme EmaCross是一个基于两条指数移动平均线交叉的指标,它根据ema交叉生成买入和卖出箭头,并在信号出现时发出警报,该指标不会重新绘制或回画,并且箭头不会延迟,该指标具有快速的特点。 EMA 周期更改面板,交易者可以在不进行指标设置的情况下更改 EMA 值,该面板是可移动的。
=================================================== ====
参数 :
快速周期:快速 EMA 周期
慢周期:慢 ema 周期
通知和警报设置
EMA 线开/关
ema 线颜色
EMA 十字箭头开/关
ema十字箭头颜色
=================================================== =========
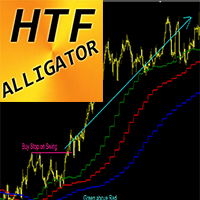
MT4 外汇指标鳄鱼更高时间范围
鳄鱼指标是最强大的趋势指标之一。 HTF 意味着 - 更高的时间范围 该指标非常适合趋势交易者以及与价格行为条目的结合。 HTF 鳄鱼指标允许您将较高时间范围内的鳄鱼指标附加到当前图表。 仅当绿线高于红线且红线高于蓝色时才考虑买入入场 - 在图表上最新波动的最大值上安排买入止损挂单 仅当绿线低于红线且红线低于蓝色时才考虑卖出入场 - 在图表上最新波动的最小值上安排卖出止损挂单 HTF 鳄鱼指标提供了以低风险获取高额利润的机会。
// 这里提供更多优秀的 EA 交易和指标: https://www.mql5.com/en/users/def1380/seller // 也欢迎您加入盈利、稳定、可靠的信号 https://www.mql5.com/en/signals/1887493 它是仅在该 MQL5 网站上提供的原创产品。
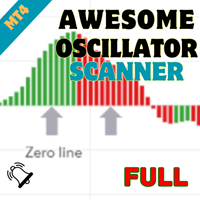
Welcome to the world of advanced trading with the Awesome Oscillator Scanner! Maximize your trading experience with our powerful MT4 indicator designed for seamless analysis and real-time insights. Key Features: Effortless Awesome Oscillator Scanning: Unlock the full potential of the Awesome Oscillator Scanner by effortlessly scanning multiple currency pairs. Receive instant alerts when specific Awesome Oscillator conditions are met, ensuring you stay ahead of market movements. Comprehensive Da

The Datasource AC indicator is a technical analysis tool developed by the author based on the Accelerator Oscillator. Everyone knows the general principles of working with the AC indicator. Therefore, I will not describe them separately. I will focus on differences.
Differences are a purely technical implementation and expanded indicator. An important feature is that the indicator does not change its values even when using the closing price, since the indicator uses the safe calculation a

The SFT Fibo Smart Pivot indicator is a powerful trading tool based on the Fibonacci Golden Ratio, designed to identify key support and resistance levels in the forex market. This indicator has the ability to pinpoint significant price levels that can serve as entry and exit points for trades. It enables traders to analyze the market more effectively and make well-informed decisions. The indicator uses the Fibonacci Golden Ratio to accurately determine support and resistance levels. These levels
FREE

The indicator is the advanced form of the MetaTrader 4 standard Fibonacci tool. It is unique and very reasonable for serious Fibonacci traders.
Key Features
Drawing of Fibonacci retracement and expansion levels in a few seconds by using hotkeys. Auto adjusting of retracement levels once the market makes new highs/lows. Ability to edit/remove any retracement & expansion levels on chart. Auto snap to exact high and low of bars while plotting on chart. Getting very clear charts even though man
This indicator is a modification of the classic Parabolic support and resist (PSAR) indicator. The indicator has two customizable ranges, which allows you to identify long-term and short-term trends. The indicator has the ability to generate signals and send notifications about them to email and the terminal. A time-tested product that allows you not only to determine entry/exit points, but also reasonable levels for placing protective stop orders.
FREE
The presented indicator is based on a fast digital filter (RFTL) with the help of which a short-term trend is predicted. This product marks trend reversal points and support/resistance lines. The indicator has six calculation options: 1. Identifies the closing price leaving the channel; 2. Identifies the exit/entry of the closing price outside the channel; 3. Identifies the closing price leaving the channel and sideways price movement; 4. Identifies the average price going beyond the channel; 5.
The presented indicator is based on a slow digital filter (RSTL) with the help of which a long-term trend is predicted. This product marks trend reversal points and support/resistance lines. The indicator has six calculation options: 1. Identifies the closing price leaving the channel; 2. Identifies the exit/entry of the closing price outside the channel; 3. Identifies the closing price leaving the channel and sideways price movement; 4. Identifies the average price going beyond the channel; 5.

The Supreme HmaSignal indicator is an indicator for trend trading , its main character is the hull moving average colored line , and secondary is buy and sell arrows , arrows are fair but the main focus is on the colored hma , this indicator does not repaint or back paint or delay its signals. if you like this indicator please check my Supreme Trendhisto: here , and my Supreme Diamond indicator : here
Parameters: HMA Period HMA Smoothing HMA Price (close/open) Signal Period (Arrows)
FREE

Rsi indicator and Stochastic Combined into one indicator , the Supreme StochRsi doesnt repaint / Back-paint / delay. can be used as overbought oversold strategy , or trend following on 50 level cross. if you like this indicator please check my Supreme Trendhisto: here , and my Supreme Diamond indicator : here ========================================================================= Parameters : Stochastic K and D value , Stochastic period Rsi Period Rsi price ====================================
FREE

Supreme Direction is an indicator based on market volatility , the indicator draws a a two lined channel with 2 colors above and below price , this indicator does not repaint or back-paint and signal is not delayed. how to use : long above purple line , short below golden line. Parameters : channel period ========================================================
FREE

Daily supply and demand levels for breakouts or reversals. Use on 1 Hour charts No nonsense, for the confident trader who trades price action supply and demand levels with daily projections without the fluff using 1 Hour charts. MT5 Version: https://www.mql5.com/en/market/product/108522 The Bank Trader Indicator is a sophisticated tool employed by institutional traders, particularly those in banking institutions, to navigate the complex world of forex markets. Rooted in the principles of daily

WONNFX create arrow tester. Сonstructor/Tester. Tester for buffer indicators. Converting a buffer indicator into an arrow signal on the chart. Combining two buffer indicators into one arrow signal. Filter by candle color. You can move the arrow signal several bars forward (useful in cases where the indicator gives signals 2-3 bars late
"WONNFX create arrow tester" is a tool designed specifically for traders who use buffer indicators in their trading strategies. This tester converts the buffer
FREE

Supreme Stoploss is an indicator for metatrader 4 that is based on the ATR indicator , it gives stoploss/takeprofit as lines drawn above and below the price , this indicator does not repaint/back paint and is not delayed. can be used to determine the stop loss or take profit of a trade using ATR value multiplied by the number set by user. ====================================================================================================== Parameters : ATR SL period : ATR period identity : leave
FREE
Welcome to the world of advanced trading with the Moving Average Crossover Multicurrency Scanner! Elevate your trading experience with our powerful MT4 indicator designed for seamless analysis and real-time insights. Key Features: Effortless Moving Average Crossover Scanning: Unlock the full potential of the Moving Average Crossover Multicurrency Scanner by effortlessly scanning multiple currency pairs. Receive instant alerts when specific Moving Average Crossover conditions are met, ensuring y
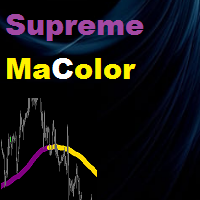
Supreme MaColor is an indicator based on moving average indicator , it gives up and down trend colors and it has different moving averages types and has multi time frame function , this indicator does not repaint/back-paint/delay signal. =================================================================================== Parameters : Timeframe (what time frame to use to draw Supreme Ma) Ma Period Ma Type Ma Price (close/open...etc) Average Shift (Ma shift) Multi Time frame on/off ===============

Head and Shoulders Pattern Indicator - Your Key to Recognizing Trend Reversals Unlock the power of pattern recognition with the "Head and Shoulders Pattern Indicator." This cutting-edge tool, designed for MetaTrader, is your trusted ally in identifying one of the most powerful chart patterns in technical analysis. Whether you're a novice or an experienced trader, this indicator simplifies the process of spotting the Head and Shoulders pattern, allowing you to make informed trading decisions. Key
Supreme MaChannel is an indicator based on moving averages , the indicator gives dynamic support and resistance in bands format. Recommended for reversal traders , add it to your reversal strategy. Parameters : Supreme MA Period : ma periods Supreme MA Price : close/open/high/low..etc Supreme MA Type : Simple/Exponential/Smoothed/Linear Weighted Deviation : bands deviation the distance between the two band lines
Supreme Entry is an arrow signal based indicator that give buy and sell signals , the indicator gives buy/sell signals with alert on candle open/close (depends what you set it to be from inputs) . this indicator does not repaint/back-paint and signal is not delayed. Strategy : Open buy same moment buy arrow appear and open sell same moment a sell arrow appear , close on well or on opposite signal . Recommended Time frame : 15 and above this arrow is good as ? : addon to your existing strategy ,

Flag Pattern Indicator - Your Guide to Flagging Profitable Trade Setups Welcome to the world of precision trading with the "Flag Pattern Indicator." Designed for MetaTrader, this powerful tool is your go-to solution for identifying one of the most reliable and versatile chart patterns in technical analysis: the flag pattern. Whether you're a seasoned trader or just starting, this indicator simplifies the process of spotting flag patterns, giving you an edge in your trading decisions. Key Feature
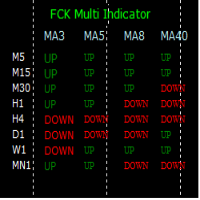
The FCK Multi Indicator for MT4 displays trend direction of multiple indicators on multiple time frames for a pair. So, forex traders can see the trend direction at a snap and trade with confluence of multiple indicators. Furthermore, it helps traders to see the trend in multiple time frames and trade in the direction of the overall market trend. Additionally, it shows the stop loss, pips to stop, pips in profit of any open position. The indicator display is very neat and is very helpful for bot
您知道为什么MetaTrader市场是出售交易策略和技术指标的最佳场所吗?不需要广告或软件保护,没有支付的麻烦。一切都在MetaTrader市场提供。
您错过了交易机会:
- 免费交易应用程序
- 8,000+信号可供复制
- 探索金融市场的经济新闻
注册
登录