适用于MetaTrader 4的新技术指标 - 20

custom Power Trading Indicator or in short called Customm.
This indicator combines multiple build in custom indicators for super accurate prediction of price movements on all trading pairs like EUR/USD , USD/JPY , GOLD , OIL , SILVER . This indicator can be converted to and expert adviser also , this indicator is very good for scalping or a long time positions . This indicator doent not repaint or re draw .

金色的太阳123趋势仪表盘带提醒MT4指标 在不断变化的金融市场中, 交易者们一直在寻找能给他们带来竞争优势的工具。 在对精确性和盈利能力的追求中, 金色的太阳123趋势仪表盘带提醒MT4指标闪耀着机会的光芒。 该指标专为MetaTrader 4平台设计, 以其趋势跟踪功能和提醒机制, 为战略交易提供了精髓。 利用趋势的力量: 金色的太阳123趋势仪表盘带提醒MT4指标的核心是一个用于识别和利用市场趋势的复杂工具。 交易者们明白, 趋势是盈利交易的生命线, 该指标经过精心设计, 以实现这一目标。 它不懈地扫描市场, 即时识别新兴趋势, 无论是看涨、 看跌还是盘整。 清晰的仪表盘: 该指标的突出特点之一是其用户友好的仪表盘。 在每一秒都至关重要的环境中, 拥有清晰、 简洁的信息可以产生重大影响。 仪表盘提供了多种货币对、 商品或指数的综合概述, 让交易者能够轻松评估市场状况。 让您领先的提醒: 在如今快节奏的交易世界中, 错过关键的市场变动可能导致错过机会和损失利润。 金色的太阳123趋势仪表盘带提醒MT4指标通过将实时提醒直接发送到您的交易平台, 确保您始终处于领先地位。 无论是趋势反

ECM Elite Channel is a volatility-based indicator, developed with a specific time algorithm, which consists of finding possible corrections in the market.
This indicator shows two outer lines, an inner line (retracement line) and an arrow sign, where the channel theory is to help identify overbought and oversold conditions in the market.
The market price will generally fall between the boundaries of the channel. If prices touch or move outside the channel, it's a trading opportunity.
The

индикатор для бинарной торговли, основанный на пересечении 3MA с macd, он дает сигналы на покупку и продажу при открытии бара и не перерисовывается и не перерисовывается
Индикатор не ориентирован на высокий процент выигрышей, поскольку он создан для торговли по мартингейлу, индикатор ориентирован на наименьшее количество проигрышных сигналов подряд.
Стратегия:
Минимальный депозит 1000 юнит, торговлю начинаем с 1 юнит (размер сделки 1 юнит на каждые 1000 капитала)
мы удваиваем размер сделки п
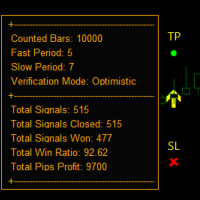
基于 3 条移动平均线交叉策略,统计箭头给出买入和卖出信号,并在图表上绘制点的 tp 和 sl,它带有回溯测试仪表板,显示获胜率以及已平仓的交易数量、已获胜的交易数量、已获胜的交易数量亏损,最终盈利,指标在 BAR OPEN 上沿 tp 和 sl 打印箭头,并给出预警。
参数显示在设置屏幕截图中并进行了解释。 ====================================== ====================================== ====================================== ====================================== ======================================

该指标基于实际经验。
输入顶部/底部的日期/时间。
它会计算从顶部/底部到当前时刻访问次数最多的级别。
每根新蜡烛都会自动更新。 您可以针对不同的趋势和时间框架同时使用多个指标。
长度总是从您的时间段开始绘制到现在。
实用的专业工具。
该指标基于实际经验。
输入顶部/底部的日期/时间。
它会计算从顶部/底部到当前时刻访问次数最多的级别。
每根新蜡烛都会自动更新。 您可以针对不同的趋势和时间框架同时使用多个指标。
长度总是从您的时间段开始绘制到现在。
实用的专业工具。
该指标基于实际经验。
输入顶部/底部的日期/时间。
它会计算从顶部/底部到当前时刻访问次数最多的级别。
每根新蜡烛都会自动更新。 您可以针对不同的趋势和时间框架同时使用多个指标。
长度总是从您的时间段开始绘制到现在。
实用的专业工具。

Point Trend Indicator - An indicator of the upper and lower level of the trend, which can determine the trend direction and indicate its strengthening. The trend direction is determined by round dots; if the points are above the zero line, the trend is bullish; if below, the trend is bearish. The increase in directional movement is indicated by arrows. It has the only parameter for manual adjustment - Duration of the trend direction.
Possibilities
Works on all time frames Adapts to any fin

“自动 FIBO”指标 - 交易中很棒的辅助工具!
指标自动计算并放置在图表斐波那契水平和局部趋势线(红色)上 斐波那契水平表明价格可能反转的关键区域 最重要的水平是 23.6%、38.2%、50% 和 61.8% 您可以将其用于反转剥头皮或区域网格交易 使用自动 FIBO 指示器还有很多机会来改进您当前的系统 ............................................................................................................. // 这里提供更多优秀的 EA 交易和指标: https://www.mql5.com/en/users/def1380/seller 它是仅在该 MQL5 网站上提供的原创产品。
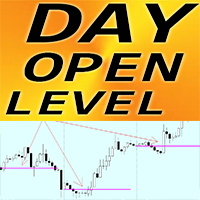
MT4 外汇指标日内开盘水平
“日内开盘价”指标是非常有用的辅助指标 开盘日水平非常重要,因为价格经常在白天返回到该区域。 指标显示您每天的每日开盘线 对于日内交易者设定目标或用作支撑/阻力区域非常有用。 日内开盘水平指标可用于反转日内交易 ............................................................................................................. // 这里提供更多优秀的 EA 交易和指标: https://www.mql5.com/en/users/def1380/seller 它是仅在该 MQL5 网站上提供的原创产品。

Dr Trend is a trend indicator for the MetaTrader 4 trading platform. This indicator allows you to find the most likely trend reversal points. You won’t find a proprietary indicator like this anywhere else. A simple but effective system for determining the Forex trend. From the screenshots you can see for yourself the accuracy of this tool. Works on all currency pairs, stocks, commodities, cryptocurrencies.
Are you already tired of constant ups and downs? You shouldn’t fall victim to unstable

Indicator for Scalping with Signal Arrows
Three-Level Sensitivity Setting
This indicator rapidly identifies changes in price direction and provides signals for opening positions.
Signals trigger instantly on the current candle.
It includes built-in audio and visual alerts for trend changes.
It can send notifications to your phone or email.
It works on all timeframes, across all currency pairs, metals, indices, and cryptocurrencies.
It can be used for binary options trading.
Ke
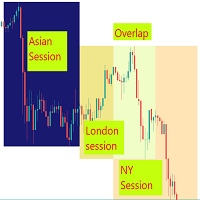
Visual guide which divides the 24 hours into three trading sessions. The default setting is to show Asian , London and New York sessions. But, the session start and end hours can be adjusted as required.
The indicator is useful to develop trading strategies by making it easy to see the market behavior during the three sessions.
Inputs Time Zone Start and End hours (Please provide values in HH:MM format, like 02:00, not like 2:00. Both the hours and minutes should have 2 digits)

This indicator is great for trading on many currency pairs The indicator itself uses mathematical strategies with augmented precision. Many settings can be configured. There are elements on the chart for visualization. He displays his solution on a graph in the form of icons. There are several types of icons. In the tester it works fine by default in the settings. It is already configured by default. Happy bidding.

This indicator is great for trading on various trading pairs. The indicator itself uses mathematical linear strategies of augmented accuracy, but for now they are optimized for some currency pairs. Many settings can be configured in the initial settings. There are lines and arrows on the graph for visualization. He displays his solution on a graph in the form of icons. There are only two types of badges. In the tester it works fine by default in the settings. It is already configured by default

Smart Ai Levels Accumulation & Distribution indicator
Smart Ai Levels are Ai controlled indicator which is based on Wyckoff Price cycle theory . It automatically scans the Accumulation & Distribution phases on chart and Ai draws the possible areas before Mark up and Mark down which acts as hot zones and can be traded with confirmation to catch those big price movements . It's a great tool for both Reversal and Breakout Trades suitable to all Trading Styles such as Scalping - Intraday - Swing

The Pure Cross Entry Signal Indicator is a powerful tool designed to assist traders in making informed decisions in the financial markets. This advanced indicator leverages cutting-edge algorithms and technical analysis to identify potential entry points with high accuracy. The indicator works based on instant price movements. This indicator is a complete trading product. This indicator does not need any additional indicators.
The indicator certainly does not repaint. The point at which t

True Super Arrows is a powerful and versatile indicator that can help you identify and trade profitable trends. The indicator uses a combination of technical indicators to generate arrows that point to the direction of the trend. Features: Multiple trend identification methods: The indicator uses a combination of moving averages, trend lines, and other indicators to identify trends. Accurate trend direction: The indicator uses a variety of techniques to ensure that the arrows are pointing in

Camarilla Pivot Points is a math-based price action analysis tool that generates potential intraday support and resistance levels. Pivot price values are stored in output buffers within this indicator, enabling any Expert Advisor to utilize this indicator's data for trading purposes. This indicator offers the potential for developing numerous strategies. To explore some of these strategies, please visit the following websites: https://www.babypips.com/forexpedia/camarilla-pivot-points https:

In the ever-evolving world of financial markets, having the right tools at your disposal can make all the difference. Introducing "Super Trend Filtering," the MetaTrader 4 (MT4) indicator that elevates your ability to identify and leverage market trends. Key Highlights: Pinpoint Trend Accuracy: "Super Trend Filtering" harnesses cutting-edge algorithms to precisely identify market trends. Tailored to Your Preferences: Customize "Super Trend Filtering" to align with your trading strategy. Adjust
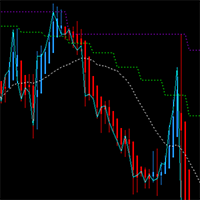
This MT4 chart trend checker cuts through the noise of market volatility to provide a clearer picture of trends and price movements. It includes the following features that can provide more clarity during market assessments: 1 customizable multi-period moving average Optional Heikin-Ashi candles 3 switchable focus modes Distinct colors for easy analysis
Link to MT5 version: https://www.mql5.com/en/market/product/106707/
This indicator shows your preferred moving average from multiple time fr
FREE

Description:
This indicator (with its algorithm) marks relative highs and lows, which have an array of useful applications.
This indicator will never repaint.
Features:
Marks relative highs and lows Use this to determine points of trend continuation i.e. where the trend may pull back before continuing higher or lower, past this point Or use this to determine potential points of reversal, particularly in ranging markets, or with other price action These highs and lows can sometimes
FREE
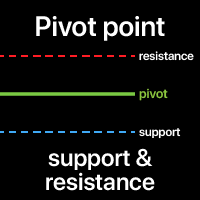
A Pivot point is used to determine the overall market trend. The pivot level itself is the average of the high and low, and the closing price from the previous bar.
On the next bar trading above the pivot point is thought to indicate ongoing bullish sentiment, while trading below the pivot point indicates bearish sentiment.
The pivot point is the basis for the indicator, but it also includes other support and resistance levels that are projected based on the pivot point. All these levels h
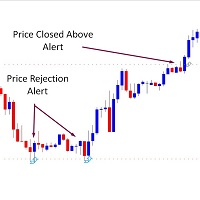
*** Introductory Offer! *** Ends soon - do not miss it! The Price Alerts 3 in 1 Indicator is part of my suite of Price and Trendline Alerts Indicators. I'm excited to introduce the Price Alerts 3 in 1 Indicator – part of my new suite of Price and Trendline Alert Indicators – fantastic tools designed to: … alerts you when 1. candles close above or below significant prices 2. price breaks above or below significant prices 3. price rejects significant prices in the markets you trade. With t
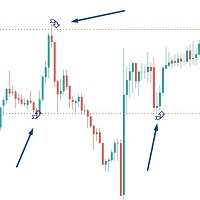
*** Introductory Offer! *** Ends soon - do not miss it! The Price Rejection Alerts Indicator is part of my suite of Price and Trendline Alerts Indicators. I'm excited to introduce the Price Rejection Alerts Indicator – part of my new suite of Price and Trendline Alert Indicators – fantastic tools designed to alert you when candles close above or below significant prices in the markets you trade. With this indicator, you can set up to 4 price alerts on any asset, allowing you to quickly spo
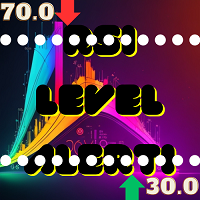
Simple alert system which will alert you on your mobile terminal, email and on the chart whenever RSI crosses below the overbought level or above the oversold level. Use this alert system, so you don’t have to watch the chart all day for the RSI levels to break.
INPUTS: 1. RSI Period- (Default is 14). Number of candles the RSI indicator will look back for the calculations. 2. OB Level- (Default is 70). This is the Overbought level or Upper level for the RSI indicator. 3. O

DYJ T3ModeMA基于T3算法。 T3算法是在美国杂志《TASC》发表的文章《更好的移动平均线》中被引入技术分析领域的。 T3可以平滑价格序列,同时减少趋势跟踪系统的典型滞后。 该指标的柱形线尺寸决定入场信号,当柱形线尺寸趋于0时,则是趋势转折点。
该指标使用模拟交易技术, 指标为你提供评价开盘信号和收盘信号整体盈利。 你用哪种评估模式交易都很方便。 当你选择最大利润模型评估模型时, 建议您使用跟踪止损功能。 这样可以最大程度的跟踪趋势利润。 当您选择反向信号关闭评估模式时, 建议你耐心等待反信号出现,然后关闭仓位。 这个可以一直等趋势真正结束并盈利。 如果您需要自动化跟随指标开仓关仓,请下载实用工具软件 DYJ Follow Me
Input [Indicator] InpMaMetod = 2 -- Moving Average method(0~3):0-Simple averaging; 1-Exponential averaging; 2-Smoothed averaging;3-Linear-weighted averagin
InpMaPer
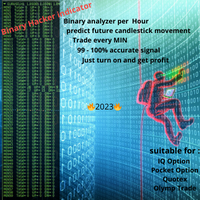
在快节奏的金融市场中,每一秒都至关重要,每一个决定都可能成败。进入 Binary Hacker Indicator,这是一个开创性的工具,将以每分钟为单位的方式改变交易者分析价格走势的方式。 揭示交易中的精准度: Binary Hacker Indicator 并非您的普通交易工具。它作为实时分析器运行,逐分钟分析图表,为交易者提供宝贵的见解。与需要大量手动分析的传统指标不同,Binary Hacker 消除了交易策略中的猜测,提供了一种基于纯粹数据的计算方法。 每一分钟的力量: 想象一下能够分析交易的每一分钟,了解买卖压力之间的微妙平衡。有了 Binary Hacker,这一愿景就变成了现实。这个巧妙的指标会持续监控市场并计算每一分钟的上升和下跌笔数,将价格走势的本质提炼为易于理解的信息。 独特的策略,无与伦比的结果: Binary Hacker Indicator 与众不同的是其独特的交易策略,这些策略经过精心调整,可以适应价格走势的细微差别。当您在图表上激活指标时,它会在每分钟的前十秒内耐心等待,让市场显示其初始情绪。如果上升笔数多于下跌笔数,则该指标会提示您考虑买入交易,反之亦

"Ppr PA" is a unique technical indicator created to identify "PPR" patterns on the currency charts of the MT4 trading platform. These patterns can indicate possible reversals or continuation of the trend, providing traders with valuable signals to enter the market.
Features: Automatic PPR Detection: The indicator automatically identifies and marks PPR patterns with arrows on the chart. Visual Signals: Green and red arrows indicate the optimal points for buying and selling, respectively. A
FREE

当您购买Easy Trend Pro时,您将获得Advanced SR免费以及结合了EasyTrendPro和 AdvancedSR 的交易策略。 付款后,请单独给我发送一条消息以获取您的礼物。 频道支持: 点击这里 商店 : 点击这里
"趋势是您的朋友"可能是您以前听过的一句话。
这是一句在您交易市场时将随着您的一句经典话语。
当您跟随当前趋势时,您的获胜率会增加。
那么,如何轻松识别趋势?如何知道当前趋势是多头还是空头?
如何基于市场趋势做出交易决策?
EasyTrendPro就在这里支持您。
该指标使用两种颜色轻松识别当前趋势:
白色蜡烛:上涨趋势 黄色蜡烛:下跌趋势 您的任务是注意蜡烛的颜色,无需进行详细分析。
指标特点:
1- 您可以使用多个时间框架。
2- 当市场趋势发生变化时,它会提醒您。
3- 它会发送电子邮件通知。
使用EasyTrendPro进行交易:使用MA 25和75。
在M15时间框架上使用它。 在输入参数中设置TimeFrame = PERIOD_H4。
购买入场:当满足以下条件时,放置多头订

The Bars Deflection trend indicator can be used with any trading pair and on any time frame. With this indicator it is impossible to miss the beginning of a trend. Use Bars Deflection as a standalone strategy or as an addition to yours. Signal arrows appear on the chart at the moment the bar opens and are located at the breakout level of the reverse movement. Thus, the arrows not only indicate the possible direction of movement of the quote, but also act as levels for analyzing the placement of

趋势迅捷 它旨在供任何人使用,即使是交易的绝对初学者也可以使用它。 切勿重新粉刷。 指示是从接近到接近给出的。 设计为单独使用,不需要其他指标。
它是如何工作的 TrensSwift 使用内部趋势指标结合价格行为和斐波那契系统。 该策略被严格应用,没有任何后期重新计算、平滑或插值。 通过评论部分的统计数据可以立即检查该策略的“成功” 从蜡烛收盘到蜡烛收盘,趋势指标实时等待信号条件有效,然后用箭头显示(绿色表示买入,橙色表示卖出) 该指标在交易机会开始时显示止损和止盈,并在整个交易过程中保持它们。 没有惊喜。
TrendSwift 表明 在哪里开启您的交易。 何时关闭它们。 止盈和止损
TrendSwift 有效 使用任何仪器,不受限制。 在任何时间范围内 与任何经纪人。
TrendSwift 功能 没有优化。 非常简单的输入。 非常强大和准确的策略
如何使用TrendSwift 只需将其放在您的图表上即可。 只需遵循箭头和趋势线指示即可。
输入 交易机会时播放声音:当交易机会临近时播放声音(以警告交易者)

指示器显示图表上的任何文本和任何图像,也可以输出宏请求的信息。 有三个文本块和一个图像块。 字体选择,大小,颜色,边距和定位可用。 如果你想标记你的屏幕截图或在图形上显示必要的信息,那么 UPD1 Watermark 将是一个非常有用的工具。
设置的说明。
文本设置(3块)。 Text 1, 2, 3 – 输入文本和或宏。 Font Name – 输入字体名称。 如果出现错误,将使用默认字体。 Font Size – 指定字体大小。 Font Color – 指定字体颜色。 Corner – 对象锚角的选择。 Visual Position – 对象在图形前面或后面的位置。 X – 以像素为单位的水平缩进。 Y – 以像素为单位的垂直缩进。
图像设置(1块)。 Image – 选择图像。 Manual - 使用此设置,请在下面输入图像的名称。 Watermark. Money Mandala. Manual Image Name ***.png in Files – 指定PNG文件的名称。 PNG文件应位于 Terminal\MQL4\Files\ Corner –
FREE
*笔记 : 早期购买者可享受 40% 折扣! 免费 EA 将于 11 月第 2 周发布 一旦免费 EA 可用,折扣即结束 RSi 指标是指示某种商品或货币对超买或超卖时最受欢迎的指标之一。
货币强弱计也是一个基于多种货币的趋势指标。
RSi 货币强度计是一款单图表指标,具有 RSi 和货币强度计的算法。
它还具有一键功能,其中 28 个主要和次要对显示在您的仪表板上,通过单击某个对,您的图表将自动更改为您选择的图表。
产品优势: 免费 EA 来管理您的交易。给我留言了解更多详情 输入参数 RSi 设置 - 默认参数为周期 14,电平为 65/35。电平越高或越低,信号会更少但更准确 线图、仪表板和市场趋势的类型 显示设置 - 字体货币颜色、信号颜色、线条颜色以及 X 和 Y 轴对象的位置 计算机、电子邮件和图表警报

SuperOsma Arrow 是一个基于超级趋势 osma 的指标,可提供买入和卖出信号,该指标不可重新绘制,并配有显示信号统计数据的仪表板。
建议时间范围:15 及以上
买入:买入箭头出现在开盘柱上,设置图表上绘制的 TP 和 SL
卖出 : 卖出箭头出现在开盘柱上,按照图表上的绘制设置 tp 和 sl
===============================
仪表板显示历史信号信息:
1.胜率%
2.中奖人数
3、失败者有多少
4.连续获奖次数
5.连续输了多少次
6.盈利点
===========================
参数 :
1.超级趋势1期
2.超级趋势1倍数
3.超级潮流2期
4.超级趋势2乘数
5.超级潮流3期
6.超级趋势3乘数
7.osma设置
8.tp atr乘数
9.sl atr乘数
10.提醒
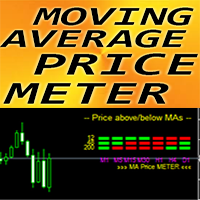
MT4 外汇指标“移动平均价格 METER”
使用这个有用的指标升级您的交易方法 - MA Price METER 非常适合“3 个屏幕”多时间框架交易方法 该指标将当前价格值与 7 个不同时间范围内的相应 MA 进行比较 绿框 - 价格高于相应的 MA 红色框 - 价格低于相应的 MA ............................................................................................................. // 这里提供更多优秀的 EA 交易和指标: https://www.mql5.com/en/users/def1380/seller 它是仅在该 MQL5 网站上提供的原创产品。

Smart Liquidity Levels is a valuable tool for identifying optimal liquidity levels, enabling retail traders like us to strategically set our stop-loss orders. T he essential tool for traders seeking to maximize their trading success. The liquidity level is a critical component of inner circle trading (ICT). It assists us in determining when and how we should enter the market. Watch the video for detailed instructions. Here's why understanding liquidity levels is crucial in trading and how our

Let us introduce you to a new era of neural indicators for financial markets! Intelligent Moving is a unique indicator that trains its neural network in real time! You no longer need to look for the optimal indicator parameters for each specific situation. No more late signals. The artificial intelligence is able to adapt itself and predict any market movements.
Visually, the indicator is drawn as a main solid moving average line, two dotted lines of standard deviations and signal arrows. For

With the help of this Practica Trend forex indicator algorithm, you can quickly understand what kind of trend is currently developing in the market. The Practical Trend indicator accompanies long trends, can be used without restrictions on instruments or timeframes. With this indicator, you can try to predict future values. But the main use of the indicator is to generate buy and sell signals.
The Practical Trend indicator is used in the forex markets. One of the main definitions for monitori

The Crit indicator analyzes price behavior and, if there is a temporary weakness in the trend, you can notice this from the indicator readings, as in the case of a pronounced change in trend direction. Entering the market is not difficult, but staying in it is much more difficult. With the Crit indicator, staying on trend will become much easier! This indicator allows you to analyze historical data and, based on it, display instructions for further actions on the trader’s screen.
A arrow tech

The Trahin indicator determines the prevailing trend. They help analyze the market on a selected time interval. Easy to set up and works on all pairs and all time intervals. Trend indicators make it possible to classify the direction of price movement, determining its strength. Solving this problem helps investors enter the market on time and get good returns.
For any trader, it is extremely important to correctly determine the direction and strength of trend movement. Unfortunately, there is
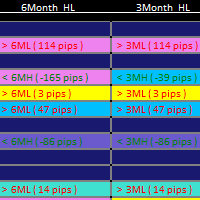
1. Updated usage instructions in blog below: Smart Market Structure Trading System and Automatic Scanner - Trading Systems - 13 October 2023 - Traders' Blogs (mql5.com) https://www.mql5.com/en/blogs/post/754495 2. YouTube video link for introduction: https://youtu.be/tMU04wo0bc8 3. The Smart Market Structure Opportunity Scanner is a great tool to find trading entries and exits based on Smart Money Concepts. It has a build-in custom choice of Forex pair lists to choose from for the scan, and

Candles Size ( Points ) Please leave a review about this product to help other users benefit from it. This simple tool provides crucial insights into current and historical market conditions, helping traders make informed decisions. Identify the longest candlestick over a customizable historical period. This information helps you spot significant price movements. See on YOUTUBE for key features This indicator is compatible with MetaTrader 4 The indicator is easy to install and use, making it
FREE

Discover the power of precision and efficiency in your trading with the " Super Auto Fibonacci " MT4 indicator. This cutting-edge tool is meticulously designed to enhance your technical analysis, providing you with invaluable insights to make informed trading decisions. Key Features: Automated Fibonacci Analysis: Say goodbye to the hassle of manual Fibonacci retracement and extension drawing. "Super Auto Fibonacci" instantly identifies and plots Fibonacci levels on your MT4 chart, saving you tim
FREE
"Maxi Super Signal" - Your Ultimate MT4 Signal Indicator! Are you tired of missing out on profitable trading opportunities? Look no further! Introducing "Maxi Super Signal," the must-have MT4 signal indicator that will revolutionize your trading experience. Key Features: Accurate Signals: Maxi Super Signal employs cutting-edge algorithms to provide you with highly accurate buy and sell signals. Say goodbye to guesswork and hello to informed trading decisions. User-Friendly Interface: Our intuiti

Nice Price Signal is a powerful and easy-to-use MT4 indicator that provides traders with accurate and reliable entry and exit signals. The indicator uses a variety of technical indicators to analyze the market and identify trends and reversals. Features: Accurate and reliable signals: The indicator uses a variety of technical indicators to analyze the market and identify trends and reversals. This helps to ensure that traders are entering and exiting trades at the right time. Easy to use: Th

The Royal Mint New indicator for MetaTrader is a trend-following system that analyzes the trend bias of any currency pair. It is a superior version of the regular Heiken Ashi indicator, designed with more advanced technical tools like the trend reversals, a T3 line, and the moving average. The T3 line of the indicator works as an extra layer of confluence to confirm when the moving average crosses over. Moreover, the Heiken Ashi bars of the indicator would change to blue to depict a potential bu
Indicador Gratuito desarrollado por Mr Beast Inversiones Mr Beast : Gestión de riesgo profesional. Brindo a la comunidad la entrada a productos de M Beast. Echar un vistazo a mis señales y expert advisors. Descuentos de hasta 70% Diclaimer: La negociación en Forex, CFD y Opciones conlleva un riesgo de pérdida sustancial y no es adecuada para todos los inversores. El alto grado de apalancamiento puede actuar en su contra y también en su favor, Antes de decidirse a operar en productos tan apalanca
FREE

This indicator is based on the MACD indicator
Also, some candlestick patterns are used in it to identify better signals
Can be used in all symbols
Can be used in all time frames
Easy to use method
Adequate settings
Settings: period: The number of candles used to calculate signals. pFast: Like the MACD indicator settings pSlow: Like the MACD indicator settings
alarmShow: If you want to receive an alert in Metatrader after receiving the signal, enable this setting alarmShowNoti: If you
FREE

This indicator is designed based on the Moving Origin indicator
When the moving origin indicator breaks the price, this indicator gives a signal
It is useful for better viewing of signals and analysis on them
Attributes: Can be used in all symbols Can be used in all time frames Too many signals Simple and quick settings Easy way to work
Settings: period: like moving average settings alarmShow: If you want to receive an alert in Metatrader after receiving the signal, enable this setting
a
FREE
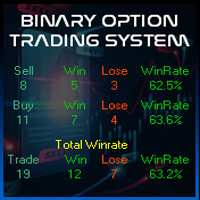
Buy And Sell Binary Option on the MetaTrader 4 (MT4) platform is a specialized technical analysis tool designed to assist traders in identifying binary option trading opportunities using the latest market algorithms. This indicator has been enhanced with an algorithm that incorporates the most up-to-date market information and processes it into a histogram. Additionally, the indicator comes with alert features, including pop-up alerts and email notifications. Latest Market Algorithm : Our indica

This indicator is based on the RSI indicator
Also, some candlestick patterns are used in it to identify better signals
Can be used in all symbols
Can be used in all time frames
Easy to use method
Adequate settings
Settings: period: The number of candles used to calculate signals. alarmShow: If you want to receive an alert in Metatrader after receiving the signal, enable this setting alarmShowNoti: If you want to receive an alert on your mobile after receiving a signal, enable this sett

If you are good at trading at levels This indicator is all you need levels to manage your trades Market is usually follow current trend when break out some levels or reverse
Trade at the Institutional traders level with the best supply and demand zone indicator available in MT4 and MT5 The Secret Profit Levels Signals indicator for MT4 is a complete trading system that provides traders with the entry price and 2 take profit levels. Technical analysts use support and resistance levels to iden
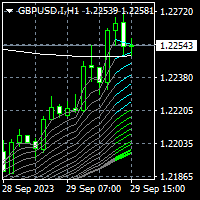
To get access to MT5 version please click here . - This is the exact conversion from TradingView: "CM Super Guppy" by "FritzMurphy" - This is a light-load processing indicator. - This is a non-repaint indicator. - This is not a multi time frame indicator. - Buffers are available for the lines on chart. - You can message in private chat for further changes you need. Thanks for downloading

Using signals generated by a single indicator can be risky while trading. This is because using just one indicator to trade can give more false signals. Thus, many forex traders used three or more indicators to filter out good trade setups. However, using multiple indicators for signals can also be complicating and confusing. This is especially true when these indicators are generating contradictory signals. The Super Arrow indicator, however, provides good signals by using multiple indicators.
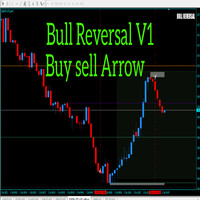
Alright. This indicator works on MT4 and is very easy to use. When you receive a signal from it, you wait for that candle with the signal to close and you enter your trade at the beginning of the next new candle. A red arrow means sell and a green arrow means buy. All arrows comes with a long dotted like for easy identification of trade signal. Are you okay with that?
100% non repaint
Work All Major currency Pair,
1 minute time frame 1 minute expire

Description: Expand the width of your candles horizontally in MT4 to improve visibility when zooming in or out of the chart. Once attached to the chart, the indicator will automatically double the size of the candles compared to their normal value. Main indicator inputs: Body: size of the candle body Wick: size of the candle wick Additionally, you have the option to change the color of the candle body. We hope you find this free and useful indicator enjoyable!
FREE

The strategy is based on Order-Block concept with MVB(Most Volatile Bar) concept. To determine a good zone of concern to focus for users, the zone are painted in blue and target levels are in thin redline. The mindset behind this indicator was to help users grow naturally while also making money trading. This strategy works so well on XAUUSD, the win rate is over 85%. To Buy! > Trader MUST see a Bullish Engulfing Candlestick pattern (HIGHER High, HIGHER Close Candle), at the Bank Zone (The Blu

Готовый Инструмент для Трейдера с большим арсеналом технического аспекта, который будет помощником в торговле! Индикатор имеет буферные стрелки, алерт, возможность настройки нужных уровней сигнала, возможность торговать на пробой и ретест! работать можно на любом инструменте, и любом таймфрейме. Можно регулировать цвета линий что бы было приятно использовать этот инструмент в своём торговом шаблоне!

以下是您提供的英文文本的中文翻译: 标题:揭开“非重绘 XY 趋势指标”的神秘面纱:您迈向外汇和二元期权成功的终极指南 在外汇和二元期权交易这个充满活力的世界中,保持领先至关重要。交易者一直在寻找可以为他们提供竞争优势的工具,而“非重绘 XY 趋势”指标就是这样一个强大的工具,在交易社区中掀起了波澜。 介绍: 非重绘 XY 趋势指标是一个革命性的交易工具,旨在帮助交易者在复杂多变的金融市场中做出明智的决策。这款精密的 MetaTrader 4 (MT4) 指标因其在消除重绘这一常见问题的同时,以惊人的准确性预测价格趋势的独特能力而广受欢迎。 理解指标: 非重绘 XY 趋势指标最突出的特点之一是其对准确性的承诺。与许多其他可能会重绘过去信号的指标不同,该指标保持其完整性。交易者可以对它生成的信号充满信心,因为他们知道这些信号准确反映了历史价格走势。 XY 趋势指标利用高级算法分析价格数据并识别市场趋势。无论您是经验丰富的交易者还是新手,该工具都能为您提供清晰可行的信号,帮助您做出更盈利的交易决策。 非重绘 XY 趋势指标的优势: **准确性:**该指标的主要优势是其非重绘特性,确保信号随

主要用途:"Pin Bars"旨在自动检测金融市场图表上的pin bars。 针杆是具有特征主体和长尾的蜡烛,可以发出趋势反转或修正的信号。
它是如何工作的:指标分析图表上的每个蜡烛,确定蜡烛的身体,尾巴和鼻子的大小。 当检测到与预定义参数相对应的引脚柱时,指示器会根据引脚柱的方向(看涨或看跌)在图表上用向上或向下箭头标记它。
参数: TailToBodyRatio-定义尾部长度和针杆主体尺寸之间的最小比率。 NoseToTailRatio-设置"鼻子"和销杆尾部之间的最大允许比率。 ArrowSize-定义标记的pin条与图表上指向它的箭头之间的距离。 应用:"Pin Bars"指标可用于识别潜在的趋势反转点,并产生进入市场或平仓的信号。 当正确使用并与其他技术指标和分析方法相结合时,该指标能够改善交易结果。 其他产品 : https://www.mql5.com/ru/users/yura1994ru/seller#products 重要事项: 该指标不是一个现成的交易系统,应该与其他分析工具结合使用。 建议在真实账户上使用指标之前,先在历史数据上测试和优化指标的参数
FREE

黃牛終端介面軟體是一個指標,它不從事自動買賣交易。 此指標顯示當前交易區域,當出現剝頭皮交易機會時可以進入交易。 當出現倒賣訊號時,相關交易對的右側,綠松石色燈亮起,並在其上方寫有確切的交易方向。 之後,點擊綠松石按鈕即可進入交易。 將開啟一個新分頁。 隨後,預計蠟燭收盤,這是進入倒賣交易的條件。
為了透過黃牛終端進行成功的黃牛交易;
請務必觀看說明部分中的影片。 像士兵一樣堅持使用黃牛終端軟體 。 每個交易對的右側有 5M、15M 和 DIRECTION 欄。 首先,點擊“通知”按鈕並將其設為綠色。 您無需一直注視著螢幕。 只需等待綠松石燈訊號或 Metatrader 警報訊息聲音即可。 閱讀上面寫的確切操作方向(也是方向欄文字),它是綠松石色的。 在確切的交易方向上,點擊綠松石按鈕進行倒賣。 在為剝頭皮交易打開的新選項卡中,像獵人一樣等待 pinbar 或吞噬蠟燭關閉。 當 pinbar 或吞沒蠟燭收盤是建倉條件時,按照黃牛終端指示的方向建倉。 在與持倉入場方向相反的一側添加止損單。 (例如,如果是多頭交易,則止損單的位置是最後收盤蠟燭的最低價位。) 然後,將您的止盈訂單

精密指数振荡器(Pi-Osc)由Precision Trading Systems的Roger Medcalf开发
版本2经过精心重新编码,以在您的图表上加载速度非常快,还加入了一些其他技术改进,以提高体验。
Pi-Osc旨在提供准确的交易定时信号,旨在找到极端的耗尽点,这些点是市场被迫去触及,以清理每个人的止损单。
该产品解决了一个古老的问题,即知道极端点在哪里,这使得交易员的生活变得更加简单。
这是一个高度复杂的共识指标,与行业标准的振荡器相比,具有一些强大的区别。
它使用的一些特征包括需求指数、资金流动、RSI、随机指标、模式识别、成交量分析、标准偏差极端点以及不同长度上述各种变化的分歧。
乍一看,对于未经培训的人来说,它似乎与任何其他振荡器没有什么不同,但当与其他振荡器(如RSI或动量等)相对比时,这个指标的真正威力开始显现。
据我所知,没有其他振荡器可以频繁地精确指出顶部和底部,具有相同的定期效率。
精密指数振荡器由许多不同的数学方程组成,用于测量多个时间框架采样中的价格和成交量变动,从而高度准确地预测趋势可能发生转折的位置。
PTS P
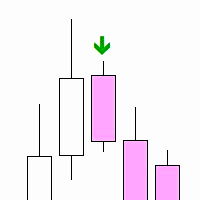
"Inside Bar PA" is a technical indicator designed to determine the inner bars on the chart. An internal bar is a bar or candle, the maximum and minimum of which are completely contained in the previous bar. This may signal a potential reversal or continuation of the trend, depending on the context.
Features: Automatic detection of internal bars. Visual marking of internal bars with arrows on the chart. The ability to adjust the distance of the mark from the bar. How to use: Attach the indicat
FREE

OVERVIEW
A Lorentzian Distance Classifier (LDC) is a Machine Learning classification algorithm capable of categorizing historical data from a multi-dimensional feature space. This indicator demonstrates how Lorentzian Classification can also be used to predict the direction of future price movements when used as the distance metric for a novel implementation of an Approximate Nearest Neighbors (ANN) algorithm. This indicator provide signal as buffer, so very easy for create EA from this in

Advanced Trend System 是一种使用专有算法的创新指标,可让您以高概率找到潜在的趋势反转点,并在趋势形成之初接收信号进入市场。该指标会跟踪当前的市场状况,只有当所有内部策略都达成一致并且彼此 100% 融合时,该指标才会给出买入或卖出信号。该指标是我自 2008 年以来的交易经验的结果!
指标优势
交易的理想切入点!
独特的过滤器允许您自定义发送推送通知和警报的时间。通知只会在您方便的时间出现,不会在晚上或您放松时打扰您。
可用于所有货币对、指数、商品和加密货币对。
简单的使用规则。
适用于剥头皮和日内交易。
没有重绘。
内置警报功能,能够在出现指示信号时向电子邮件和手机发送消息。
直观的功能,易于使用。
使用建议 买入信号:指标箭头指向上方。
卖出信号:指标箭头指向下方。
可能会出现多个连续信号在同一方向的情况。在这种情况下,在同一方向上开一个额外的头寸,不要关闭前一个头寸。见截图#4。只有当出现相反的信号时,才能关闭多个头寸。
参数 Period - 主要参数,负责指标计算周期的设置。 Time Begin

The Market Structures MT4 indicator finds and shows the Break Of Structures (BoS) pattern on the chart. The pattern is an important part of the Smart Money Concepts (SMC) system.
The appearance of a pattern means that the price breaks the last peak of an uptrend, or the last bottom of a downtrend. This indicates a change in the existing trend structure and the beginning of a new movement.
BOS is a technical analysis tool used to identify trend reversals.
The set of input parameters is simple
FREE
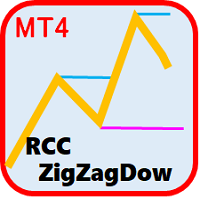
A formidable ally for historical testing with Fixed Perspective through ZigZag and Dow Theory, while also supporting ReviewCandleChart. A recommended tool for those troubled by 'lost perspectives.
Overview The 'RCCZigZagDow' indicator is a tool that assists in making judgments based on Dow Theory in relation to ZigZag waves. By using ZigZag waves as a basis to derive continuation points according to Dow Theory, it offers the advantage of ensuring that anyone can interpret trends in the same

基于CCI的顺势原理,改良使其成为即可辨别趋势的反转与其发展的方向,即在趋势行情当中来识别震荡走势的顶底衰减的指标。
特征 红色、绿色立柱体部分为当前周期下的趋势多头发展或空头发展。 蓝色线条为当前周期下的当前价格走势的位置和衰减情况。 红色线段的上下轨为价格走势极值趋势,蓝色线条达到价格红色线段上方为极值超买衰减区域,蓝色线条达到价格达到红色线段下方为极值超卖衰减区域。 黄色实线的上下轨为价格走势持续方向,蓝色线条高于黄色实线为持续多头发展,下破完结。蓝色线条低于黄色实线为持续空头发展,上破完结。 右侧看板,给出的是当前走位数字提醒,同时给出了当前趋势是涨、是跌的提醒,以及给出了可入场的区域提醒。 使用 作趋势交易者建议在1H周期下使用 ; 作快进快出震荡交易者建议在5M周期下使用 ;
FREE
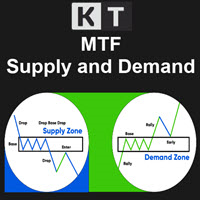
KT Supply and Demand indicator identifies and plots key supply and demand zones. It achieves this by analyzing swing points and integrating them with a multi-timeframe analysis, ensuring that only the most crucial supply-demand zones are highlighted. This advanced method highlights the regions where prices are likely to reverse, stemming from significant supply-demand zones established by recent price movements.
Features
Precision Analysis: Our refined algorithm is designed to accurately pi
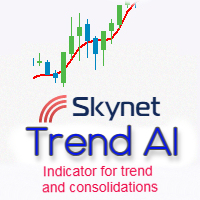
Skynet Trend AI shows trend on the price chart with a colored line. Usually, all traders are looking for a clue where to buy and where to sell using classic or downloaded indicators. But often it gets more and more confusing and every time you find it difficult and confusing to create a hint for yourself where to open a position. Self-reliance does not always justify the result. Therefore, it is better to use a simple and intuitive tool to solve your problem! Skynet Trend AI gives visual
学习如何在MetaTrader AppStore上购买EA交易,MetaTrader平台的应用程序商店。
MQL5.community支付系统支持通过PayPay、银行卡和热门付款系统进行交易。为更好的客户体验我们强烈建议您在购买前测试EA交易。
您错过了交易机会:
- 免费交易应用程序
- 8,000+信号可供复制
- 探索金融市场的经济新闻
注册
登录