适用于MetaTrader 4的新技术指标 - 8
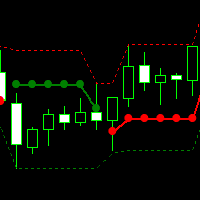
This technical indicator is particularly suitable for short-term traders, as it can quickly reflect the starting point and reversal of the trend. The red beads represent the rise and the green beads represent the fall, which can clearly and timely reflect the current market situation. The source code price can be calculated separately. If you need it, please contact us

ATR Progress Advisor
Overview
The indicator shows how far the current price has deviated from the daily open as a percentage of the daily ATR and provides clear textual recommendations for entries and profit-taking. A simple volatility filter to help make intraday and swing-trading decisions.
Key ranges and interpretation
<50% — "Good window for continuation entries"
Risk relative to ATR is low; trend-following entries with a normal position size are preferred.
50–70% — "Cautious entry, o

Designed to mark a specific price and time point on an MT4 chart based on a single mouse click, synchronizing this data across all timeframes for the same symbol. Its primary purpose is to help traders pinpoint and track critical levels or events (e.g., support/resistance or entry points) with persistent visual markers. The indicator uses dashed lines for price and time crosshairs, accompanied by labels that dynamically adjust to stay within chart boundaries, ensuring clarity regardless of win
FREE

Pullback Power: Catch the Trend, Maximize Your Profit! Tired of chasing trades and getting caught in market noise? The Pullback Power indicator is your essential tool for finding high-probability entries in a trending market. It's not about guessing; it's about trading with confidence, knowing you have a system designed to confirm genuine trend continuation after a brief pullback . This smart indicator combines the reliability of EMA Crosses for established trend direction with the dynamic conf
FREE
Edge Finder 11 i s your all-in-one visual trading assistant, designed to cut through the market noise and highlight high-probability trading opportunities at a glance. How It Works (The Core Idea): Instead of overloading your chart with complex numbers, Edge Finder 11 uses a unique, color-coded system to paint the market picture clearly. Trend & Momentum Visualization: The indicator analyzes the market and dynamically colors the price bars. Specific colors instantly tell you if the trend is st
Dominate the Market with the Laguerre Edge Signal Indicator! Stop guessing and start trading with confidence! Our Laguerre Edge Indicator is your ultimate tool for spotting high-probability entry points. This indicator combines the power of two classic analysis methods— moving averages for trend direction and the Laguerre RSI for pinpointing reversals —all filtered by the solid EMA 200 trend line . It's designed to give you clear, objective signals directly on your chart. Key Features and Adva
FREE

The Elsna ATR is a custom MetaTrader 4 indicator that combines two key features into one clean chart overlay: Average True Range (ATR) Display Calculates the current ATR value for the selected period (default = 14). Can show the value in pips or price units . Candle Countdown Timer Displays a live countdown showing how much time remains until the current candle closes. Updates every second, even when the market is quiet. This indicator helps traders quickly gauge market volatility
FREE
Classic ZigZag formula. But no lags and repaints. You can see on screenshots that it shows values between peaks and it is useful to test strategies based on indicator. Because sometimes people find a good idea about it but don't understand that repainting indicators have some things to keep in mind. The parameters are the same as original ZigZag indicator: Depth, Deviation and Backstep.
FREE
Unlock Unstoppable Signals : Your Edge in Trading Stop guessing and start trading with confidence! The Unstoppable Signals (BB-AO-MACD System) indicator is your all-in-one tool for catching high-probability moves in the market. We've fused the power of three proven indicators— Bollinger Bands (BB) , Awesome Oscillator (AO) , and MACD —into one simple system that gives you confirmed, non-repainting signals right on your chart. Why You Need This Indicator This isn't just another average tool;
FREE

Some short but nice algo giving signals and some ideas for stops. Five moving averages are used to find cross overs and create a zone. All periods and methods are adjustable but default values are optimized already. If you have lags on long history you can reduce MaxBars to make it work faster. Please comment if need to explain the parameters. Also any improvement ideas are welcome.
FREE
Unlock High-Confidence Trading with Flash Signal! Tired of signals that appear too late or repaint? The Flash Signal: EMA-Stoch System indicator is engineered to deliver timely, filtered trade entries, transforming complicated market analysis into clear, actionable buy and sell arrows. Stop guessing and start trading with conviction! Key Advantages: Why You Need Flash Signal Filtered for Quality: This isn't just a simple EMA crossover. We combine the power of three Exponential Moving Average
FREE
STRUCTURAL TREND LINES - MT4 Indicator
Simple indicator that automatically draws trend lines based on market structure.
Features:
- 3 degrees of structure detection (short, medium, long term)
- Configurable swing strength for each degree
- Single color per degree for clean visualization
- Adjustable number of lines per degree
- Customizable colors and line widths
How it works:
The indicator identifies swing highs and lows based on the strength parameter,
then connects these points to create t
FREE

Its primary motive is to overlay horizontal lines spaced according to multiples of the Average True Range (ATR), centered on a reference price from defined periods such as trading sessions, candlestick counts, or 12-hour intervals. This facilitates the identification of potential support and resistance levels or expected price ranges. Additionally, it marks major forex trading sessions (Sydney, Tokyo, London, and New York) with arrows to provide contextual awareness of market hours, enhancing d
FREE

Analyze volatility by clicking on a specific candlestick, which triggers the display of horizontal grid lines centered around the candlestick’s closing price, spaced by multiples of the calculated ATR. A vertical line highlights the selected candlestick, and an optional text label can display the ATR value in pips above the candlestick. The indicator is lightweight, using no buffers, and relies on chart objects for visualization. It includes error handling for invalid candlestick selections and
FREE
Avex Pro Signal is an advanced multi-timeframe trading indicator engineered for MetaTrader 4, combining EMA Energy analysis with Trend technology to deliver precise entry signals, dynamic stop-loss levels, and optimal take-profit targets. This indicator is designed for both scalping and swing trading across all currency pairs and timeframes. Core Features Feature Details EMA Energy System 15 synchronized EMAs displaying bullish/bearish momentum with real-time visual confirmation SuperTrend Algor

Z-Corr — это инструмент, разработанный для анализа корреляции между двумя валютными парами. Индикатор в реальном времени отображает отклонения в движении инструментов, помогая трейдеру определить моменты, когда валютные пары начинают расходиться, и своевременно открыть позицию для получения прибыли на их последующем схождении. Основные возможности: Отображает два инструмента и сравнивает их движение. Линии и гистограммы показывают текущую динамику отклонения пар. Жёлтая гистограмма сигнализирует
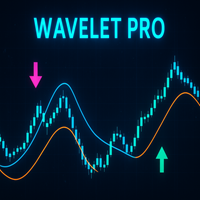
Wavelet Pro is a precision-engineered market analysis indicator designed for traders who demand clarity in complex price movement. It blends wavelet-style trend detection , quantum momentum shifts , and adaptive candle visualization into a unified trading framework. The system’s goal is to provide a refined visual representation of trend strength, phase changes, and market balance without lag or repainting behavior. At its core, Wavelet Pro constructs a dynamic dual-line wave structure that rea
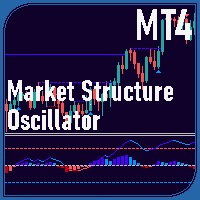
Market Structure Oscillator Overview The Market Structure Oscillator is a technical indicator designed for MetaTrader platforms to analyze market trends across multiple timeframes. It provides a clear visualization of short-term, intermediate-term, and long-term market structures through an oscillator and histogram display in a separate window. The indicator also supports optional chart objects to highlight key market structure points. Features Displays a composite oscillator combining short-ter
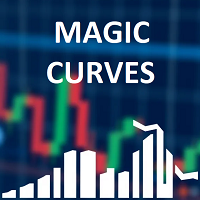
Indicator shows balance curves based on magic number for portfolio analysis. It allows to visually estimate different strategies performance on a single symbol. Any of magic number can be hidden by clicking on the value in legend. Parameters: HideAllOnStart - all magics are hidden and can be activated by clicking on its value; MAMode - shows average profit from trades; MAPeriod - Moving average period; Magics - a string with magic numbers separated by comma like "1,2,123". If this field is empty
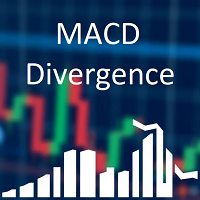
This indicator represents classic approach to MACD vs price chart divergence with some visual utility and alerts. It can draw lines to define the divergence on both chart or separate window. All is adjustable. The parameters are as follows. MACD: FastEMA, SlowEMA and SignalSMA. Additional: DrawIndicatorLines (to show values on separate window), DrawPriceLines (to show it on chart itself) and DoAlerts (to allow indicator to alert when signal comes).
Harmonic based indicator. Recognizes several patterns: ABCD, 3 Drives, Gartley, Butterfly, Bat, Atlternative Bat, Deep Bat, Crab, Deep Crab, Cypher and Shark. Able to set SL and three levels of TP based on Fibonacci Levels. Three types of alerts are available: PopUp, Email and Push. Trade advices on chart and stats also printed for visual estimation. All patterns are formed by not repainting ZigZiag. Parameters for it are classic: InpDepth, InpDeviation,InpBackstep. MinComplete means the level

Gina Dual TPO — Brief MQL4 indicator TPO + Volume profile overlaid on chart — fast, scalable, and beginner-friendly. Built for traders who read market structure by POC and Value Area. What it is An MQL4 indicator that overlays dual market profiles—Time-at-Price (TPO) and Volume-at-Price (VPO)—directly on your chart. It’s fast (pixel-based drawing), scalable, and beginner-friendly. Who it’s for Intraday and swing traders who read market structure via POC (Point of Control) and Value Area to spot
FREE
Boost your trading accuracy with the Binary KillerX Signal Indicator , specially designed for binary options platforms such as IQ Option, Pocket Option, Quotex , and more. This indicator works seamlessly on all timeframes , giving you clear, reliable signals without any repainting. Key Features: Non-Repainting Signals – Once a signal appears, it will never change, ensuring you trade with confidence. Universal Platform Compatibility – Works on all major binary options platforms, including MT4
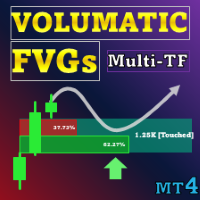
特别优惠 : ALL TOOLS ,每个仅 $35 ! 新工具 将在 第一周 或 前 3 次购买 内以 $30 提供! Trading Tools Channel on MQL5 :加入我的 MQL5 频道以获取我的最新消息 Volumatic Fair Value Gaps (FVG)用于识别并维护具有意义的价格不平衡区域,并对每个缺口内的方向性成交量进行分解。成交量取自较低时间框架(默认 M1,可由用户选择),按买入/卖出分配,并以两条百分比条呈现(总和 = 100%)。每个 FVG 的右侧还显示总成交量标签。根据用户设置,当价格穿越其相对边界(按收盘,更严格)或影线触及边界(按高/低,更敏感)时,缺口被视为已缓解并移除。
查看更多 MT5 版本: Volumatic Fair Value Gaps MT5 Multi Timeframe 查看更多 MT4 版本: Volumatic Fair Value Gaps MT4 Multi Timeframe 查看更多产品: All P roducts 概念与核心逻辑 FVG 定义 :三根K线形成的

Smart Structure Pro — 智能结构指标 (SMC) Smart Structure Pro 是一款专业级的市场结构指标,基于 Smart Money Concepts (SMC) 理论。
它可以自动识别并标注市场结构中的关键点:
结构突破 ( BOS )
性质变化 ( CHOCH )
诱导区 ( IDM )
主要波段结构点 ( HH, HL, LH, LL ) 核心特性 自动识别市场结构
精确检测 BOS、CHOCH 和 IDM
实时显示趋势方向(上升或下降)
可视化主要结构点(HH、HL、LH、LL)
可自定义颜色、字体和线条样式
适用于所有周期(从 1 分钟到 日线)
兼容所有交易品种: 外汇、加密货币、指数、股票 适合以下交易者: 使用 Smart Money Concepts 的专业交易者
需要清晰逻辑结构的市场分析师
寻找精准入场点的短线和日内交易者
追踪结构变化的波段交易者 可视化表现 指标显示: BOS 和 CHOCH 标签直接在图表上 IDM (

Super Signal – Skyblade Edition 專業級無重繪 / 無延遲趨勢信號系統,擁有卓越勝率 | 適用於 MT4 / MT5 核心特色: Super Signal – Skyblade Edition 是一套專為趨勢交易設計的智能信號系統。
其採用多重濾波邏輯,僅篩選出具有明確方向性、動能強勁且波動結構健康的走勢進場點。 本系統 不預測高點或低點 ,只有在同時滿足以下三項條件時才會觸發交易信號: 趨勢方向明確 動能持續增強 波動率結構穩定 此外,系統還結合市場流動性分析,以進一步提升信號的準確性與觸發時機。 信號特性: 所有箭頭信號皆為 100% 無重繪,無延遲 信號一旦出現即固定於圖表,不會閃爍或消失 提供圖表箭頭、資訊面板、彈出通知、聲音提示及推播訊息 支援 EA 呼叫(Buffer 輸出),可整合至自動化交易或信號跟單系統 提供預設參數模板,免調整即可使用,適合新手快速上手 所有數據皆採用「嚴格回測標準」——每筆交易訊號在觸發後的 60 根 K 線內,
EURUSD 與 USDJPY 至少須達成 +50 點獲利,黃金(XAUUSD)則須達成 +100 點

Crystal Smart Volume 概述 Crystal Smart Volume 是一款专为 MT4 平台开发的高级成交量与 Delta 分析指标,用于揭示隐藏在普通价格波动背后的机构交易活动。
它结合了 Smart Money Concepts (SMC) 、 Volume Spread Analysis (VSA) 和 Delta 逻辑 ,以同时分析价格与成交量的行为。
该指标能够识别关键市场事件,例如 Buying Climax(买入高潮) 、 Selling Climax(卖出高潮) 、 Weak Candles(弱势蜡烛) 以及 High-Volume Reversals(高成交量反转) ,帮助交易者精确捕捉市场的潜在转折点。 系统内置 TBR(Trap Break Reversal) 、 STBR(Sweep Trap Break Reversal) 与 EVR(Engulf Volume Reversal) 等反转形态识别模块,同时包含专业的六色成交量柱状图和实时 Delta 计算。
该指标拥有简洁直观的图形界面与极低的 CPU 占用率,非常适合专业日内交易员及依
FREE

AMD 自适应移动平均线 (AAMA)
AAMA 是一款适用于 MetaTrader 4 的自适应移动平均指标,可根据市场状况自动调整其反应速度。 主要功能: 基于 Kaufman 效率比的自适应移动平均线——在趋势行情中快速反应,在震荡行情中过滤噪音 自动识别四个 AMD 市场阶段:积累期 (Accumulation)、上涨期 (Markup)、分配期 (Distribution)、下跌期 (Markdown) 通过 ATR 实现波动性自适应——根据当前市场状况调整灵敏度 实时信息面板显示检测到的市场阶段、置信度和适应速度 多指标集成:结合 ADX、RSI 和 MACD 精确识别市场阶段 快速/缓慢参考区域,用于可视化自适应行为 使用方法:
指标会根据市场自动调整适应速度——在强趋势时反应更快,在盘整阶段更慢。可视化面板帮助理解当前的市场阶段。所有参数(周期、颜色、灵敏度)都可根据您的交易风格自由设置。

HiLoTren IQ7 — 智能市场边界和数据透视图 使用 AI 精度定义您的交易水平。
HiLoTren IQ7 是一种 基于智能枢轴的指标 ,可自动在图表上直接绘制 枢轴点 、 阻力(R1–R3) 和 支撑(S1–S3) 区域。
它提供了一个清晰的视觉框架来识别 市场边界、反转区域和趋势延续水平 ——所有这些都是实时计算的。 主要特点 自动枢轴引擎 — 立即计算每日枢轴、R/S 水平。 动态区域可视化 ——带有区域着色的自适应支撑/阻力线。 适用于任何符号 — 支持外汇、黄金、加密货币和指数。 即插即用设置 — 零配置简单。 限价单和止损单的理想选择 ——在价格做出反应之前可视化高概率进入区域。 IQ7 交易生态系统的一部分 Combine HiLoTren IQ7 with:
OSC HiLoTren IQ7 — trend confirmation & market structure.
Miracle IQ7 EA — automated execution using AI signals.
Predator IQ7 EA— dynamic momentum
FREE

介绍 Wikirobo — 支持所有周期的智能进场区间指标。
Wikirobo 会自动在所有时间框架上以 买入限价(Buy Limit) 和 卖出限价(Sell Limit) 的形式显示潜在进场点。
你可以等待价格触及建议的进场区间,观察价格是否在该区间反应或反转,然后根据自己的策略确认后再入场。
每个时间框架都会显示对应的 止损(Stop Loss) ,帮助你更好地管理风险和仓位。
该工具适用于剥头皮交易者、日内交易者和波段交易者,不论你的交易风格是什么。
使用 Wikirobo 时,只需 加入我们的 Telegram 频道 并下载最新数据文件:
@wikirobo
让指标为你指引 — 但策略由你决定。
Wikirobo:聪明的信号,更聪明的交易者。
FREE
这是免费产品,欢迎您使用!
也非常感谢您的五星好评!非常感谢!
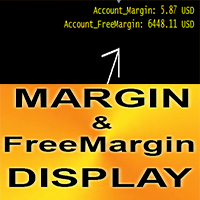
// 优秀的交易机器人和指标可在此处获取: https://www.mql5.com/en/users/def1380/seller ................................................................................................................. Crypto_Forex MT4 指标“保证金显示”,优秀的辅助交易工具。
- 该指标显示账户的当前保证金和可用保证金。 - 可在图表任意位置显示数值: 0 - 左上角,1 - 右上角,2 - 左下角,3 - 右下角 - 还可以设置颜色和字体大小。
这是仅在本 MQL5 网站提供的原创产品。
FREE

Green Days was created to eliminate confusion around the concept of "smart money" by turning structural shifts like BOS (Breakout of Structure) and CHoCH (Change of Character) into simple buy and sell trading signals. It simplifies structure-based trading by automatically recognizing breakouts and reversals as they occur, allowing traders to focus on execution rather than analysis. Whether the market is continuing a trend or preparing for a reversal, the indicator transforms complex price dyn
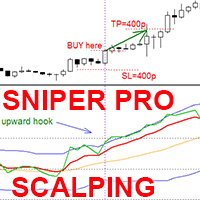
适用于 MT4 的 Crypto_Forex 指标 SCALPING SNIPER PRO ,无需重绘交易系统。 Scalping Sniper Pro - 是一款先进的系统(指标),可准确显示价格动量!
- 使用专业的 Scalping Sniper Pro MT4 指标升级您的交易方法。 - 该系统提供非常精准但罕见的信号,胜率高达 90%。 - 系统假设使用多个货币对来搜索信号,以弥补每个货币对信号数量不足的缺陷。 - Scalping Sniper Pro 包含: - 顶部和底部波动线(蓝色); - 中线(橙色或黄色)- 显示主要趋势; - 信号方向线(红色)- 显示局部趋势方向。 - 70 水平以上的区域 - 超买区域(请勿在此买入)。 - 30 水平以下的区域 - 超卖区域(请勿在此卖出)。 - 动量线(绿色)- 生成准确的入场信号。 - 时间范围:任意(本系统最佳时间为4小时)。 - 指标包含信息显示 - 显示当前外汇对的点差和隔夜利息。 - 信息显示还显示账户余额、净值和保证金。 - 信息显示可放置在图表任意位置: 0 - 左上角,1 - 右上角,2 - 左下角,3
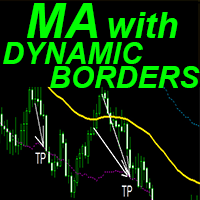
Crypto_Forex MT4 指标“带动态边界的移动平均线”。
- 该指标具有移动平均线的独特功能——动态波动边界。 - 动态波动边界使用平均真实波动范围值进行计算。 - 该指标非常适合止盈目标和边界线上的止损设置。 - 该指标也非常适合与价格行动信号结合使用。 ................................................................................................................. // 优秀的交易机器人和指标可在此处获取: https://www.mql5.com/en/users/def1380/seller 这是仅在 MQL5 网站上提供的原创产品。
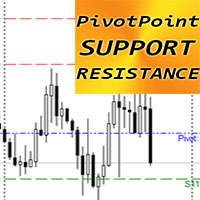
Crypto_Forex MT4 版“枢轴点支撑阻力”指标。
- “枢轴点支撑阻力”指标是价格行为交易中非常强大的辅助指标。 - 枢轴点是根据市场前一交易时段表现中重要价格的平均值计算得出的。 - 枢轴点本身代表最高阻力位或支撑位,具体取决于整体市场状况。 - “枢轴点支撑阻力”指标显示价格可能触及的最可能反转水平。 - R1、R2、R3 - 阻力位(红色)。 - S1、S2、S3 - 支撑位(绿色)。 - 可在设置中选择每日、每周和每月的前一交易时段进行计算。 - “枢轴点阻力支撑”指标非常适合通过价格行为模式规划您的止盈目标或价格反转。
如何使用指标: 1) 将指标附加到相应的图表。 2) 选择您需要的设置,然后按“确定”按钮。 3) 点击 MT4 中的不同时间范围(H1、H4、D1),进行指标的初始正确计算。
// 优秀的交易机器人和指标可在此处获取: https://www.mql5.com/en/users/def1380/seller 这是仅在 MQL5 网站上提供的原创产品。
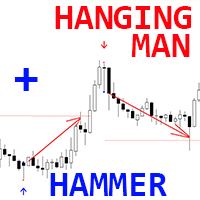
Crypto_Forex MT4 版“锤子线和上吊线形态”指标,无需重绘,无延迟。
- “锤子线和上吊线”指标是价格行为交易的强大指标。 - 指标可检测图表上的看涨锤子线形态和看跌上吊线形态: - 看涨锤子线形态 - 图表上显示蓝色箭头信号(见图)。 - 看跌上吊线形态 - 图表上显示红色箭头信号(见图)。 - 支持 PC、手机和电子邮件提醒。 - “锤子线和上吊线”指标非常适合与支撑位/阻力位结合使用。 ................................................................................................................. // 优秀的交易机器人和指标可在此处获取: https://www.mql5.com/en/users/def1380/seller 这是仅在 MQL5 网站上提供的原创产品。
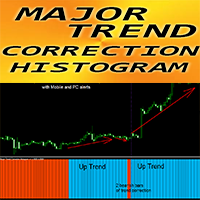
适用于 MT4 的 Crypto_Forex 指标“ Major_Trend_Correction Histogram ”,无需重绘。
- Major_Trend_Correction Histogram 指标旨在检测大趋势。 - 指标支持两种颜色:红色表示看跌趋势,蓝色表示看涨趋势(可在设置中更改颜色)。 - 至少连续 10 个相同颜色的直方图柱表示新趋势的开始。 - 指标内置移动端和 PC 端警报。 - 参数“Period”决定指标的灵敏度。
指标使用方法: 1) 检查至少连续 10 个相同颜色的直方图柱,如果出现,则表示新趋势的开始(蓝色表示看涨,红色表示看跌)。 2) 如果出现 1 或 2 个颜色相反的柱子,并且柱子颜色随后变回主趋势的颜色,则表明趋势正在修正。 3) 调整后,可以考虑:在主要上涨趋势中开启买入交易,或在主要下跌趋势中开启卖出交易。
// 优秀的交易机器人和指标可在此处获取: https://www.mql5.com/en/users/def1380/seller 这是仅在本 MQL5 网站上提供的原创产品。
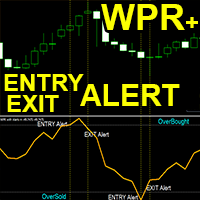
适用于 MT4 的 Crypto_Forex 指标“WPR 带警报”,无需重绘。
- WPR 本身是最佳的剥头皮震荡指标之一。 - 内置电脑和移动设备警报,适用于:进入超卖/超买区域以及退出超卖/超买区域。 - 警报触发级别可调。 - 非常适合在强超买区域(-10 以上)进行卖出操作,以及在强超卖区域(-90 以下)进行买入操作。 - 指标适用于任何时间范围。 - 该指标也非常适合与超卖/超买区域的价格行为操作相结合。 ................................................................................................................. // 优秀的交易机器人和指标可在此处获取: https://www.mql5.com/en/users/def1380/seller 本产品为原创产品,仅在 MQL5 网站上提供。
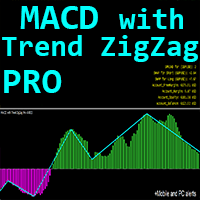
适用于 MT4 的 Crypto_Forex 指标“ MACD with Trend ZigZag Pro ”。
- MACD 指标本身是最受欢迎的趋势交易工具之一。 - “MACD with Trend ZigZag Pro”非常适合与价格行为入场或与其他指标结合使用。 - 使用此指标选择最准确的入场信号: - 如果 MACD 高于 0(绿色)且 ZigZag 线向上 - 仅搜索买入价格行为形态。 - 如果 MACD 低于 0(粉红色)且 ZigZag 线向下 - 仅搜索卖出价格行为形态。 - 内置移动端和 PC 端警报。 - 指标具有信息点差和掉期显示 - 它显示其所连接外汇对的当前点差和掉期。 - 显示屏还显示账户余额、净值和保证金。 - 您可以在图表的任意位置定位“信息点差掉期显示”: 0 - 左上角,1 - 右上角,2 - 左下角,3 - 右下角。
// 优秀的交易机器人和指标可在此处获取: https://www.mql5.com/en/users/def1380/seller 本产品为独家产品,仅在本 MQL5 网站上提供。

Super Signal Market Slayer 無重繪|高精準|多市場智能趨勢指標 在市場中,真正困難的不是下單,
而是在混亂的波動中,看清「趨勢是否已經開始」。 Market Slayer 正是為此而生。 這是一款專為日內交易設計的無重繪智能指標,
透過多層確認與趨勢過濾機制,只在關鍵時刻給出清晰、可信的 Buy / Sell 訊號。 核心優勢 無重繪信號
訊號一旦出現即固定,不回跳、不消失,所見即所得。 高精準趨勢判斷
經多品種實測,於黃金 M5 / M15 週期表現尤為穩定。 多市場支援
適用於黃金、外匯、指數與主流加密貨幣。 專為日內交易優化
聚焦 M5、M15,避免雜訊,提升可執行性。 清晰直觀
初學者亦可快速理解與使用。 技術邏輯簡述 Market Slayer 並非單一箭頭邏輯,而是整合: 趨勢方向識別 動量啟動確認 市場雜訊過濾 自適應靈敏度調整 只保留「值得出手」的交易機會,避免情緒化進場。 適合誰使用 想遠離隨機交易、建立紀律系統的交易者 對重繪與延遲指標感到厭倦的日內交易者 希望與 EA 或半自動策略搭配的使用者 使用建議 預設參數已針對黃金與外匯
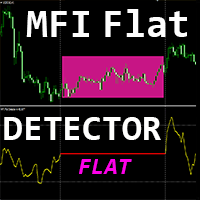
Crypto_Forex 指标“MFI 平缓探测器”是一款高效的交易辅助工具!无需重绘。 我推荐您使用这款适用于 MT4 的出色指标来升级您的交易方法。
- 指标在图表上显示价格平缓区域。它具有“平缓敏感度”参数,用于平缓检测。 - “MFI 平缓探测器”非常适合背离检测,并且非常适合与价格行为结合使用。 - 您可以将其用于趋势跟踪系统,以检测平缓区域并避免在该区域交易。 - 您可以将其用于反转剥头皮交易 - 从平缓边界进行反转交易。 - 有很多机会可以使用“MFI 平缓探测器”代替标准的 MFI 震荡指标。 - 资金流量指数 (MFI) 本身是一个技术震荡指标,它使用价格和成交量数据来识别超卖和超买区域。 - 当 MFI 高于 80 时,建议在超买时卖出;当 MFI 低于 20 时,建议在超卖时买入。
// 优秀的交易机器人和指标可在此处获取: https://www.mql5.com/en/users/def1380/seller 这是仅在 MQL5 网站上提供的原创产品。
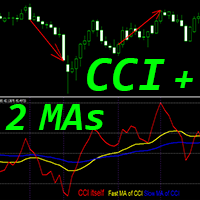
适用于 MT4 的 Crypto_Forex 指标“CCI 和 2 条移动平均线”,无需重绘。
- 商品通道指数 (CCI) 非常适合顺势交易,顺势而为。 - “CCI 和 2 条移动平均线”指标可让您查看 CCI 指标的快速和慢速移动平均线。 - 上升趋势 - 快速移动平均线位于慢速移动平均线上方;下降趋势 - 快速移动平均线位于慢速移动平均线下方。 - CCI 是最常用的交易震荡指标之一 - 它衡量当前价格与历史平均价格之间的差异。 - 指标重要水平:+/-200 - 选项 1:从 50 到 -50 之间的中心区域顺势建仓,当指标分别到达 200/-200 区域时平仓。 - 选项 2:在趋势方向,从 +200 以上区域卖出,从 -200 以下区域买入。 - 指标让您有机会尽早发现趋势变化。
// 优秀的交易机器人和指标可在此处获取: https://www.mql5.com/en/users/def1380/seller 这是仅在 MQL5 网站上提供的原创产品。
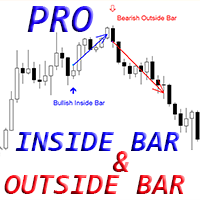
Crypto_Forex MT4 版“内柱线和外柱线形态专业版”指标。无需重绘,无延迟。
- “内柱线和外柱线形态专业版”指标对于价格行为交易非常强大。 - 指标可检测图表上的内柱线形态和外柱线形态: - 看涨形态 - 图表上显示蓝色箭头信号(见图)。 - 看跌形态 - 图表上显示红色箭头信号(见图)。 - 内柱线本身具有较高的 R/R 比率(回报/风险)。 - 提供 PC、手机和电子邮件提醒。 - “内柱线和外柱线形态专业版”指标非常适合与支撑位/阻力位结合使用。 - 指标具有信息显示功能 - 显示与其关联的外汇对的当前点差和隔夜利息。 - 信息显示还显示账户余额、净值和保证金。 - 信息显示可放置在图表的任意位置: 0 - 左上角,1 - 右上角,2 - 左下角,3 - 右下角。
// 优秀的交易机器人和指标可在此处获取: https://www.mql5.com/en/users/def1380/seller 本产品为独家产品,仅在本 MQL5 网站上提供。
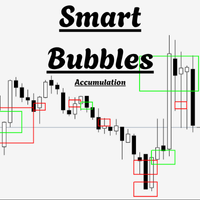
气泡指标 —— 价格减速 + 成交量激增检测 一个简单直观的可视化工具,当价格突然放缓并伴随成交量激增时,会在图表上显示彩色方块。
(包含填充功能与同心气泡效果)
它能帮助交易者更清晰地观察市场节奏,发现潜在的关键转折点。 指标功能: 识别市场在启动前“犹豫”的时刻 显示成交量放大但价格波动不大的区域 帮助提前发现潜在的突破信号 工作原理: 分析比当前图表更小的时间周期 检测异常小的K线(价格放缓) 检测异常高的成交量(成交量激增) 显示绿色(看涨)或红色(看跌)方块 主要设置: 价格敏感度: 数值越低,越敏感 成交量倍数: 数值越高,越严格 气泡大小: 调整显示效果 实用价值: 简单直观 无需复杂计算 发现有趣的市场结构与节奏 完全可自定义 非常适合用于区间交易、突破判断或理解市场动态。
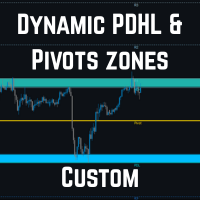
AutoPivot - 自动枢轴点指标 MT4 专业级指标,用于自动计算并显示每日、每周或每月的关键枢轴点(PP、R1、R2、R3、S1、S2、S3),同时标注前一交易日的高点与低点(PDH/PDL),帮助交易者快速识别潜在的支撑与阻力区域。 主要功能: 智能时间框架检测 :根据图表周期(H4、D1、W1)自动调整计算方式,确保在不同级别下均显示精准枢轴水平。 前日高低点标识 :自动绘制 PDH/PDL,并在图表中清晰显示与当前价格的相对位置。 支撑/阻力区域显示 :在 PDH/PDL 与相邻枢轴线之间生成半透明区域,帮助识别市场可能的反转带或突破区。 多主题外观 :提供 8 种预设配色方案(经典、暗色、亮色、蓝调、专业等),支持完全自定义颜色、线型与透明度。 价格与标签显示 :可选显示每条枢轴线对应的价格与紧凑型标签,不干扰图表视图。 自动刷新机制 :支持实时自动更新与手动刷新模式,确保在市场波动时数据始终最新。 ️ 轻量高效 :优化性能,不影响图表流畅度,可在多图表、多时间框架下同时运行。 AutoPivot 是日内交易者、波段交易者及技术分析
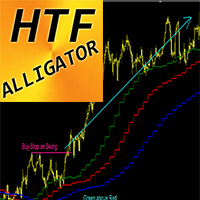
MT4 加密货币外汇鳄鱼线高位时间框架指标。
- 鳄鱼线指标是最强大的趋势指标之一。HTF 表示“高位时间框架”。 - 该指标非常适合趋势交易者,也可与价格行动入场相结合。 - HTF 鳄鱼线指标允许您将高位时间框架的鳄鱼线附加到当前图表。 - 仅当绿线高于红线且红线高于蓝线时才考虑买入入场 - 在图表上最新波动幅度的最大值处设置买入止损挂单。 - 仅当绿线低于红线且红线低于蓝线时才考虑卖出入场 - 在图表上最新波动幅度的最小值处设置卖出止损挂单。 - HTF 鳄鱼线指标提供低风险获取高额利润的机会。
// 优秀的交易机器人和指标可在此处获取: https://www.mql5.com/en/users/def1380/seller 本产品为原创产品,仅在本 MQL5 网站提供。
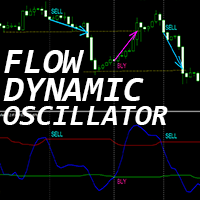
“动态流量振荡器”是一款高级自定义加密货币外汇指标,适用于 MT4 平台,高效交易!
- 新一代振荡器 - 参见图片了解如何使用。 - 动态流量振荡器具有自适应超卖/超买区域。 - 指标使用价格和成交量数据识别超卖和超买区域。 - 振荡器是一款辅助工具,可帮助您从超卖/超买区域找到准确的入场点。 - 超卖值:低于绿线,超买值:高于红线。 - 它比标准振荡器更精确。适用时间范围:30 分钟、1 小时、4 小时、1 天、1 周。 - 提供 PC 和移动端警报。 ................................................................................................................. // 优秀的交易机器人和指标可在此处获取: https://www.mql5.com/en/users/def1380/seller 本产品为独家产品,仅在 MQL5 网站上提供。

https://linktr.ee/ARFXTools
ARFX QUANTUM WAVE TRADING FLOW 1. Identify the Main Trend Activate the ARFX Quantum Wave Indicator on your chart. Observe the main signal direction — Buy or Sell . The wave thickness indicates trend strength — the thicker the wave, the stronger the trend. Focus only on the dominant direction shown by the indicator. 2. Use Price Action Patterns for Entry Enter trades following the Quantum Wave signal , confirmed by a Price Action Pattern ar
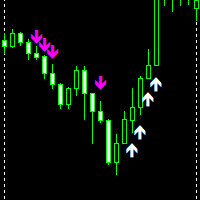
Up down Non-repaint is an MT4 indicator made to give accurate signals without disappearing. Magenta/Pink Arrow is your sell signal. white Arrow is your buy signal. indicator works on all pairs and timeframes 1 minute to Monthly timeframe. indicator is made for scalping do not hold trades for too long once arrows show the same direction you can add more entries all the best.!!
FREE
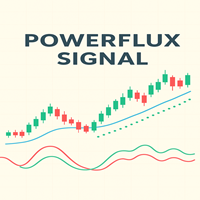
PowerFlux信号——一款无需重绘的强力箭头指标
PowerFlux信号是一款现代箭头指标,专为重视精准性、简洁性和及时信号的交易者设计。
该指标基于指数移动平均线(EMA)的交叉点开发,能即时捕捉趋势反转时刻,并提供清晰的买入或卖出视觉信号。
️ 工作原理
该指标采用经典但优化的双EMA交互公式——快速EMA与慢速EMA。
当快速EMA自下而上穿越慢速EMA时发出买入信号;自上而下穿越时则发出卖出信号。
PowerFlux信号通过箭头即时在图表上显示这些事件:
绿色上行箭头(柠檬黄)——买入信号,可能开启上升趋势。
红色下行箭头(正红)——卖出信号,可能开启下降趋势。
核心优势
无重绘——信号实时生成,蜡烛线收盘后不会消失。
高精度——采用经实践验证的EMA交叉算法,适用于所有时间周期。
简洁稳定——新手与资深交易者皆宜。
参数灵活——可调整EMA周期适应任意策略。
广泛兼容——支持所有货币对、股票、加密货币及差价合约。
资源消耗低——轻量化优化代码确保即使在低配电脑或VPS上也能高

Fair Value Gap Finder detects fair value gaps and generates a signal when price returns to one. Set the minimum and maximum fvg size, customize the colors, style, and length, then let the indicator highlight them for you.
Key Features: Automatic FVG highlights - The indicator detects all fair value gaps that fit your criteria and marks them on the chart.
Entry Signal - A signal is created whenever price retests a fair value gap.
Notification - Alerts notify you when a fair value gap
FREE

Institutional Flow Indicator A smart volume-based tool that detects institutional activity zones through direct order flow patterns.
It reveals where large institutions operate. An advanced volume indicator that filters out noise to identify probable institutional patterns. Key Features Smart cluster detection Automatic identification Signal classification: Violet / Yellow – Institutional Zone – Strong, sustained institutional activity Red / Green – Strong Signal – Significant buying/selling pre

What is the Super Ichi Indicator? Super Ichi is an advanced combination of Ichimoku Kinko Hyo and SuperTrend indicators. This powerful technical analysis tool is designed to identify market trends and generate trading signals. What Does It Do? Dual-Level Trend Analysis : Uses customized versions of Tenkan-sen and Kijun-sen lines Automatic Signal Generation : Displays visual markers (arrows) at crossover points Real-Time Alert System : Provides audio and visual alerts when new signals occur Dynam
FREE
**Squeeze Box Indicator** Squeeze Box is a powerful technical analysis indicator developed for the MetaTrader 4 platform, designed to support day trading strategies. This indicator analyzes market movements to detect bullish and bearish breakout signals, enabling traders to capture trends early. With its customizable features and user-friendly interface, it is ideal for both novice and experienced traders.
### Features and Functions - **Bullish and Bearish Signals**: Identifies market break
FREE
%R TREND EXHAUSTION INDICATOR - USER GUIDE The indicator displays three Williams %R lines (Fast, Slow, Average) in the range from 0 to -100 and generates visual signals when extreme zones are reached.
INDICATOR ZONES Overbought zone: above -20 Middle zone: from -20 to -80 Oversold zone: below -80 TRADING SIGNALS ARROW UP (blue) - MAIN BUY SIGNAL Appears when both lines (Fast and Slow) simultaneously exit the oversold zone. Indicates upward trend reversal, exh
What is Squeeze Momentum? Squeeze Momentum is an innovative technical analysis indicator popularized by John Carter in "Mastering the Trade" that detects compression periods in markets. This indicator analyzes volatility changes using a combination of Bollinger Bands and Keltner Channel. What Does It Do? Squeeze Detection : Identifies periods when Bollinger Bands move inside the Keltner Channel Momentum Measurement : Shows momentum changes through linear regression calculations Color-Coded Signa
FREE

Asset Fortress Signal Indicator v1.26 - Professional Trading System Asset Fortress Signal Indicator Professional MT4 Signal System for Beginners & Advanced Traders Core Philosophy: PATIENCE IS PROFIT Asset Fortress is designed around one fundamental principle: successful trading requires patience. This indicator doesn't just provide signals – it teaches you to wait for the RIGHT signals. Every feature is built to help you develop the discipline that separates profitable traders from the rest

Trend Movement Indicator Pro Precision. Clarity. Control. Trend Movement Indicator Pro is a next-generation analytical system that combines signals from 10 key technical indicators into one visual panel.
It’s designed for traders who make decisions based on objective data rather than emotions .
This tool does not attempt to predict the market — it reveals the current trend structure and strength of movement across multiple timeframes, helping traders act in the direction of real market momentum

Dear traders this is Our new Indicator called Hull Pro MTF Indicator — Precision Multi-Timeframe Trend Visualizer
Overview The Hull Pro MTF Indicator is a next-generation Heiken-Ashi-based multi-timeframe visual tool designed for top-down market analysis . It blends the power of Hull Moving Average (HMA) logic and multi-level Heiken-Ashi smoothing to reveal directional bias, volatility ranges, and price symmetry across hourly, daily, weekly, monthly, and yearly structures — all in a single c
Hull Max MTF Indicator — Advanced Multi-Timeframe Market Analyzer Overview The Hull Max MTF Indicator is a professional-grade technical analysis tool built for serious traders who perform multi-timeframe (top-down) market analysis . It combines the speed and precision of the Hull Moving Average (HMA) with advanced forecasting, projection zones, and adaptive visual styles — helping traders clearly understand trend alignment across hourly, daily, weekly, monthly, and yearly structures in one ch
POC, Volume Profile, Market Profile, Volume Indicator, Dynamic POC, Tick Volume, Forex Volume The Dynamic POC Hi Tf Arrow indicator is a reliable volume analysis tool (volume profile, market profile, tick volume) for accurately determining POC levels and price reactions. Dynamic POC Hi Tf arrow for MT4 Description Dynamic POC Hi Tf arrow is a professional volume analysis indicator designed to accurately identify key price levels and market direction.
It is built on tick volume data and displ
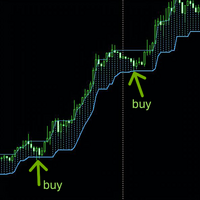
TrendHackPro – The Ultimate High/Low Peak Trend Detector
Dominate the markets with precision trend detection powered by institutional logic. TrendHackPro is a professional-grade trading indicator that combines price action, volatility, and momentum into one clean, intuitive visual system. Designed for traders who demand accuracy, clarity, and results — this is not just another moving-average tool.
Core Concept
TrendHackPro analyzes market structure through a proprietary blend of ad

The indicator is a multifunctional tool for automating the analysis and visualization of the trading process. Main features:
News display — the indicator automatically loads and displays economic news on the chart, allowing you to take into account important events when trading. Dynamic timeframe change — during the news release, the chart switches to a preset period for more detailed analysis. Adapting to the number of orders — the timeframe can change automatically depending on the number of
FREE
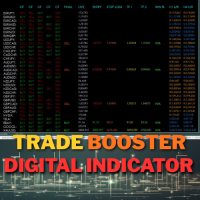
Digital Indicator version 7.0 is designed to GOLD, Oil, Indices, Crypto, FOREX trading. With Zero ideas and Knowledge of trading you can make a vey handsome profit with this Indicator on daily basis.
Digital Indicator v7.0 is highly advanced with high accuracy. Here i have added direct Current Live Price, Entry Price, Stop Loss, Take Profit 1, Take Profit 2, H1 Support n Resistance, H4 Support n Resistance .
In this version i have added AI enabled WIN% probability which will show the win

Unlock Smarter Trading with the Bands Breakout! Are you tired of confusing charts and missed opportunities? Get clear, high-probability entry and exit signals right on your chart with the Bands Breakout indicator! This isn't just another indicator; it's a complete, trend-aware system designed to simplify your trading decisions and focus only on the best moves. Our unique engine combines the momentum power of the EMA 10 with the volatility framework of the Bollinger Bands to find definitive buy
FREE

Gold Rush Signal Pro: Triple-Filter Precision Indicator Tired of false signals and getting whipped out by market noise? The Gold Rush Signal Pro indicator is engineered to cut through the confusion, providing you with high-probability trading opportunities powered by three layers of filtering. This is not just another Moving Average tool—it's a complete system designed for precision. Why You Need Gold Rush Signal Pro This indicator is your competitive edge, focusing on market confluence to e
FREE

Blue Quark
- Blue Quark can be used on all timeframes.
- With Blue Quark you can trade on all currency pairs.
- The indicator does not repaint.
- With the help of 200 SMA or other preferred indicators, losses can be minimized.
- Trading signals are displayed by blue and red arrows.
- The Blue Quark indicator displays very good signals on BTCUSD.
- For this indicator to work, you need to download the TMA+CG mladen NRP indicator, which you can find in the first comment.
This indicator is

Unlock Smarter Trading with Triple Candle Trend! Stop chasing signals and start trading with confidence and confluence . The Triple Candle Trend indicator is your all-in-one system designed to cut through market noise and deliver high-probability entry points. We don't rely on a single factor; we combine the power of three confirming tools into one clear signal! Why You Need This Indicator: Filter Out Noise, Find the Trend: This system uses the mighty EMA 200 as a foundational trend filter. If
FREE
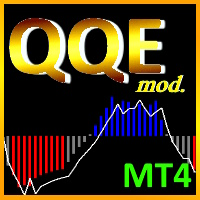
The Quantitative Qualitative Estimation (QQE) indicator is derived from Wilder’s famous Relative Strength Index (RSI). In essence, the QQE is a heavily smoothed RSI.
Modification of this version: ( converted from tradingview script by Mihkell00, original from Glaz, 100% identical output)
So there are Two QQEs. One that is shown on the chart as columns, and the other "hidden" in the background which also has a 50 MA bollinger band acting as a zero line.
When both of them agree - y
Algorithmic & Quant Strategies Signals Dashboard for MT4 Take your forex trading to the next level with the AQS Signals Dashboard , a comprehensive and powerful tool designed for serious traders. This indicator eliminates the need to constantly switch between charts by providing a centralized, all-in-one dashboard that monitors the entire forex market for you. Built on a foundation of proven algorithmic and quantitative trading principles, the AQS Dashboard delivers clear, actionable trade signa
学习如何在MetaTrader AppStore上购买EA交易,MetaTrader平台的应用程序商店。
MQL5.community支付系统支持通过PayPay、银行卡和热门付款系统进行交易。为更好的客户体验我们强烈建议您在购买前测试EA交易。
您错过了交易机会:
- 免费交易应用程序
- 8,000+信号可供复制
- 探索金融市场的经济新闻
注册
登录