适用于MetaTrader 4的新技术指标 - 101
Trend Scanner is a trend indicator that helps to determine the current and forecast market direction using an advanced algorithm. Thanks to flexible alert settings, the indicator will promptly warn you about a trend reversal. The indicator is intuitive and easy to use, and will be an excellent filter in your trending trading strategies. The lines of this indicator are also an excellent dynamic level for stop loss, and is used as one of the types of trailing stop in Trading Panel . To fine-tune t

BeST Oscillators Collection is a Composite MT4 Indicator including the Chaikin,Chande and TRIX Oscillators which by default are contained in MT5 but not in MT4 platform. It also provides the option of displaying or not a Mov. Avg. as a Signal Line and the resulting Signals as Arrows in a Normal (all arrows) or in a Reverse Mode (without showing up any resulting successive and of same type arrows). Analytically for each one of the specific Oscillators: The Chaikin Oscillator ( CHO ) is
FREE
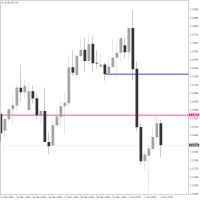
Crosshair Levels : Free version of Object Synchronizer. ** No synchronization of objects among grouped charts and no group chart features supported in this version. Are you bored to save and load template many times for the same symbol for many chart time frames? Here is the alternative. With this indicator, you enjoy creating 3 objects. All objects that you created/modified always are moved easily with clicking the object, moving cursor to the point you wanted and clicking again). Supported
FREE
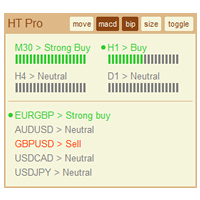
The indicator High Trend Pro monitors a big number of symbols in up to 4 timeframes simultaneously and calculates the strength of their signals. The indicator notifies you when a signal is the same in different timeframes. The indicator can do this from just one chart. Therefore, High Trend Pro is a multicurrency and multitimeframe indicator. High Trend Pro uses emproved versions of popular and highly demanded indicators for calculating its signals. High Trend Pro calculates the signal strength

The indicator My Big Bars can show bars (candles) of a higher timeframe. If you open an H1 (1 hour) chart, the indicator puts underneath a chart of H4, D1 and so on. The following higher timeframes can be applied: M3, M5, M10, M15, M30, H1, H3, H4, H6, H8, H12, D1, W1 and MN. The indicator chooses only those higher timeframes which are higher than the current timeframe and are multiple of it. If you open an M30 chart (30 minutes), the higher timeframes exclude M5, M15 and M30. There are 2 handy
FREE

Trump Day Indicator for Effective Profitable Binary Options Trading
complete lack of redrawing
The arrow indicates the direction of the next candle and the possible trend direction.
Percentage of correct indicator predictions from 80%.
its benefits:
signal accuracy. complete lack of redrawing. You can choose absolutely any tool. indicator will provide accurate signals.
It is recommended to open trades for 2 - 3 candles. Pros indicator: 1. forward signals. 2. high accuracy of the repo

Dark Sniper arrow indicator.
complete lack of redrawing
percentage of correct indicator predictions from 80 85%
The arrow indicates the direction of the next candle and the possible direction of the trend in the future. suitable for small m1 timeframes. It is recommended to open deals from 1 to 2 candles. The signal appears on the last candle advantages of the indicator: 1. leading signals.
2.complete lack of redrawing
3. high signal accuracy.

Open High Low Close Внешняя Свеча
Индикатор внешних свечей наложенных на график с выбранными вами тайм фреймом.
Наглядно отображаете уровни OHLC и пройденное значение ATR текущей свечи и свечей в истории.
OHLC — аббревиатура, дословно расшифровывается как:
O — open (цена открытия интервала (бара или японской свечи)).
H — high (максимум цены интервала).
L — low (минимум цены интервала).
C — close (цена закрытия интервала).
Данный индикатор наглядно покажет трейдеру, уровень открыт
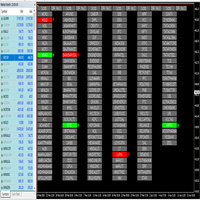
* Compatible with MCX, NSE, Futures, Forex. * No need to monitor individual script. * Sound Alert and Popup on new signal. * Change Number of previous candles to signal to be generated. * Single Click To See Live Chart From Defined Templates * Custom List of Script Can be Made
*Parameters of Each Indicator can be changed for Scanning * Scan based on multiple indicators like: - Moving Average Crossover (All Types of MA) - RSI - Parabolic SAR - Stochastic - M

This indicator mostly inspired from BW-ZoneTrade custom indicator from MT5. How To Use:
BUY when both dots colored Green. SELL when both dots colored Red. In addition to original one, MACD-OsMA-generated signal also can be drawn. Input Description:
MA_period_short: Faster EMA period for MACD. Applied when drawMACD is true. MA_period_long: Slower EMA period for MACD. Applied when drawMACD is true. MACDperiod: MA period for MACD. Applied when drawMACD is true. drawMACD: When true, draw an addi
FREE

KT Trend Magic shows the trend depiction on chart using the combination of market momentum and volatility. A smoothing coefficient is used to smooth out the noise from the signal.It can be used to find out the new entries or confirm the trades produced by other EA/Indicators.
Usage
Drag n drop MTF scanner which scans for the new signals across multiple time-frames. Find new entries in the trend direction. Improve the accuracy of other indicators when used in conjunction. Can be used as a dyna

This indicator displays XR Power Trend movement.Indicator displays Moving Average period 5,Moving Average period 26,Moving Average period 52,Commodity Channel Index,MACD,Average Directional Movement Index,Bulls Power,Bears Power,Stochastic Oscillator,Relative Strength Index,Force Index,Momentum,DeMarker,average movement.Indicators period is standard period.
Features X - move the trend left and right. Y - move the trend up and down.
How to understand the status: If the Trend color is green

Introduction
This indicator alerts you when certain price levels are reached. The alert can be on an intrabar basis or on a closing price basis. It will also send alerts when one forms, including via e-mail or push notification to your phone . It's ideal for when you want to be notified of a price level being reached but don't want to have to sit in front of your chart all day.
Input Parameters
DoAlert: if set to true a desktop pop-up alert will appear from your MetaTrader terminal whe
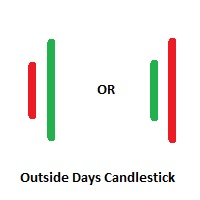
Outside Days Candlestick Bulkowski The Outside days candlestick is a well-known candle pattern composed of two candles. This indicator for showing outside days candlestick that describe by Thomas Bulkowski.
If you need for MetaTrader 5 version, please visit here: https://www.mql5.com/en/market/product/34406
Feature Highlights Show outside days candlestick. Customizable "Symbol". Customizable symbol distance from candlestick.
Input Parameters Symbol - Input symbol code from "wingdings" for

KT Pin Bar identifies the pin bar formation which is a type of price action pattern which depicts a sign of reversal or rejection of the trend. When combined with support and resistance, BRN and other significant levels, Pin Bar pattern proved to be a very strong sign of reversal.
Basically, a pin bar is characterized by a small body relative to the bar length which is closed either in upper or lower 50% part of its length. They have very large wicks and small candle body.
A pin bar candlest

KT Auto Fibo draws Fibonacci retracement levels based on the ongoing trend direction. The Highs and Lows are automatically selected using the Maximum and Minimum points available on the chart. You can zoom in/out and scroll to adjust the Fibonacci levels accordingly.
Modes
Auto: It draws the Fibonacci levels automatically based on the chart area. Manual: It draws the Fibonacci levels only one time. After that, you can change the anchor points manually.
Usage: Helps to predict the future pr

KT Psar Arrows plots the arrows on chart using the standard Parabolic SAR indicator. A bullish arrow is plotted when the candle's high touch the SAR. A bearish arrow is plotted when the candle's low touch the SAR. The signals are generated in the real-time without waiting for the bar close.
Features
A beneficial tool for traders who want to experiment with the trading strategies that include the use of Parabolic Sar indicator. Can be used to find turning points in the market. Use custom PSA
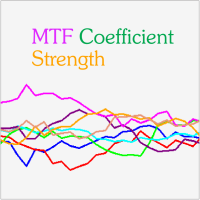
MTF Coefficient Strength is a Currency Strength Indicator based on RSI. It gives the strength of the 8 major currencies. What makes this indicator different from similar products are the following features : Choice between Classical Mode and Multi-Timeframe Mode. The MTF (Multi-Timeframe) Mode uses an averaging of the values coming from the different Timeframes. Possibility to use a Coefficient for each Timeframe separately. Possibility to draw Horizontal Lines in order to quickly compare lev

使用作者开发的过滤方法的 “ 敏感信号 ” 指示器允许以高概率建立真实趋势运动的开始。该指标过滤随机价格走势,因此对货币兑换交易非常有效。作者开发的过滤在几次迭代中进行,揭示了常规价格运动的真实轨迹(更确切地说,这种运动的最可能的曲线)并绘制它。 “敏感信号”指示器的指示生动,非常简单,不需要注释。蓝色三角形位于价格运动的常规成分的上升趋势中,红色三角形呈下降趋势。因此,当红色三角形被蓝色替换时,买入的入口点。当蓝色三角形被红色替换时,您需要打开一个卖出位置。 指标的敏感度级别由选项决定 « Select sensitivity level» 。同时,您需要了解增加灵敏度级别不仅会减少信号的延迟,还会增加发出错误信号的可能性。 箭头也指示了价格走势发生变化的可能时刻。 指标还认为止盈是信号后价格达到的最可能值。
该指标计算并显示止损仓位线,该止损位线是根据价格概率的当前分布以及趋势逆转之前由止损价平仓的所选概率水平来计算的。 该指标还具有内置的资金管理功能,您可以在其中基于接受的风险水平,存款金额和止损仓位来计算手数。

This indicator displays entry and exit points in the market. The indicator is based on Parabolic and various mathematical and statistical methods to increase profitability and reduce the number of losing trades. The indicator helps in many cases to skip false inputs, the support and resistance lines go around the price in a certain mode, reducing losses. The dashboard shows the results of the indicator so that you can adjust it more accurately and see how the parameters affect the result. The

The indicator displays the trading statistics of the analyzed Market signal on the chart. Signal transaction data is presented in an excel (csv) file and can be taken from the Signal>Trading history ( Export to CSV: History ). The copied file must be saved to the directory MT4>File>Open Data Folder>MQL4>Files. Available color management and font output. If the currency names are different on the Signal and User accounts, use the Prefix and Suffix parameters. Utility options Prefix at Signal -
FREE
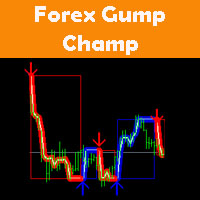
ForexGumpChamp is a professional trading system. With the help of this trading strategy, many well-known forex traders and investor managers work. We, as developers, have analyzed their trading strategy and converted it into a simple and clear indicator. ForexGumpChamp itself analyzes the market and gives the trader simple and clear signals to open and close deals. In order to make your work even easier and to eliminate the need to be constantly at your computer, we have integrated an alert syst

SmartStochasticMt4 is a universal indicator for making trading decisions. An indispensable tool for novice traders, as it has no settings and is ready to work after installation.
Advantages of the indicator:
1. Works with any trading symbol
2. Works on any time period
3. Has no configurable parameters
4. Provides a complete picture of the trading situation from different time periods
5. Not late
Working with the indicator
1. To set the indicator
2. To exclude from the time of the rel
FREE

FIBO ALERT https://www.mql5.com/en/market/product/34921
This indicator draws a fibonacci retracement (high and low) of a candle. It alerts and notifies the user whenever price touches or crosses the fibonacci levels. INPUTS ON Alert: set to true will alert pop up whenever price crosses levels at chart time frame. ON Push: set to true will send push notification to phone whenever price crosses levels at chart time frame. ===== FIBO (High & Low) ===== Time Frame: indicator draws fibonacci lev
FREE
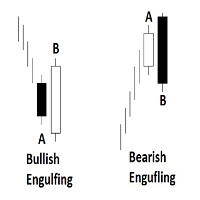
Engulfing Candlestick Bulkowski The engulfing candlestick is a well-known candle pattern composed of two candles. This indicator for showing engulfing candlestick that describe by Thomas Bulkowski.
If you need for MetaTrader 5 version, please visit here: https://www.mql5.com/en/market/product/34183
Feature Highlights Show bullish engulfing and bearish engulfing. Customizable "Up Symbol". Customizable "Down Symbol". Customizable symbol distance from candlestick. Customizable "Down Color". Cus

A simple but very useful indicator that allows you to display the current date and time on the chart. Especially useful when you save your analysis or trades.
Features: show local date and time show server date and time show remaining time to end the current timeframe interval customizable display parameters - show/hide date or time set display position set display size set display color works on every timeframe

Scalping Trender ***Specialized for scalping trading on timeframe 5m & 15m***
work best with: **USDMXN m5 **USDMXN m15 **GBPJPY m15 **EURJPY m15 **USDTRY m15 **EURTRY m15
Scalping Trender use smart algorithm detects the price circles with time . give strong signals at the right time as result of combine the price and time.
our team spent months to develop this indicator specially for Scalping..with high success rates about 89% win trades .
Advantages Easy, visual and effective

This indicator helps you to find price that may cause MACD Signal crossover on the current bar.. These crossover points are depicted in form of stars (like Parabolic SAR).
prevEMA line also helps you to decide the trend.
Get 20% OFF for rents for 1 year! How to use:
MACDSignalStars (Violet) stars displayed are the the prices that make the MACDmain = MACDsignal.
If the close price is higher than the star, then MACDmain > MACD signal. If the close price is lower than the star, then MACDmain
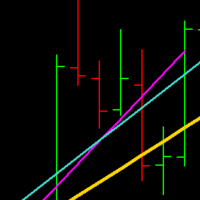
TrueRegression will calculate the linear regression of a given sequence of bars, and display the line of best fit on the chart. Regression is used to determine whether a market is currently trending, and whether sub-trends are occurring, which can hint at a potential breakout situation. The indicator will recalculate every 'n' bars (defined by the user input). When the indicator re-draws, it will keep the original lines on the chart, unmodified, so they can be referenced by a custom EA, or by th

Advanced Currency Strength Indicator
The Advanced Divergence Currency Strength Indicator. Not only it breaks down all 28 forex currency pairs and calculates the strength of individual currencies across all timeframes , but, You'll be analyzing the WHOLE forex market in 1 window (In just 1 minute) . This indicator is very powerful because it reveals the true movements of the market. It is highly recommended to analyze charts knowing the performance of individual currencies or the countries ec

This indicator will allow you to evaluate single currency linear regression.
WHAT IS LINEAR REGRESSION?(PIC.3) Linear regression is an attempt to model a straight-line equation between two variables considering a set of data values. The aim of the model is to find the best fit that can serve the two unknown values without putting the other at a disadvantage. In this case, the two variables are price and time, the two most basic factors in the Forex market. Linear regression works in such a wa
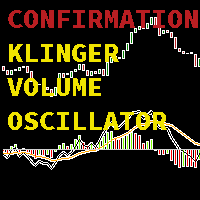
Or (KVO) determines the long-term trend of money flow while remaining sensitive enough to confirm short-term reversals.It u ses the key price, and increasing and decreasing bars compared to the prior bar's key price and increasing and decreasing bars to assign volume and the trend as positive or negative values. Volume is a measure of how many units of a pair are trading per unit of time, while the increasing and decreasing bars are a measure strength of the trend the trend .The Klinger Volume O

Update: For those who want to manually backtest this indicator, check this tool https://www.mql5.com/en/market/product/59248
The indicator will help make your calculation of stop loss easier as it will be visually aiding you in choosing where to put your stoploss level on the chart by calculating the current value of ATR indicator. For those who are unfamiliar with ATR, it is a useful indicator to calculate stoploss for trend following strategy. If volatility is high, ATR stoploss level will b
FREE

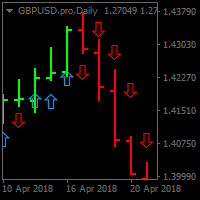
Almas Wall Street is a professional arrow indicator with no repainting. Signals appear simultaneously with the formation of a candle. Trading Guidelines: Enter a trade for at least 2 candles or on the next candle after the signal for 1 candle. Screenshot 5 . A red arrow pointing down suggests considering sales, while a blue arrow suggests buying. All you need to configure are the colors of the signal arrows. It is recommended to apply this indicator in scalping on timeframes M1-M5. Signals occur

Brilliant Wall Street is a professional arrow indicator. It is based on a mathematical calculation. thanks to a special calculation algorithm that was developed by the best specialists
he is not late, moreover, he gives advanced signals.
-----------almost complete absence of redrawing------------. signals appear with the advent of the candle.
It is recommended to enter a trade for at least 1-2 candles on the next candle, but you can also use a signal...
The red down arrow indicates

This is a dial indicator for trading from the level of support resistance
--- complete lack of redrawing ---
He is able to determine the levels of support resistance
Finds the best entry points and shows them with arrows.
If a trend is forming, the indicator will always notify with a arrow signal.
buy signal blue arrow for sale red arrow
This signaling tool can also be used on a sideways market. The main thing is that it is volatile.!!!!!!
The percentage of correct indicator pre
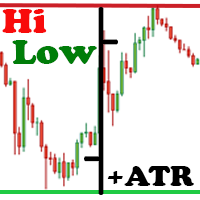
The Hi Low Last Day ( Hi Lo Last Day ) indicator shows the high and low of the last trading day and the second trading day. There are many trading strategies on the daily levels. This indicator is indispensable when using such trading strategies. In fact, everything is simple in trading, you just need to understand and accept it for yourself. There is only price!!! What is price? This is the level on the chart. The level is the price that the buyer and the seller are holding back. What price i

This indicator helps you to comfirm SMAs' crossovers by draw a signal line that determines SMA movement direction. when Short SMA cross above Long SMA and Close price is above the signal several bars later, then uptrend is expected. when Short SMA cross below Long SMA and Close price is below the signal several bars later, then downtrend is expected.
Input Description :
MA_Period_short: Short-term SMA's period. Used for short-term PriceX. Must be higher than 1. MA_Period_long: Long-term SMA'
FREE

Introduction Professional traders use pivot points as support/resistance levels or as an indicator of a trend. Basically, a pivot point are areas at which the direction of price movement can possibly change. What makes pivot points so popular is their objectivity as they are recalculated each time the price moves further. The pivot points indicator implements 5 popular pivot points calculation and drawing: Standard – The most basic and popular type of the pivots, each point serve as an indica
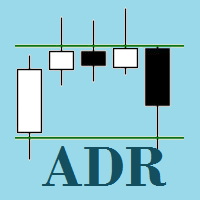
Average Daily Range (ADR) SR is an indicator which shows how far a currency pair can move in a day. It can be used to find hidden support and resistance levels (SR), estimate effective profit and stop loss targets, and provide short term trade signals from the hidden SR levels. Features
Automatically plots on the chat, the top and bottom of the ADR value (i.e. a horizontal channel) which acts as Support and Resistance Levels Automatically calculates the percentage of the ADR reached by the curr

This indicator will generate signal from other indicators like RSI, MA, Force Index etc into one confluent signal.
Which indicators to be used is up to the users to decide. You can add a simple MA, OsMa, RVI and ADX to see how these indicators will work out when combined together, an arrow will be drawn onto your chart where confluence happens.
And if that combination doesn't seem so good, then tweak the setting a little bit or remove it completely or add another different indicator, as you
Psychological or Round Levels indicator automatically draws lines or zones at the psychological levels (00 or 50) as the market moves. New lines are drawn as the market moves while the old lines are deleted. This ensures that your chart is clutter-free. The user specifies the number of lines preferred on the chat, and the indicator keeps the number of lines constant. The indicator plots two types of levels, the Main Level (00 levels e.g. USDCAD 1.33000, 1.34000) and the Sub Level (50 levels -

The indicator signals about "Impulse near!" or "Reversal point near!" The arrow-signal does not disappear and does not redraw after a bar closes. On next bar you may to open orders: buy stop && sell stop. Working timeframe: D1, H4, H1, M30, M15. The indicator parameters Momentum soon Period1 18 Calculation period 1 Period2 37 Calculation pe

KT COG is an advanced implementation of the center of gravity indicator presented by John F. Ehlers in the May 2002 edition of Technical Analysis of Stocks & Commodities magazine. It's a leading indicator which can be used to identify the potential reversal points with the minimum lag. The COG oscillator catches the price swings quite effectively.
MT5 version of the same indicator is available here KT COG Advanced MT5
Calculation of COG The COG indicator is consist of the two lines. The mai

Demarker levels cross Alert is a modified version of the classic Demarker indicator, with email and mobile alert when demarker cross High or Low levels, default levels setting are: low=0.1 and High=0.9 and Demarker of periode=10, you can modify all these entries to find the best setting for every Pair or Stock. Basically these Alerts are reversal Alerts, you will get: 1-Buy alert when Demarker cross above Low level. 2-Sell alert when Demarker cross below High level. -----------------------------

(目前 三十% 折扣)
在阅读该指标的描述之前,我只想向您介绍以下概念
移动平均线 - 仅基于一张图表的典型移动平均线。
货币强度线 - 某一货币对的移动平均线,其强度基于 二十八 对。可以说是真正的移动平均线。
移动平均线确实是几乎每个交易者都使用的最受欢迎的指标之一。
货币强度计也是一种基于多种货币的趋势指标。
移动平均货币强度计是一个图表指标,它为您提供带有货币强度计算法的移动平均线。
蓝色线是每个交易者使用的正常移动平均线。而红线是货币强度线。
指标参数
设置 调整时间框架 移动平均时间帧 - 从 M1 到 MN 选择您想要的时间帧 货币行周期 - 货币行的输入周期 *注意:输入“零”表示当前蜡烛。示例:周期为 0 的 D1 表示当前 D1 蜡烛的强度 移动平均线周期 - 移动平均线周期 方法 - 移动平均法 移动平均线移动 - 移动平均线的移动 价格 - 选择要使用的价格类型 点子交叉 - 移动平均线 和 货币强度线 之间的区别,用于判断货币对是趋势还是交叉 显示设置 字体 - 编辑字体 显示或隐藏优势、

仪表盘的意图是提供配置资产的日、周、月范围的快速概览。在 "单一资产模式 "下,仪表板会在图表中直接显示可能的反转点,从而使统计数据可以直接交易。如果超过了配置的阈值,仪表盘可以发送屏幕警报,通知(到手机MT4)或电子邮件。
使用这些信息的方式有多种。一种方法是,已经完成近100%日均运动的资产显示出逆转的趋势。另一种方法是观察资产,它的波动率与平均水平相比非常低。现在的挑战是如何从这个低波动性中交易突破。
这只是两种可能的策略,对于这些策略,仪表盘可以成为一个重要的辅助工具。发现各种可能性!
关于控件的完整描述,请观看我的博客文章( https://www.mql5.com/en/blogs/post/732999 )。
注意:这个指标不能在策略测试器中使用。所以这里来自市场的演示版本不能使用。请使用该指标的免费版本进行测试: https://www.mql5.com/de/market/product/33913
这是ADR-Dashboard的MT4版本。如果你想在MT5上使用,请到 https://www.mql5.com/en/market/produc

A unique author's strategy that simultaneously determines the trend reversal, entry points and estimated profit levels for each transaction. The indicator can determine entry points on any trading period, starting with the M5 chart to W1. At the same time, for the convenience of the user, an arrow is always drawn at a certain point and the recommended profit levels (Take Profit1, Take Profit2, Manual Take Profit) the Stop Loss level is also displayed.
A great advantage of the indicator Trend S

This indicator displays the histogram and arrows on chart. When Simple The Best Pro are placed on a chart, they identify the trend. The color of may be blue or red. The blue color stands for upside moves and the red color stands for downside trends. The indicator offers to set Stop Loss (SL) and Take Profit (TP) setting. The default value is ATR. Indicator has automatic optimization. The STB is a unique indicator that shows the tendency (button Bars) of a particular signals. The STB tells us

The SuPrEs indicator indicates the distance to the next horizontal line whose name begins with the configured prefix (see Options).
usage Draw support & resistance in the chart and let the indicator warn you, as soon as a configured distance is undershot. Use the prefix to provide alarms for other lines as well as standard lines (see screenshot with pivot indicator).
Display of the indicator The indicator displays the distance to the next line above and below the current (Bid) price. Not mor
FREE

The dashboard should help to get a quick overview of the correlations of different assets to each other. For this, the value series are compared according to the Pearson method. The result is the value of the correlation (in percent). With the new single asset mode, you can immediately see which symbols have the highest positive or negative correlation. This prevents you from accidentally taking a risk on your trades with highly correlated symbols. Usage
There are different methods for the cor

Principles of construction of the indicator. The Absolute Bands (AB) indicator is reminiscent of the Bollinger Bands indicator with its appearance and functions, but only more effective for trading due to the significantly smaller number of false signals issued to them. This effectiveness of the Absolute Bands indicator is due to its robust nature. In the Bollinger Bands indicator, on both sides of the moving average - Ma, there are lines spaced from Ma by the standa
FREE

This indicator allows you to analyze the hidden trends and correlations between the 8 most traded currencies via unique strength meter which creates multiple charts in a single window based on the price action of each currency in relation to all other currencies. The indicator also includes interactive panel where you can see the trends for all 28 pairs as well as the distance to the highest and the lowest price for the selected period. With this panel you can switch between currency pairs with

Scalping Binary option Pro is a dial gauge. --------complete lack of redrawing ---------
The indicator does not work correctly in the strategy tester.
The red down arrow indicates that sales should be considered, and the green one - up (purchases).
All that needs to be set up is the colors of the signal arrows, as well as the activation or deactivation of the sound signal when a signal appears in one direction or another.
It is best to use high-pair pairs with a small spread in tradin

The intention of the dashboard is to provide a quick overview of the daily, weekly and monthly range of configured assets. In "single asset mode" the dashboard shows you possible reversal points directly in the chart, thus making statistics directly tradable. If a configured threshold is exceeded, the dashboard can send a screen alert, a notification (to the mobile MT4) or an email. There are various ways of using this information. One approach is that an asset that has completed nearly 100% o
FREE
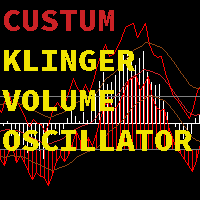
Or (KVO) determines the long-term trend of money flow while remaining sensitive enough to detect short-term fluctuations.It u ses the key price compared to the prior bar's key price to assign volume as positive or negative value. Volume is a measure of how many units of a pair are trading per unit of time.You can choose between a KVO line, histogram, or both combined with this Klinger Volme Oscillator.The Klinger Volume Oscillator is a trend reversal indicator. It relies on the concept of a vol

The dashboard should help to get a quick overview of the correlations of different assets to each other. For this, the value series are compared according to the Pearson method. The result is the value of the correlation (in percent). With the new single asset mode, you can immediately see which symbols have the highest positive or negative correlation. This prevents you from accidentally taking a risk on your trades with highly correlated symbols. Usage There are different methods for the corre
FREE
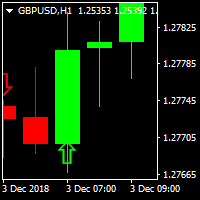
PIPs Forecast Indicator A traders perfect tool to catch big pips in the market One of its kind indcator that gets you in the game early enough
Supporting Multi-Currencies Works on all time-frames but if you're not a scalper stick to H1,H4,D1, W1 and MN for good results. Comes Pre-configured to ensure consitency Can be used alongside other indicators to avoid accumulation regions and Asian session ranges. For details, MT5 and EA questions feel free to contact me on elllykamau@gmail.com
Now wi
Highly configurable OBV indicator.
Features: Highly customizable alert functions (at levels, crosses, direction changes via email, push, sound, popup) Multi timeframe ability Color customization (at levels, crosses, direction changes) Linear interpolation and histogram mode options Works on strategy tester in multi timeframe mode (at weekend without ticks also) Adjustable Levels Parameters:
OBV Timeframe: You can set the lower/higher timeframes for OBV. OBV Bar Shift: Y ou can set the offs
FREE

The ' Average OHLC ZigZag ' indicator was designed for entry confirmations as well as scalping with a larger trend. A custom formula to average the last two bars to generate arrows following market trends with bar 1 confirmation.
Key Features An extreme scalper calculating the averages between the last two market periods to generate a buy or sell arrow. No settings are available due to it's simplicity of custom price action pattern and using repainting four OHLC prices.
Input Parameters Zig
FREE

EZT_Ichimoku_MTF
Multitimeframe Ichimoku indicator. Display up to 4 different Ichimoku on the chart. Every line of every ichimoku is customizable, you can turn off/on or choose different thickness or color. You can choose to see only the cloud in multiple ichimokus.
Optional info panel to identify the different Ichimokus. Works the same way like the original Ichimoku indicator.

MARKET PREDATOR 1 --------------------------------------------------- This powerful and reliable indicator is based on a custom trend following strategy. It does not signal against the obvious trend. No fancy and clouded charts. It is a simple but powerful BUY and SELL signals indicator. It is great for Day Traders and Scalpers too. Each currency pair works better with a specific timeframe so use the recommended timeframes with their respective pairs as below:
PAIR || TIMEFRAME =
BUY SELL SIG. Utilizing unique price calculations BUY SELL SIG . generates high quality signals Now Features easy to use and Buy and Sell signals for Pro and Novice traders Supports Multi-currency Best results viewed on H1,H4 ,D1 and W1 Timeframes Supports audio alerts and notifications. No complex input parameters just notifications and the indicator style properties

Price Momentum Index (PMI) Price Momentum Index (PMI) is a powerful and easy to use indicator. It can use for any currency and timeframe. Features Noise reduction. Trend detection. No lag. Good entry point detection. Good TP guide line. All in one window, easy to use and make decision. How to Use Prepare entry - When the PMI line (aqua) is between Signal (yellow) and Sinal2 (red) line. Entry - When the PMI (aqua) line breaks through Signal1(yellow) or Signal 2 (red) line. Exit - When the PMI li

In statistics, Regression Channel is a approach for modelling the relationship between a scalar response (or dependent variable) and one or more explanatory variables (or independent variables).We Applied relative strength index(rsi) values to develop regression models of various degrees in order to understand relationship between Rsi and price movement. Our goal is range prediction and error reduction of Price divergence , thus we use Rsi Regression
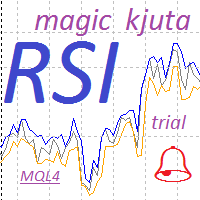
RSI magic kjuta trial is the demo version of RSI magic kjuta.
Custom Indicator (RSI magic kjuta) based on the standard ( Relative Strength Index, RSI ) with additional settings and functions. The maximum and minimum RSI lines on the chart have been added to the standard RSI line. Now you can visually observe the past highs and lows of RSI, and not only the values of the closing bars, which avoids confusion in the analysis of trades. For example, the EA opened or closed an order, but the RSI
FREE

Pivots Channels Breakouts presents 16 different formulas for Pivots Levels. It draws each one of them and also draws specific channels, trend histograms, and SL/TP levels derived from them . It includes commonly used formulas as Classic, Woodie, ATR, Fibonacci, Camarilla and Demark Pivots, and also presents never seen before formulas based on the Padovan mathematical sequence. Price often reacts at Pivots levels, and at Resistances (R) and Supports (S) of these formulas. That is why a lot of tra

This indicator helps the trader to make the final decision. When you have already decided in which direction the price will unfold, it remains as accurate as possible to determine the reversal itself. This is the task performed by the Konkov indicator. The indicator is installed on M1 and M5 charts. Indicator parameters: for M1 chart time_frame1 5 time_frame2
FREE

I present an effective tool for determining the reversal on the H4 timeframe. The indicator is installed on the M30 chart. All parameters are already set. Proper use of the indicator: Unfortunately, the test in the tester will not give a correct idea about the indicator, so the rent for one month is as affordable as possible. You do not need to install the file on a remote server. Install it
FREE

这是一个仓位风险可视化指标,指标可以让你清楚的看到,价格回撤到哪个位置会产生多大的亏损。 这是一个非常有用的用于控制风险的技术指标,在账户有开仓订单时,把技术指标附加到对应开仓订单的交易品种的图表上,技术指标就会在图表上绘制三条价格直线,此三条亏损百分比价格直线的默认值是10%、30%、50%,用户可自定义亏损百分比值,并且在左上角输出亏损百分比所对应的回撤点差。 亏损百分比价格直线的意义在于,让你可以清楚的看到使账户亏损的价格位置,可以让你更好的控制账户仓位大小,可以让你知道风险的情况下开出尽可能大的仓位,可以让你对账户所持有的仓位的风险做到心中有数。在你对行情有明确的判断时,可以尽可能多的持有仓位。 例1,多头开仓,在你认为市场价格不会低于某一价格时,那么只要亏损10%价格直线低于这一价格,你就可以继续买入开仓,直到亏损10%价格直线接近这一价格。只要市场价格高于亏损10%价格直线,账户的亏损就小于10%。 例2,空头开仓,在你认为市场价格不会高于某一价格时,那么只要亏损12%价格直线高于这一价格,你就可以继续卖出开仓,直到亏损12%价格直
您知道为什么MetaTrader市场是出售交易策略和技术指标的最佳场所吗?不需要广告或软件保护,没有支付的麻烦。一切都在MetaTrader市场提供。
您错过了交易机会:
- 免费交易应用程序
- 8,000+信号可供复制
- 探索金融市场的经济新闻
注册
登录