适用于MetaTrader 4的新技术指标 - 24

配备胜率计算系统的指标 【指标特点】 该指标可以让您通过信号标志直观、清晰地确认正常的技术分析。 此外,它还具有自动胜率确定系统,可以检查当前参数是否合适,并避免在胜率较低时发出信号。 这减少了不必要的入场,并允许您仅在胜率较高时进行交易。
【重要说明】 ・不可重新涂装。 可使用从 1 分钟到每周的图表。 ・无货币限制。 适用于所有货币对。 ・计算胜率的能力。 ・仅当达到预定胜率或更高时才会产生信号。 ・优化减轻负载! 适合长期操作和9种货币对同时使用。 ・作为众所周知的指标,它允许在跟踪信号的同时进行学习。 ・调试器已支持并验证调试以解决任何问题。
【价格范围标志说明】 PRICE RANGE是显示价格范围的指标,即价格的上限和下限。 它由 Evesense 开发,根据某些价格变动提供指示“何时出售”和“何时购买”的箭头符号。 它以简单而有效的方式根据历史数据计算“平均值”,非常适合 1 分钟和 5 分钟图表。 它也是一种多功能工具,能够处理突然的市场变化和意外的新闻。
【指标亮点】 ・在波动和快速变化的市场条件下表现强劲。 ・不适合持续波动的市场。
【入场信号

包含 12 种技术分析! 配备胜率计算系统的指标 【指标特点】 该指标可以让您通过信号标志直观、清晰地确认12种正常的技术分析。 此外,它还具有自动胜率确定系统,可以检查当前参数是否合适,并避免在胜率较低时发出信号。 这减少了不必要的入场,并允许您仅在胜率较高时进行交易。
【重要说明】 ・不可重新涂装。 可使用从 1 分钟到每周的图表。 ・无货币限制。 适用于所有货币对。 ・计算胜率的能力。 ・仅当达到预定胜率或更高时才会产生信号。 ・优化减轻负载! 适合长期操作和9种货币对同时使用。 ・作为众所周知的指标,它允许在跟踪信号的同时进行学习。 ・调试器已支持并验证调试以解决任何问题。
【ECHIDNA箭头符号说明】 ECHIDNA箭头指标是一种方便的工具,通过“箭头指标”提供全球著名的12种技术分析。 它的设计易于使用,允许单独的参数设置和删除不必要的指示器。 它根据您认为重要的技术方面使用箭头符号来指导您。
特征: ・通过“箭头符号”提供12种指标分析。 ・检查胜率并仅在达到预定胜率或更高时显示信号。 ・优化减轻负载,实现长期使用。
支持的指标: 01-MACD(
Candle Scanner Dashboard is an incredibly powerful tool in the financial markets. It excels at detecting market reversals, trend changes, and retracements. The dashboard displays patterns as they are identified, and with a simple click on each pattern, you can view them on their dedicated charts to precisely locate their occurrences. With its capability to detect 11 popular bullish and 11 bearish patterns, you can trust the dashboard to handle pattern identification effortlessly. It provides an
使用该工具快速分析市场结构,并利用重要的价格水平。
市场结构
该自定义指标绘制重要价位,可用作进场点或盈利目标。
确定交易范围
利用该指标,根据市场转折点进行剥头皮。
突破交易机会
使用该指标发现突破机会。这种交易策略具有极佳的风险回报比。
自定义警报
当价格突破特定交易区间时,您可以在手机上收到通知或电子邮件。如果您觉得需要根据自己的交易策略定制这些警报,请随时给我发信息。
智能资金概念
该指标是与自营交易商合作开发的,以遵循他们的智能资金理念。
设计简单
我们没有在图表上绘制所有可能的区域,而是决定只绘制我们认为需要关注的主要水平。因此,该指标非常简单,也是初学者的好工具
开放式支持
我们愿意根据您的交易需求定制该指标。如果您有任何建议或需求,请随时给我发消息。
输入: 警报: 信号形成时发送警报--启用后,每次指标形成新的支撑/阻力区时都会收到警报。
突破时发送警报 - 启用后,每当蜡烛收盘突破支撑/阻力区时,都会收到警报。
允许每个信号发出多个警报--发生突破警报时,如果打开此设置,当价格收盘回到突破

TrendStoch Channel Pro
Introducing our revolutionary indicator - "TrendStoch Channel Pro"! This powerful tool empowers traders to gain a comprehensive view of the market by seamlessly combining two essential features - observing larger time trends and the stochastic channel - directly on your chart.
With "TrendStoch Channel Pro," you'll experience a new level of trading precision. The indicator's ability to display larger time trends allows you to identify long-term market directions, enabli
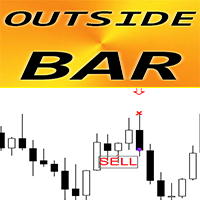
MT4 外汇指标 OUTSIDE 条形图
指标“OUTSIDE 条形图”是价格行为交易的非常强大的指标:无需重绘,无延迟; 指标检测图表上的 OUTSIDE 条形图: 看涨 OUTSIDE 条形图 - 图表上的蓝色箭头信号(见图片) 看跌 OUTSIDE 条形图 - 图表上的红色箭头信号(见图片) 包括 PC、移动和电子邮件警报 指标“OUTSIDE 条形图”非常适合与支撑/阻力位结合使用 ................................................................................................................... // 更多出色的专家顾问和指标可在此处获得: https://www.mql5.com/en/users/def1380/seller 这是仅在此 MQL5 网站上提供的原创产品。
Multicurrency indicator in table format. Signals appear with confirmation, no repaints. In the settings, you can select the number of candles/bars on which the signal will still be displayed so that the trader takes it into account and does not miss it. The indicator works on the current (open) timeframe. Notifications come for an open instrument. In the indicator settings, you can choose 1 of 4 Stochastic strategies Strategies (represented in screenshots): The main line crosses the signal line

This indicator identifies pinbar candlesticks on the chart and displays an arrow as a trade signal based on the candlestick pattern. It offers user-friendly features, including push notifications and other types of alerts. It is most effective for identifying entry points or potential reversals at premium or discount prices. Additionally, it works on any time frame.
FREE

Multicurrency indicator in table format. Signals appear with confirmation, do not redraw. The indicator works on the current (open) timeframe. Notifications come for an open instrument. The strategy includes: price touching the moving average in the direction of the trend, as well as an extraordinary recalculation of the classic ADX indicator to determine the trend as an additional filtering of entries. Entries are displayed on the chart as arrows and, as mentioned above, the arrows are not redr

The indicator is based on identifying engulfing candlestick patterns within the current timeframe. When such patterns are found, it generates buy and sell signals represented by up and down arrows, respectively. However, the user is responsible for determining the prevailing trend. Once the trend is identified, they should trade in line with the corresponding signal that aligns with the trend direction.
FREE

The indicator shows the Buy/Sell direction. The calculations use the opening prices and their rate of change for the billing period - "Calculation period" MTF indicator - "Calculation timeframe", no repaint - NRP. Two display types: "Chart default" или "Chart color" For "Chart color" color customization available : "Bar color" Two types stop levels: "Simple stop level" or "Dynamic stop level " Color settings: "Stop level color" Alerts available: "Chart message", "Push message", "Email message" F

All Symbols AND All Time frames Scan
Document Introduction
The ABCD is a basic harmonic pattern. The ABCD pattern is a visual, geometric chart pattern comprised of three consecutive price swings. It looks like a diagonal lightning bolt and can indicate an upcoming trading opp
VWAP Scanner is a multi-timeframe and multi-symbol dashboard and alert that checks all timeframes and symbols to find trading Opportunities based on Vwap Indicator
How to USE VWAP Scanner
First make a text file with name of Symbols Under Terminal\MQL4\Files
Write the name of symbols as its on mt4 with (,) to separate
Example :
EURUSD,USDJPY,USDCAD,GBPUSD,MCRO,MGLD,NIFTY Note- Its works in all Market And save this text file
Inputs of scanner
NameOfSymbolsTextFile = "Symbols
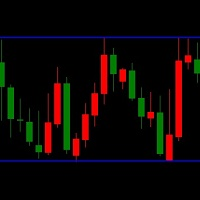
LT Triple Support Resistance Screen Method is a kind of levels indicator that consist of three SR lines. It is built by MQL4 programming language and can be used to MT4 platform. A free version indicator to determine the support and resistance levels easily This indicator works based on the screen method to calculate the most appropriate value for each buffer. A complex algorithm based on long research is applied to this free custom indicator. But this indicator has limited features and simpler
FREE
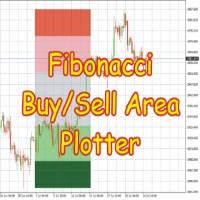
This Indicator is based on Fibonacci levels and draws Buy & Sell Areas. Buy areas are defined in green color (light green & dark green) while Sell areas are defined in red color (light red pink and darker color) Rectangles to easily know that whether price is in buy area or sell area. If price is in gray area, wait for price to come in to your desired area. You can use on any Forex Pairs.
This indicator calculates on the basis of h4 timeframe no matter what time frame you have selected, its cal

Indicator UU Bands สำหรับเทรดเดอร์ ที่ต้องการความแม่นยำ ในการเข้าเทรด หรือ หาจังหวะในการเข้าเทรด
ใช้ได้กับทุก ทามเฟรม
ข้อมูลของ อินดิเคเตอร์ 1. มี แบนด์ ด้วยกันทั้งหมด 7 เส้น 2. เส้น 3 เส้น ด้านบน เป็นแนวต้าน เคลื่อนที่ แนวต้านที่1 แนวต้านที่ 2 แนวต้านที่3 3. เส้น 3 เส้น ด้านล่าง เป็นแนวรับ เคลื่อนที่ แนวรับที่ 1 แนวรับที่ 2 แนวรับที่ 3 4. เส้นตรงกลาง เป็นเส้นแบ่ง เทรน สีเขียว หมายถึง แนวโน้มขึ้น สีแดง หมายถึง แนวโน้มลง 5. สัญลักษณ์ ลูกศร สามารถนำไปอ้างอิง เป็นจุดเข้าเทรดได้
คำแนะสำหรับกา
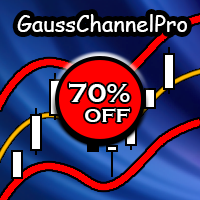
MT5 Version GaussChannelPro is a powerful and innovative trading indicator designed to enhance your trading strategy with the precision of Gaussian-based channels. Leveraging the principles of Gaussian (normal) distribution, this indicator creates a unique channel on your price chart, offering valuable insights into market trends and potential turning points. Utilizing advanced statistical analysis, GaussChannelPro calculates the optimal channel boundaries based on historical price data, present
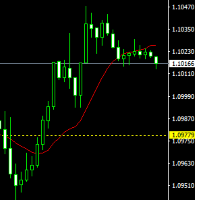
The indicator draws lines (with line objects) to the close prices of the previous day close, on selected timeframes. The indicator uses the closing price of the past day to draw a horizontal line, it can help you determine the direction of the market at the moment, which is necessary for making trades.. Parameters
Line Color Line style Line width Set on the top
FREE
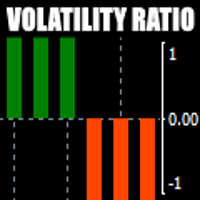
There is always a need to measure if the market is "quiet" or it is volatile. One of the possible way is to use standard deviations, but the issue is simple : We do not have some levels that could help us find out if the market is in a state of lower or higher volatility.
This indicator is attempting to do that : • values above level 0 are indicating state of higher volatility (=GREEN buffer) • values below level 0 are indicating state of lower volatility (=RED buffer)

通过 mql5 和 Telegram 上 的晨间简报获取每日市场更新,包括详细信息和屏幕截图 ! FX Power MT4 NG 是我们长期以来非常受欢迎的货币强度计算器 FX Power 的下一代产品。 这款下一代强度计算器能提供什么?您所喜爱的原版 FX Power 的所有功能 附加功能 黄金/XAU 强度分析 更精确的计算结果 可单独配置的分析周期 可自定义计算限制,以获得更好的性能 为希望查看更多信息的用户提供特殊的多实例设置 无尽的图形设置,可在每个图表中设置您最喜欢的颜色 无数的通知选项,让您再也不会错过任何重要信息 采用 Windows 11 和 macOS 风格的全新圆角设计 神奇的移动指标面板
FX Power 主要功能 所有主要货币的完整强势历史 所有时间框架内的货币强弱历史 所有经纪商和图表的计算结果完全相同 100% 可靠的实时计算 -> 无重绘 可通过下拉列表选择分析时段
通过自定义模式单独配置分析时段 可在一个图表中使用多个实例 可移动 FX Power 显示屏(通过拖放) 适用于高分辨率 QHD、UHD 和 4K 显示器 自动终端配置 针对平板电脑
SWING X Black 是一个革命性的 MetaTrader 4 (MT4) 指标,精心设计,可满足二元期权和外汇交易中的手动和自动交易。其无与伦比的准确性,加上它对各种时间框架的适应性,使其成为寻求最大化利润的交易员的强大工具。SWING X Black 针对 15 分钟时间框架进行了优化,适合快速决策和确保快速交易执行。此外,它为交易员提供了在后续信号上使用 Martingale 策略的选项,从而增强了在进入动态金融市场时对风险的管理。 主要特点 二元期权和外汇兼容性: SWING X Black 和谐地弥合了二元期权和外汇交易之间的差距,为交易员提供了在两个市场中利用其强大见解的灵活性。这种交叉兼容性确保交易员无论他们喜欢的交易风格如何,都可以做出明智的决策,从而增加他们成功的机会。 精确的信号生成: SWING X Black 的核心优势在于其出色的信号生成能力。借助先进的算法,该指标可以准确识别潜在的趋势反转、盘整和突破,为交易员提供清晰的入场和退出点。这种精度为交易员提供了在最小风险的情况下捕捉有利可图的机会的显著优势。 最佳时间框架: SWING X Black 是在

"HOW TO TRADE ANY CURRENCY PAIR WITH UNUSUAL PRECISION & PROFITABILITY!"
Buy Forex Trend Commander Indicator And You Will Get Trends Reversing PRO Indicator for FREE !
It's no secret that most traders reset their accounts. However, there are exceptions ... Awesome exceptions! Successful traders "make money" every month. You really only need two things: good indicator for sure and proper money management. One indicator to work with Trending, Sideways and Volatile Markets. Proper money man

介绍 Quantum Heiken Ashi PRO 图表 Heiken Ashi 蜡烛旨在提供对市场趋势的清晰洞察,以其过滤噪音和消除虚假信号的能力而闻名。告别令人困惑的价格波动,迎接更流畅、更可靠的图表表示。 Quantum Heiken Ashi PRO 的真正独特之处在于其创新公式,它将传统烛台数据转换为易于阅读的彩色条。红色和绿色条分别优雅地突出了看跌和看涨趋势,让您能够以非凡的精度发现潜在的进入和退出点。
量子 EA 通道: 点击这里
MT5版本: 点击这里
这一卓越的指标具有以下几个关键优势: 增强清晰度:通过平滑价格波动,Heiken Ashi 金条可以更清晰地反映市场趋势,使您更容易识别有利的交易机会。 减少噪音:告别经常导致错误信号的不稳定价格变动。 Quantum Heiken Ashi 指标可过滤噪音,使您能够做出更明智的交易决策 无缝集成:Heiken Ashi 指标专为 MetaTrader 开发,可无缝集成到您的交易平台中。它用户友好、高度可定制,并且与您的其他交易指标和过滤器兼容 无论您是寻求新优势的经验

"Turbo Helper for scalping"(剃头助手)是一个完全准备好的交易系统。它在图表上用箭头指示交易者何时以及何方向开仓。它还用方块符号指示交易者何时平仓。之后,该指标在图表上显示交易的预计点数。由于该指标未考虑您的经纪人实际点差和过夜利息(swap),因此该数值可能略有不同。但是,为了更精确计算,您可以在指标设置中的“平均每日点差”参数中指定点差大小。在计算时,系统将考虑此参数的值。该交易系统代替交易者进行市场分析,并给出具体建议。此外,“Turbo Helper for scalping”会通过电子邮件和电话发送信号。 该系统的优势: 完全准备好的交易系统 适用于M5、M15、M30时间段的剃头交易 不会重新绘制数值 自行分析市场并指导交易者何时开仓和平仓 适用于所有经纪人 适用于大多数货币对
如何测试该交易系统? 请观看以下描述下方的视频。
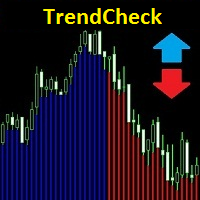
该指标在每根蜡烛下方绘制一条水平的蓝色或红色线,指示趋势的方向。 蓝线表示趋势上升,红线表示趋势下降。
该指标具有新的逻辑,与许多类似指标有显着区别。 它给出早期进入和退出信号,不会重绘其值 - 也就是说,如果指标给出进入交易的信号,那么该信号不会消失也不会移动 - 它将保留在出现的位置,并且它还给出打开蜡烛的信号,这为交易者在交易中提供了显着的优势。
该指标非常容易使用。 当蜡烛下方出现红线时,您需要开立卖出交易,而当出现蓝色蜡烛时,您需要开立买入交易。
指标的右上角显示通知者,显示所选货币对的所有时间范围内的趋势方向,以及当前信号及其强度。
指标参数:
period-指标周期 EnableAlerts - 声音信号的存在 EmailAlert - 当信号发生时发送电子邮件 MobileAlert - 有信号时发送手机消息 ShowInformation - 是否在左上角显示有关趋势方向及其强度的信息
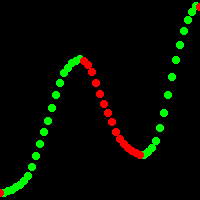
"Xhmaster formula forex indicator" - 一种带有回归数学建模的新型振荡指标,用于自由数值序列。相对于标准的"Xmaster formula"指标,该指标在识别价格反转点方面准确度提高了60%,同时对价格的小波动更不敏感。 "Xhmaster formula forex indicator"是专为外汇市场交易者设计的独特和先进的工具。它为交易者提供了出色的交易机会,帮助他们取得良好的交易结果。 借助"Xhmaster formula forex indicator",交易者可以获得有效的市场分析公式。该指标具有独特的特点,可以识别趋势,市场入场和出场点,并设置止损和获利水平。 "Xhmaster formula forex indicator"指标设置: period - 平均周期。 sensitivity - 市场动态确定。 maMethod - 移动平均方法。 appliedPrice - 用于指标计算的价格类型。

indicator CE and RF Buy-Sell Chandelier Exit and Range Filter Buy Sell
It is the ultimate indicator for telling entry points or entering trades with high accuracy.
Trades must be short term trading only or Scalping only, not suitable for holding positions across several days.
Suitable for beginner traders and professional traders.
Easy Operation 1. Import Indicator, CE and RF into MT4 chart. 2. Waiting for the signal from the arrow pointing up means recommending a long position. and an

Presenting the uGenesys Break of Structure and Change of Character Indicator The uGenesys Market Structure Indicator is the advanced solution designed specifically for forex traders seeking a competitive edge. This innovative tool goes beyond merely identifying Break of Structure (BoS) and Change of Character (CHoC); it also illuminates optimal entry and exit points on your forex charts, transforming your trading experience.
While the uGenesys Market Structure Indicator can reveal pivotal pa
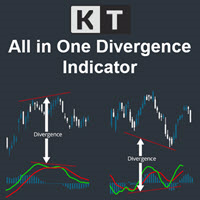
The KT All-In-One Divergence is designed to identify regular and hidden divergences between the price and 11 widely recognized oscillators. This powerful tool is indispensable for swiftly and accurately spotting market reversals. Its a must-have tool in any trader's arsenal, providing clear and accurate divergence patterns. Its accuracy and speed in identifying market reversals are remarkable, allowing traders to seize profitable opportunities confidently.
Features No Interference: You can a
RSI Divegence Win Pro
The RSI Drivergent is the best indicator for looking for price reversals.
RSI Drivergent Win Pro has used the strengths and best points of RSI to create in a format for traders to understand more easily.
Suitable for beginners and professional traders.
Case Up Trend : Blue line is below Yellow line. Case Down Trend : Blue line is abve Yellow line.
Usage is very easy. 1. Import the indicator into the MT4 chart. 2. Defind Overbought positions and defind oversold

Volume Cross Over is an indicator that measure positive and negative volume flow in a financial instrument, such as a stock, commodity, or index. It is base on the idea of On-Balance Volume developed by Joseph Granville. However instead of trending lines, this indicator shows volume cross over. When the closing price of an asset is higher than the previous closing price, then the Bull volume is greater than zero and Bear volume is negative. It suggests that buying volume is dominating, a
FREE
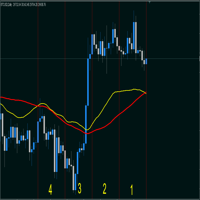
Индикатор суммируеn две средние скользящие, заданные в настройках и умножает на 2. (A + B)/2; Сдвиг на графике - смещает линию на графике.(ВАЖНО! учитывайте сдвиг на графике и сдвиг линии они суммируются, Т.Е. если смешение линий задано 50 и смещение на графике заданно 50 суммарно сдвинется на 100). Метод усреднения и тип цены классические как в средних скользящих. Период - колицество свечей для расчета. По умолчанию индикатор показывает среднею скользящию с периодом 26.
FREE
Multicurrency indicator in table format. Signals appear with confirmation, no repaints. Works on the current (open) timeframe. Notifications come for an open instrument. In the indicator settings, you can choose 1 of 4 Moving Average strategies. Strategies (represented in screenshots): Classic fast and slow moving average crossover Reverse signal of classic crossing (used for flat/sideways movement) Classic crossover relative to a slower moving average (Trend MA in settings) Price touching the f
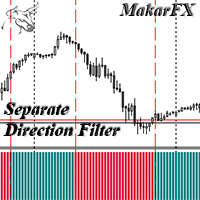
The indicator shows the Buy/Sell direction. The calculations use the opening prices and their rate of change for the billing period - "Calculation period" MTF indicator - "Calculation timeframe", no repaint - NRP. Two display types: "Simple histogram" or "Histogram level crossing" Alerts available: "Chart message", "Push message", "Email message" Two types of signals: "Change direction" or "Crossing level" Level settings: "Crossing UP level" and "Crossing DN level" Color settings. For EA: iCusto
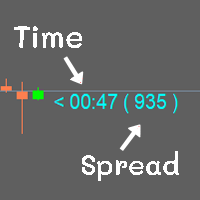
Show the time of candlesticks and spread. All data will be displayed in a rod. Can change color Can fix the size as needed
MT4 : Link https://www.mql5.com/en/market/product/102742 MT5 : Link https://www.mql5.com/en/market/product/102834
Most free code on various websites I didn't write it myself. I only do a little bit.
If you like it, please give 5 stars with it. Thank you.
FREE
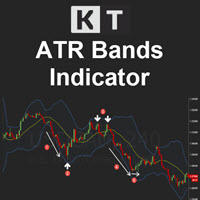
KT ATR Bands draws the volatility envelops and bands using a combination of Average True Range and Moving average. They are typically used to identify the potential reversal points and the periods of high and low volatility.
Features
Multi-Timeframe Ability: For example, you can have the atr bands from the daily timeframe on the H1 timeframe. Smart Alerts: You can turn on/off alerts for each band separately. Also, you can choose a minimum time interval between each alert to stop unnecessary,

Introducing ICT Reaction Levels, a reliable indicator designed to plot key levels on your chart. Unlike classical support and resistance, these levels are derived from significant highs and lows observed on higher timeframes, such as the weekly and monthly periods. The indicator provides a valuable tool for traders seeking to identify critical price levels based on historical price reactions.
ICT Reaction Levels analyzes price action on the specified timeframe, using special inputs to determi
FREE

KT DMA is a modified and advanced version of the classic Displaced Moving Averages with buy/sell crossover alerts and a Multi-Timeframe scanner that shows DMA's direction across each real-time time frame. A Displaced Moving Average is a simple moving average that moves ahead or backward in a time frame (either short-term or long-term). It also allows you to predict price movement more accurately.
Features Depicts the trend direction using the alignment of three moving averages. Buy/Sell signa

However, the difficult task here for traders is to understand and select the indicator or tool that can help them with their trading plan and benefit their trading style. Traders want a tool that requires minimal effort and provides as much support as it can.
There are multiple reasons for which traders need an indicator. One such reason is to determine the buy-sell signals in the market. The King Binary Forex Scalping Indicator is a tool that can help traders get answers to many question

MT5 Version
Understanding market sentiment is a critical aspect of successful trading. Market sentiment refers to the overall feeling or attitude of traders and investors towards a particular financial instrument, such as a stock, currency pair, or cryptocurrency. It is a collective perception of market participants' emotions and beliefs about the asset's future price direction. Market sentiment can be bullish (positive), bearish (negative), or neutral (sideways). Knowing the market sentiment

Arbitrage MACD: Your Key to Analyzing Market Trends
The Arbitrage MACD is a cutting-edge indicator designed to assist traders and investors in analyzing market trends with greater precision and confidence. MACD, which stands for Moving Average Convergence Divergence, is a well-known and widely used tool in the financial world, and the "Arbitrage MACD" takes its functionality to the next level.
This innovative indicator offers a comprehensive analysis of the relationship between two moving a

The " Arbitrage RSI " is a cutting-edge technical indicator designed to assist traders in making informed decisions in the financial markets. This powerful tool leverages the concept of Relative Strength Index (RSI) divergence to identify potential trading opportunities. To View Our Other Products Go to the link: Other Products
Features: RSI Divergence Detection: The Arbitrage RSI excels at identifying divergence patterns in the RSI indicator. By comparing the price action with the RSI mov

ATR Channels Indicator Introducing the ATR Channels Indicator, a powerful tool designed to enhance your trading experience and provide valuable insights into market volatility. ATR, short for Average True Range, is a technical indicator that helps traders understand the overall price volatility of an asset or market. The ATR Channels Indicator takes the ATR calculations to the next level by plotting them as dynamic channels on your price chart. These channels represent the range within which pri
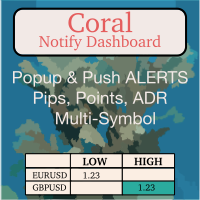
Coral Notify Dash allows you to manage all of your chart price-based notifications from a single consolidated dashboard. It fills a gap left by MT4, which does not support popup alerts. If you're like me and you often don't hear the alert sound for the built-in alerts, this is an indispensable tool. I use Coral Notify Dash as part of my daily chart analysis workflow. I use a tool like Coral Dash (available for free, here ) or one of the other dashboards to set my trading bias. As I review t

The FollowLine indicator is a trend following indicator. The blue/red lines are activated when the price closes above the upper Bollinger band or below the lower one.
Once the trigger of the trend direction is made, the FollowLine will be placed at High or Low (depending of the trend).
An ATR filter can be selected to place the line at a more distance level than the normal mode settled at candles Highs/Lows.
Some features: + Trend detech + Reversal signal + Alert teminar / mobile app
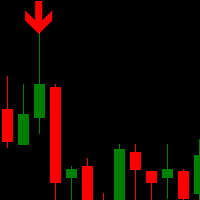
Trend Scalper Arrows is a unique trend reversal 100% non-repainting multi-algo indicator that can be used on all symbols/instruments: forex, commodities, cryptocurrencies, indices, stocks . Trend Scalper Arrows will determine the current trend at its early stages, gathering information and data from up to 10 standard algos When indicator give a valid buy or sell signal, a corresponding arrow will be printed on the chart, open trade at start of the next candle/bar indicating a
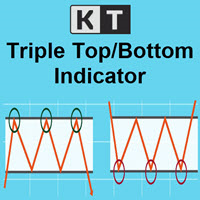
KT Triple Top-Bottom identifies the triple top/bottom pattern with a breakout signal in the opposite direction. It is used to identify potential trend reversals.
A Triple Top pattern is formed when the price reaches a high point three times, while a Triple Bottom pattern occurs when the price comes to a low point three times.
Features The indicator detects the triple top/bottom pattern with high precision and accuracy. The indicator suggests a shift in momentum, with sellers or buyers takin
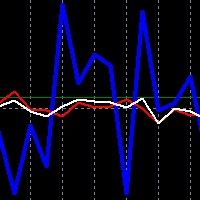
For the new traders of this strategy please remember the convention:
FORWARD trade = BUY AUDUSD and SELL NZDUSD at equal lot size
REVERSE trade = SELL AUDUSD and BUY NZDUSD at equal lot size
Risk is mittigated by the opposing nature of the trades, one tends to offset the other almost 70% of the time, and for when this is not the case we rely on the indicators accordingly - no stops are used in correlation hedge!
This is an enhanced oscillator like analysis of the relationship betw
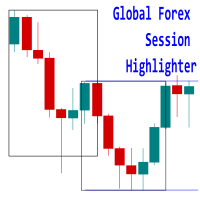
Introducing the 'Global Forex Session Highlighter' , a powerful tool designed to enhance your trading strategy by providing a visual representation of the Three major Forex trading sessions: Tokyo, London, and New York. This indicator is designed to help traders understand the dynamics of the global Forex market by highlighting the trading sessions directly on your MT4 chart. It provides a clear view of when each session starts and ends, allowing you to strategize your trades around the most

Title: Best Trend Sniper Indicator - A Custom MQL4 Indicator for Spotting Potential Trends Description: Indicator Name: Best Trend Sniper Indicator Introduction: The "Best Trend Sniper Indicator" is a custom Meta Quotes Language 4 (MQL4) indicator designed to identify potential trends in financial markets. This indicator is intended to be used on Meta Trader 4 (MT4) trading platforms. Key Features: Non Repaint: The Best Trend Sniper Indicator is a non-repaint indicator, which means it does not

ICT,SMC,智能货币概念,支撑和阻力,趋势分析,价格行为,市场结构,订单区块,突破区块,动量转变,强大的不平衡,HH/LL/HL/LH,公允价值差距,FVG,溢价和折扣区域,斐波那契回撤,OTE,买方流动性,卖方流动性,流动性空白,市场交易时间段,NDOG,NWOG,银弹,ICT模板。 在金融市场中,准确的市场分析对于投资者来说至关重要。为了帮助投资者更好地理解市场趋势和流动性,我们提供了一份使用教程,旨在实现高级市场分析功能。以下是一些功能的简要介绍和实现方法: 1. 显示高时间框架市场结构: 通过设置参数,您可以在图表上显示高时间框架市场结构。这将帮助您更好地理解市场的整体走势和结构。您可以根据自己的需求设置时间周期,并在图表上显示市场结构。 2. 显示流动性: 流动性是市场的重要指标之一。通过设置参数,您可以在图表上显示买方和卖方的流动性。您可以自定义文本和颜色,以便更好地识别不同的流动性水平。您还可以选择显示伦敦AM会话和纽约午餐时间的流动性。 3. 显示公平价值差距: 公平价值差距是指市场价格与公平价值之间的差异。通过设置参数,您可以在图表上显示公平价值
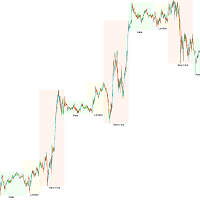
交易时段,市场时间,时段时间,外汇时间,交易时间表,市场开放/关闭时间,交易时区,时段指标,市场时钟,ICT,亚洲KillZone,伦敦Killzone,纽约Killzone 交易者应该注意交易时区的影响,因为不同的市场活动时间和交易量直接影响货币对的波动性和交易机会。为了帮助交易者全面了解市场情况并更好地制定交易策略,我们开发了一个交易会话指标。 该指标显示亚洲、伦敦和纽约市场的交易时间。用户可以设置显示或隐藏不同的交易时区,以便更方便地使用。此外,该指标可以根据设置显示或隐藏交易会话的名称,并限制最大显示数量。 实际使用过程非常简单:一旦您购买了该指标,将指标文件复制到您的MetaTrader 5平台的指标文件夹中,在MetaTrader 5平台中打开您想要应用指标的图表,从指标列表中选择指标,并将其拖放到您的图表上。 一旦指标成功应用,您将看到一个包含亚洲、伦敦和纽约市场交易时间的表格。您可以根据个性化设置显示或隐藏不同的交易时区,以更好地了解市场情况。同时,您还可以根据个性化设置显示或隐藏交易会话的名称,并限制最大显示数量。 该指标还提供多个可自定义选项,供您根据需要进行设置。
FREE

结合 Delta 足迹图,全面了解市场容量概况:
https://www.mql5.com/en/market/product/9415 3 “订单簿”指标在价格图表上显示代表买价和卖价数量集群的直方图。
该指标分析历史价格数据并计算指定数量的柱内每个价格水平的买价和卖价交易量集群。 买入量集群显示为蓝色,而卖出量集群显示为红色。
该指标提供有关不同价格水平的买入量和卖出量分布的信息。 交易者可以使用此信息来识别交易活动频繁的区域和潜在的支撑/阻力水平。 直方图条代表每个价格水平的买入和卖出集群的数量,提供市场流动性的直观表示。
除了直方图条形之外,该指标还显示文本标签,显示分析期间的出价和要价集群总数。 随着新价格数据的出现,这些标签会实时更新。
解锁市场趋势的力量,使用3-HMA多时间段趋势指标。这个可靠的工具是您在复杂的外汇交易世界中的值得信赖的伙伴。它以适应性和准确性为核心,使其成为理解跟随趋势的重要性并希望利用赫尔移动平均线(HMA)无与伦比的反应性的交易者的理想选择。
赫尔移动平均线与传统的移动平均线的区别在于其显著的减小市场滞后的能力。这个独特的特性使HMA成为快速准确识别市场趋势变化的强大工具,为交易者提供了他们所需要的关键优势。
我们的指标通过在多个时间段上应用HMA策略来提升其效率。这意味着您可以全面了解市场,使您能够做出更明智的决策并最大化您的利润潜力。
在版本1.01中,我们进行了一些关键的改进:
添加了一个去初始化函数,OnDeinit()。当指标从图表中删除时,会调用此函数。在此函数中,将删除指标创建的所有标签,并重置跟踪每个时间段的bar数的barsCount数组。
改进了赫尔移动平均线(HMA)的计算。首先,用于计算HMA的temp数组现在在每次使用之前都会被重置,确保数组中的先前值不会影响当前的计算。其次,现在只有当图表上出现新的bar时,才会计算HMA,而不是对每个tick

智能策略指标是一个交易系统,可让您从技术分析的多个方面来分析市场。 第一个是价格通道,它是自动构建的,允许交易者看到价格变动的主要方向。 它还可以使用通道策略(突破和从通道线反弹)来分析市场。
第 2 块是 SAR 系统,它提供有关市场微观波动的一般信息,这是箭头的确认信号。
第 3 块是主块,它显示您进入和退出交易所需的箭头。 这些信号很好,因为它们不会伴随小幅波动,而是立即表明一个大的长期趋势。
基于这个指标,你可以制定很多策略。 其中一个底部以箭头的形式表示,这是基于对市场的深入分析,但您也可以向其中添加 SAR 读数和通道,以显示全球趋势的方向
选项
period — 箭头出现的周期 showSar - 是否显示抛物线 Sar 步骤 - 抛物线 SAR 的步骤 最大值 - 抛物线 SAR 的最大值 channel_width — 通道宽度因子 SoundOn - 箭头声音警报 EmailAlert - 当箭头出现时发送电子邮件 MobileAlert - 当箭头出现时按下 指标不会重绘。 如果箭头出现在某个地方,它就会保留在那里。
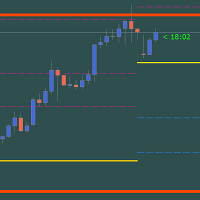
Gold PL MTF - this is a fine stock technical indicator. The indicator algorithm analyzes the movement of the asset price and automatically reflects the important Pivot Levels of the specified timeframe (TF) using the Fibonacci method (golden section).
The indicator perfectly describes the price trajectory of the selected timeframe (day, week, month, year), determines the beginning of a trend and the beginning of a correction, which may develop into an opposite trend. The indicator also shows t

This version of the indicator works only in the tick data stream. In this way, we only see the current situation from the moment of launch. I recommend using the classic version Real-Time Currency Valuation . The indicator calculates currency strength of eight major and also can calculate strength of any other currency, metal or CFD.
Main Features It is able to display only the currencies that are currently necessary, thus not overloading you with unnecessary information and notifications. It
FREE

The indicator marks the points on the chart where the standard ZigZag indicator has drawn its top or bottom. With this indicator, you can easily understand where the top or bottom was formed, and where it was redrawn. The indicator gives an alert when a new point appears. Warning! Parameter Applied Price - expands the possibilities of building the indicator. It is possible to build at OPEN, CLOSE and standard HIGH/LOW prices. Input parameters ----------- Depth - period of the ZigZag ind
FREE

SX Price Action Patterns is a comprehensive indicator which shows various price action patterns on the chart for those who are interested in price action trading. These patterns are as follows: A Pin Bar is a candlestick price bar, which has a long wick on one side and a small body. It is a powerful signal of price reversal in a currency trading strategy. An Inside Bar is characterized by a bar or candle that is entirely ‘inside’ the range of the preceding one and represents the consolidation o
FREE

Highlight special areas based on time
you can highlight London and New York OR other Times and analysis the chart faster
it's so useful for backtesting
it's really hard to highlight several days in a special time but this indicator will help you quickly to Highlight them
I'm a trader so I know what you need
if you need more info comment or message me if you wanna see the video you should send me message i will answer faster in Telegram: https://t.me/forex_ex4
Telegram ID: @forex_ex4
st

The DVV indicator is a multifaceted informative indicator for the Forex market or the Cryptocurrency market . The indicator gives clear and reliable signals without redrawin g. The indicator can be used in bots by taking readings from its zero buffer.
Please note that for different currency pairs, the settings must be selected separately, this is not difficult.
Changing the input parameters greatly affects the display. I will show four options for using the indicator. The indicator

Gioteen Volatility Index (GVI) - your ultimate solution to overcoming market unpredictability and maximizing trading opportunities. This revolutionary indicator helps you in lowering your losing trades due to choppy market movements. The GVI is designed to measure market volatility, providing you with valuable insights to identify the most favorable trading prospects. Its intuitive interface consists of a dynamic red line representing the volatility index, accompanied by blue line that indicat

Introducing Real Cross System , the cutting-edge trading signal indicator designed to revolutionize your trading experience. Whether you are a seasoned trader or a newcomer to the financial markets, this powerful tool is engineered to provide accurate and timely signals, empowering you to make informed trading decisions with confidence. Features: Real-Time Signal Generation: Real Cross System utilizes advanced algorithms to generate real-time trading signals based on precise market analysis.

The Exact Arrow Entry Signal Indicator is a powerful tool designed to assist traders in making informed decisions in the financial markets. This advanced indicator leverages cutting-edge algorithms and technical analysis to identify potential entry points with high accuracy.
Features: 1. Precision Entry Points: The indicator generates precise arrow signals on the chart, highlighting potential entry points for various trading strategies.
2. Trend Identification: By analyzing price movements

All Symbols AND All Time frames Scan
Document Introduction
A breakout refers to when the price of an asset moves above a resistance zone or moves below a support zone. A breakout indicates the potential for a price trend to break.Break provides a potential business opportunity. A break from the top signals to traders that it is better to take a buy position or close a sell position. A breakout from the bottom signals to traders that it is better to take sell positions or close the

Introducing the SmartZone Reversal Master, a powerful indicator designed to assist traders in identifying potential trade entry points. This indicator utilizes the SMC concepts of liquidity engineering and higher resolution trend analysis to help traders make informed decisions.
By identifying institutional key levels in the market and monitoring price movements in relation to them around certain times of the day (ICT killzones) when volatility is higher, the SmartZone Reversal Master enhance
This indicator uses candlesticks with large real bodies to predict possible market structure shift. Displacement is a very powerful move in price action resulting in strong selling or buying pressure. Generally speaking, displacement will appear as a single or a group of candles that are all positioned in the same direction. These candles typically have large real bodies and very short wicks, suggesting very little disagreement between buyers and sellers. Often, a displacement will occur just af

Introducing the Great Oscillator Trend Indicator – a powerful tool designed to enhance your trading strategies and improve your decision-making process.
The Great Oscillator Trend Indicator is a versatile technical analysis tool that helps you identify trends and potential reversals in the financial markets. It utilizes a combination of oscillators and moving averages to generate accurate and reliable signals.
With this indicator, you can easily spot overbought and oversold conditions, as

The Zigzag Value Indicator is a powerful technical analysis tool designed to assist traders and investors in identifying significant price movements and trends in financial markets. With its advanced algorithm, this indicator helps users determine key turning points and potential reversals, providing valuable insights for making informed trading decisions. To View Our Other Products Go to the link: Other Products
Features:
1. Zigzag Pattern Detection: The Zigzag Value Indicator detects an

1 of 10 for 69$
.
Next Price is 89$
SMC Unmitigated Finding is a indicator for find unmitigated supply and demand in previous legs of price
Settings Zigzag Settings ZZDepth - by Default is 12.
ZZDeviation - by Default is 5.
ZZBackStep - by Default is 3. Rectangle Settings SupportColor- color for Support line.
ResistanceColor - color for Resistance line.
Settings Num of Show - Number of Support & Resistance Show.
MetaTrader市场是一个简单方便的网站,在这里开发者可以出售自己的交易应用程序。
我们将帮助您发布您的产品,并向您解释如何为市场准备您的产品描述。市场上所有的应用程序都是加密保护并且只能在买家的电脑上运行。非法拷贝是不可能的。
您错过了交易机会:
- 免费交易应用程序
- 8,000+信号可供复制
- 探索金融市场的经济新闻
注册
登录