适用于MetaTrader 4的新技术指标 - 18
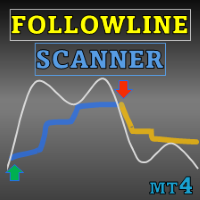
Special offer : ALL TOOLS , just $35 each! New tools will be $30 for the first week or the first 3 purchases ! Trading Tools Channel on MQL5 : Join my MQL5 channel to update the latest news from me 通过 Follow Line MT5 与扫描仪,最大化您的交易优势,这是一款为严肃交易者设计的先进基于波动率的指标。此工具结合了布林带的强大功能和可定制的设置,提供对价格波动的精准见解。 See more MT5 version at: Follow Line MT5 with Scanner See more products at: https://www.mql5.com/en/users/ndhsfy/seller Follow Line 的关键在于其能够检测价格何时超出设置为 1 标准差的布林带。以下是其工作原理: 买入信号: 当价格突破上布林带时,F
FREE
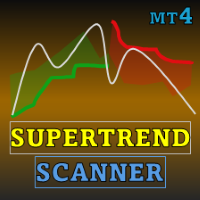
Special offer : ALL TOOLS , just $35 each! New tools will be $30 for the first week or the first 3 purchases ! Trading Tools Channel on MQL5 : Join my MQL5 channel to update the latest news from me 介绍 SuperTrend by Kivanc Ozbilgic with Scanner – 一款多功能且强大的工具,旨在帮助您领先于市场趋势,具备可定制的功能和实时警报. 您可以在 ATR 计算方法中选择 RMA (相对移动平均线)或 SMA (简单移动平均线),以实现最大的灵活性。默认设置为 ATR 周期 10 和倍数 3, SuperTrend 有效地识别买卖信号。 内置的扫描器和警报系统监控多个货币对和时间框架,确保您能收到实时通知并立即采取行动。 See more MT5 version at: SuperTrend ATR Multiplier with
FREE
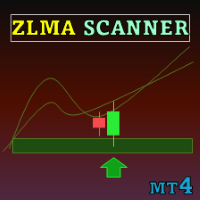
Special offer : ALL TOOLS , just $35 each! New tools will be $30 for the first week or the first 3 purchases ! Trading Tools Channel on MQL5 : Join my MQL5 channel to update the latest news from me Zero Lag MA Trend Levels 与扫描仪指标结合了零滞后移动平均线 (ZLMA) 和标准指数移动平均线 (EMA),为交易者提供了市场动量和关键价格水平的全面视图。此外,扫描仪和警报功能使交易者能够轻松跟踪多个货币对和时间框架的信号,从而增强发现交易机会的能力。 See more MT5 version at: Zero Lag MA Trend Levels MT5 with Scanner See more products at: https://www.mql5.com/en/users/ndhsfy/seller
主要特点及使用方法
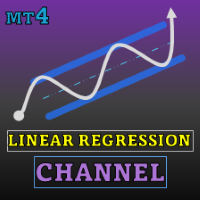
Special offer : ALL TOOLS , just $35 each! New tools will be $30 for the first week or the first 3 purchases ! Trading Tools Channel on MQL5 : Join my MQL5 channel to update the latest news from me 线性回归通道指标 是一个强大的技术分析工具,帮助交易者捕捉价格趋势和潜在的反转点。通过计算并显示线性回归通道、带状区域和未来预测,这个指标提供了对市场动态的深刻见解。它有助于识别超买和超卖状况、趋势方向,并为未来的潜在价格走势提供明确的视觉提示。 MT5 版本请参见: Linear Regression Channel MT5 See more products at: https://www.mql5.com/en/users/ndhsfy/seller
主要特点: 1. 线性回归带: 功能: 基于线性回归计算绘制带状区域,表示超买和超卖水平。 自定义选项
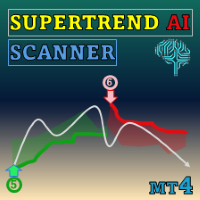
Special offer : ALL TOOLS , just $35 each! New tools will be $30 for the first week or the first 3 purchases ! Trading Tools Channel on MQL5 : Join my MQL5 channel to update the latest news from me 通过 SuperTrend AI Clustering with Scanner ,体验人工智能的强大力量。这款革命性的交易工具适用于 MetaTrader4 (MT4),结合了 K-means 聚类和广受欢迎的 SuperTrend 指标,帮助交易者在趋势和信号中掌握主动。 See more MT5 version at: SuperTrend AI Clustering MT5 with Scanner See more products at: https://www.mql5.com/en/users/ndhsfy/seller
为何此工具独树一帜 虽

趋势振荡器:平稳可靠的市场趋势识别 趋势振荡器是一款先进的 MT4 指标,旨在帮助交易者准确识别趋势方向和潜在的反转点。借助直观的视觉呈现,该指标清晰地显示市场处于上升趋势还是下降趋势,从而简化分析并提高图表的可读性。适用于多种市场和时间框架,提供了极大的灵活性以满足不同的交易需求。 趋势振荡器的主要特性和优势 简化的趋势可视化 :趋势振荡器通过颜色变化的线条图形化地展示趋势运动以指示市场方向。蓝色表示上升趋势,黄色表示下降趋势,提供了即时且清晰的趋势读取。 可靠的反转信号 :通过先进算法,指标会生成代表可能反转点的彩色箭头。绿色箭头表示潜在的买入点,而红色箭头表示潜在的卖出点,帮助交易者识别评估进场或出场的关键区域。 适用于任何市场和时间框架 :趋势振荡器在任何市场和不同的时间框架下都能有效运行,提供了适用于所有交易条件的灵活性和多样性。 用户友好,易于使用 :该指标专为易用性而设计,即使是初学者也可以轻松使用。重要信息直接显示在图表上,使得分析更加轻松和即时。 适用于不同的交易风格 :无论您采用的是剥头皮还是短期交易策略,趋势振荡器都能在不同的市场条件下提供支持,适应不同的交易风格

介绍 MIGHTY FALCON PIPS Mighty Falcon Pips 是一个基于 TRIX、均线和动量的简单买卖指标。 该指标专注于为我们提供潜在有用的反转信号,并附带退出信号的功能。 强大的退出信号使您能够及时退出反转趋势,使交易更加顺畅。 包括退出信号在内的所有信号都可以调整,不过我们仍然建议配合使用一些有效的过滤工具(如结构型指标)。 主要特点: 无重绘,无滞后 提供信号和退出的警报和推送通知 强弱信号 易于与价格行为结合 我们附有设置文件,如果您拥有此指标,可以联系管理员获取设置文件 。
"介绍 MIGHTY FALCON PIPS Mighty Falcon Pips 是一个基于 TRIX、均线和动量的简单买卖指标。 该指标专注于为我们提供潜在有用的反转信号,并附带退出信号的功能。 强大的退出信号使您能够及时退出反转趋势,使交易更加顺畅。 包括退出信号在内的所有信号都可以调整,不过我们仍然建议配合使用一些有效的过滤工具(如结构型指标)。 主要特点: 无重绘,无滞后 提供信号和退出的警报和推送通知 强弱信号 易于与价格行为结合 我们附有设置文件,如果您拥有此指标,
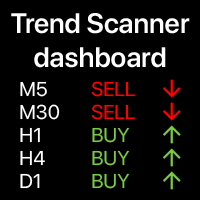
趋势仪表板:多时间框架指标,显示当前趋势的摘要 该工具 基于3个主要指标:RSI, 随机指标和商品通道指数。 警报 选项 将帮助 您 不会 错过 趋势 的开始。 多功能工具 : 包含66+功能 | 联系我 如有任何问题 | MT5版本 多种选项将允许您根据自己的需求自定义指标。 设置: 计算柱:当前(浮动)或上一个(已关闭)。 9个主要时间框架 可用: 每个 可以 选择 开启 或 关闭。 随机指标 : %K线周期; %D线周期; 慢速值; RSI指标: 快速周期; 慢速周期; 可视化 设置 : 颜色:买入、卖出和中性信号; 字体大小,距离乘数; 警报 设置 : 电子邮件/终端/推送(移动端); 程序文件必须放在" Indicators "目录中。 多功能工具 : 包含66+功能 | 联系我 如有任何问题 | MT5版本
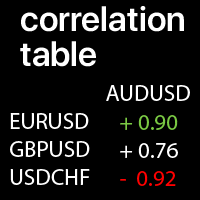
所选符号之间的相关性值:比较当前市场趋势 值为 +1: 表示完全 正 相关; 值为 -1: 表示完全 负 相关; 值为 0: 表示无明显相关性(价格互不影响,或相关性是 随机的 ); 我的 #1 工具 : 66+ 功能 | 联系我 如有任何问题 | MT5 版本 每个符号都可以自定义:删除 / 替换。每行 / 列最多可添加 10 个符号。 面板可以拖动到图表上的任何位置(任意拖放)。
在输入设置中,您可以配置: 用于计算的 周期 (所选时间帧的 柱数 )。 计算的 时间帧 :较高的 TF = 长期 相关性,较低的 TF = 短期 相关性。 极值 :用于警报和高亮显示。 高亮 选项:如果启用,极端相关性将以绿色 / 红色高亮显示。 警报 :可以为极值级别启用:正 / 负 / 两者。 视觉 样式:大小、深色 / 浅色主题。 程序文件必须放在 " Indicators " 目录中。
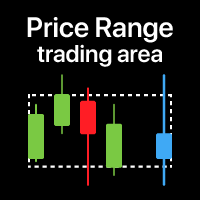
价格区间: 可视化 选定 时间 周期 的 交易 范围 特别 适用于 低 时间 框架 交易 , 以便 查看 更高 时间 框架 的 范围 。 我的 #1 工具 : 66+ 功能,包括此指标 | 联系我 如有任何问题 | MT5版本 适用场景: 使用多时间框架分析时 查看不同周期的整体情况 查看 选定 周期 的 完整 范围 设置: 区间颜色 填充区间: 若为 ' false ' , 则 仅 显示 范围 边界 线 包含当前(浮动)K线:若为' true ',当前(未闭合)K线也将计入范围。 计算方法:基于 实体 (开盘-收盘) / 影线 (最高-最低) 计算 所用 周期数 (下一参数) 周期类型 : K线 / 分钟 / 小时 / 天 使用[ K线 ]类型时,还需设置计算时间框架。 //----- 我的 #1 工具 : 65+ 功能,包括此指标 | 联系我 如有任何问题 | MT5版本

The MarketPrice Indicator is designed to provide a quick, one-glance visualization of the trend direction for a currency pair across all time frames (Time Frames), streamlining decision-making. MarketPrice Indicator is based on daily levels and trading signals derived from moving average crossovers and market strength according to various technical indicators. It comes fully configured, though you can, of course, modify any parameters as desired. Indicator Logic The indicator uses a combination
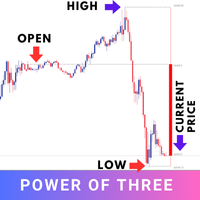
The "Power of Three" (PO3) is a concept developed by the Inner Circle Trader (ICT) to illustrate a three-stage approach used by smart money in the markets: Accumulation, Manipulation, and Distribution . ICT traders view this as a foundational pattern that can explain the formation of any candle on a price chart. In simple terms, this concept is effective for any time frame, as long as there's a defined start, highest point, lowest point, and end. MT5 - https://www.mql5.com/en/market/product/124
FREE
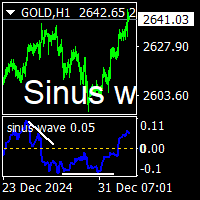
Sinus wave indicator is a extra ordinary oscillator.to find divergency. it works all pairs and all timeframes. suitable for experienced and beginner traders.. indicator works on toward of the prices... while sinus wave go up side that means prices will up. and while sinus wave go down that means prices is going down. it gives divegency when trend reversals. It also gives sell divergency on bear markets there is wave to set default 500. It can be increase depends to charts bars numbers on pictur

Real Spread Monitor is a powerful indicator that is designed to accurately measure and analyze real spreads, giving traders the ability to compare trading conditions of different brokers. This product is also available for MetaTrader 5 => https://www.mql5.com/en/market/product/125768 Key Features of Real Spread Monitor:
1. Two modes of operation: Write mode : In this mode the indicator collects data on real spreads of the selected trading instrument and records them in a file. The spread is r

Dynamic MA Trend Zone – Dynamic Moving Average Trend Zone
The Dynamic MA Trend Zone is a visually compelling indicator that dynamically tracks changes in market trends. By displaying moving averages on three different price levels (close, high, and low), it creates a color-coded trend zone that clearly indicates the trend’s direction and strength.
Features and Functions:
- Trend Direction Color Coding: The indicator automatically color-codes the trend zones based on whether the candle’s clos
FREE
This indicator for MT4 automatically draws support and resistance levels based on fractals, highlighting key areas of the market where the price could reverse or slow down. Fractals are graphical structures that identify significant highs and lows, thus forming a dynamic system of support and resistance levels. The indicator allows you to visualize these levels directly on the chart, facilitating technical analysis and identifying potential entry or exit points in the market. It is an ideal too
FREE

This indicator is collection of important dynamic support and resistance giving a trader crystal clear idea , where to sell and where to buy. it completely complements trend lines, support, resistance, and sideways market and allow a trader to make sustainable profits. The thickness of lines suggests its strengths, the thicker the dynamic line, the stronger is rejection or pullback allowing a trader to make multi-fold profit, as they can clearly see them.
Introducing Your Ultimate Trading Edge:

Scalping Worm is an essential tool for every trader aiming to improve the accuracy of their market entries and exits. With its advanced weighted moving average formula and adaptive smoothing logic, this indicator not only captures the current trend direction but also helps determine its strength and stability. The blue line signals an uptrend, while the red line indicates a downtrend, making analysis highly intuitive and visually straightforward. The main advantage of this indicator is its abili
Signal Indicator
when price is crossing Trend Lines Horizontal Lines Rectangles Works on all timeframes and with all instruments. Multiple notification types Arrows on Chart Alert box Journal Log File Log Specific Sound Email Notification (must be configured in Terminal - please review MT4 docs) Push Notification (must be configured in Terminal - please review MT4 docs) Draw your trend lines, horizontal lines or rectangles onto your chart. Select an object and bring up its properties and type

为了满足交易者在市场中快速、准确决策的需求,我们推出了这款卓越的趋势指标,旨在为您的交易提供清晰的趋势分析,减少不必要的噪音干扰,使交易变得更简单、更有效。 主要亮点与优势 : 无重绘特性 :此指标在生成信号后不会因市场变动而改变,从而保障了交易决策的稳定性。避免重绘带来的混乱,让您对每个买卖信号充满信心。 实时邮件通知 :通过邮件接收即时交易信号提示,无论您在何处,都能第一时间把握市场动态,确保不因信息滞后而错失良机。 全周期适配 :无论您偏爱短线交易还是长线投资,此指标均能通过调节参数,在不同的时间周期图表中展现稳定表现,让您轻松调整并适应自己的交易策略。 参数自定义 :灵活调节指标参数,找到最适合您的交易风格。 趋势聚焦 :可以清除市场中大部分噪音信号,使您获得更准确、更清晰的趋势方向,有效提升交易胜率。 最佳使用建议 :我们建议在1小时(1H)周期图表中加载该指标,以获取最佳的趋势信号和分析效果。此时间框架能够提供足够的市场深度和清晰的趋势判断,为您的决策提供有力支持。 默认参数下:红色线条是表示上涨,绿色线条表示下降,蓝色线条表示震荡。 特别赠品 :购买此指标后,请留下评论

Questo indicatore avanzato è un potente strumento progettato per aiutare i trader a identificare i livelli chiave di supporto e resistenza nel mercato. Questo indicatore è versatile e offre un'interfaccia personalizzabile e intuitiva, consentendo ai trader di scegliere tra sei diversi metodi di calcolo del punto pivot: Classic, Camarilla, Woodie, Floor, Fibonacci, Fibonacci Retracement.
FREE

Questo indicatore per MT4 traccia automaticamente i punti di pivot giornalieri sul grafico, fornendo livelli chiave di supporto e resistenza basati sui prezzi di apertura, chiusura, massimo e minimo del giorno precedente. I punti pivot aiutano i trader a identificare potenziali aree di inversione e zone di prezzo critiche, migliorando la precisione nelle decisioni operative quotidiane."
FREE

Hey there! If you are using Moving Average indicator into RSI indicator's window and always wondering if there could be a way to get alerts on your smartphone when those two indicators get a crossover that would be great, right!? Then you have found the right tool for that. This indicator is nothing but a mix of MA indicator and RSI indicator into one indicator window as well as it will give you alerts for crossovers on your smartphone app, email and also on your trading terminal's (desktop) cha
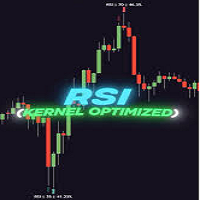
GENERAL OVERVIEW
Introducing our new KDE Optimized RSI Indicator! This indicator adds a new aspect to the well-known RSI indicator, with the help of the KDE (Kernel Density Estimation) algorithm, estimates the probability of a candlestick will be a pivot or not. For more information about the process, please check the "HOW DOES IT WORK ?" section. Features of the new KDE Optimized RSI Indicator :
A New Approach To Pivot Detection
Customizable KDE Algorithm
Realtime RSI & KDE Dashboard
Alert

Indicator detects long bars. How to use:
base = base value in points of our long bar if this value is larger than bar we have our signal. useSplit = when we want to divide our trading into two before and after preset time. Both before and after work the same as our base . splitTimeHour = split time hour 14:00 would be 14. splitTimeMinute = split time minute 14:30 would be 30. before = same as base long bar value in points. after = same as base long bar value in points. useATR = instead o
To get access to MT5 version please contact via private message. You can also check the other popular version of this indicator here . This is the exact conversion from TradingView:"Optimized Trend Tracker" by "kivancozbilgic" The screenshot shows similar results from tradingview and Metatrader when tested on ICMarkets on both platforms. This is a light-load processing indicator. It is a non-repaint indicator. Highlighting option is not available due to MT4 restricted graphics. Buffers are avai

The Zone1 is a tool to help professional or novice traders to assist in making decisions to buy or sell. This indicator is also not repainted so it is also suitable for scalping strategies, day trading and even swing strategies. i hope you can profitable like me....
if you have quotion abot this product you can contact me via email ichwan.dreamweaver@gmail.com

免费 MT4 指标: https://www.mql5.com/en/market/product/125434 免费 MT4 助手: https://www.mql5.com/en/market/product/107986
如果您喜欢这个免费工具,请留下 5 星评价!非常感谢 :) 反弹基础反弹 (RBR)、下跌基础反弹 (DBR)、下跌基础下跌 (DBD)、反弹基础下跌 (RBD)、公允价值差距 (FVG) / 不平衡、隐藏基础
推出“供应需求 MT4”指标 - 您以精确和自信驾驭金融市场动态世界的终极工具。这一尖端指标经过精心设计,旨在让交易者能够实时洞察供需动态,从而做出明智的决策并最大限度地发挥交易潜力。 主要特点: 自动区域识别:该指标采用先进的算法自动检测和绘制价格图表上的关键供需区域。这些区域包括#rallybaserally、#rallybasedrop、#dropbaserally 和#dropbasedrop,为交易者提供了解市场情绪和潜在价格逆转的关键参考点。 公允价值差距/不平衡指标:除了供需区域外,该指标还结合了公允价值差距/不平衡指标,以提供对市场
FREE

Send us a message after your purchase to receive more information on how to get your BONUS for FREE that works in great combination with Bull vs Bear !
Bull versus Bear is an easy-to-use Forex indicator that gives traders clear and accurate signals based on clear trend retests . Forget about lagging indicators or staring at charts for hours because Bull vs Bear provides real-time entries with no lag and no repaint, so you can trade with confidence. Bull vs Bear helps you enter trades durin
该指标提供了一种高效的方法,可同时监控多个货币对和不同周期。通过在清晰易读的表格中直观展示价格与MACD之间的背离,它使交易者无需频繁切换图表即可发现潜在的市场转折点。 背离可能表示多头或空头动能的变化。例如,当价格创出新高但MACD未能相应创出更高的高点时,就出现看跌背离。相反,当价格创出更低的低点而MACD却形成更高的低点时,就出现看涨背离。 在指标的表格中,每个品种(如EURUSD、GBPUSD)垂直列于左侧,所选周期(如M5、H1、D1)水平排列在顶部。一个简单的点表示未检测到背离;当出现“UP”或“DN”(下)的标记时,就突显了一个潜在的交易信号。绿色的“UP”意味着可能的买入机会,而红色的“DN”意味着可能的卖出机会。发现信号后,指标还可根据您的设置,通过弹窗、邮件或推送通知进行提醒。与往常一样,建议结合更高周期分析、移动平均线及关键支撑和阻力位等方法来确认交易信号。 该工具提供两种扫描模式:一种只关注当前图表的品种,另一种扫描您自定义的品种列表。如果您需要同时扫描多个品种,只需在设置中用逗号(不加空格)分隔输入每个品种名称。在这种情况下,将表格放置在单独的图表窗口中,可能
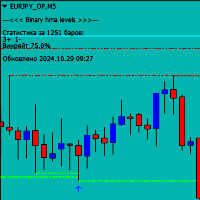
MT4的 Binary HMA Levels 指标专为二元期权设计,但同样适用于外汇交易。它基于关键水平运作,在当前蜡烛收盘前发出箭头形式的信号,确认价格从关键水平反弹。为了确保指标正确运行,您需要下载并将 "MQL5" 文件夹安装到您的终端目录中。您可以通过此链接下载文件夹: https://disk.yandex.ru/d/DPyo0ntaevi_2A 该指标通用,适用于任何时间框架和货币对,但为了获得更准确的信号,重要的是选择最佳的到期时间和时间框架。它还会直接在图表上显示信号的成功率,帮助评估其有效性。默认到期时间为1分钟,适合短期交易,但您可以在指标设置中进行调整,以正确显示统计信息........
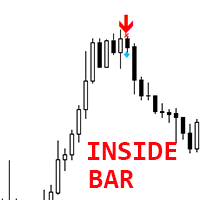
Crypto_Forex 指标 INSIDE Bar Pattern for MT4。
- 指标“INSIDE Bar”是价格行为交易的非常强大的指标。 - 指标检测图表上的 INSIDE Bar 模式: - 看涨 INSIDE Bar - 图表上的蓝色箭头信号(见图片)。 - 看跌 INSIDE Bar - 图表上的红色箭头信号(见图片)。 - 无需重绘,无延迟,高 R/R 比率(回报/风险)。 - 具有 PC、移动和电子邮件警报。 - 指标“INSIDE Bar Pattern”非常适合与支撑/阻力位结合使用。
// 出色的交易机器人和指标可在此处获取: https://www.mql5.com/en/users/def1380/seller 这是仅在此 MQL5 网站上提供的原创产品。
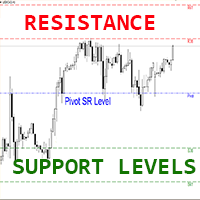
MT4 外汇指标“枢轴支撑阻力水平日周月”。
- 指标“枢轴 SR 水平 D_W_M”是价格行为交易非常强大的辅助指标。 - 此特定指标在计算中使用斐波那契数。 - 枢轴水平是根据前一交易期市场表现计算出的重要价格的平均值。 - 枢轴水平本身代表最高阻力或支撑水平,具体取决于整体市场状况。 - 指标“枢轴 SR 水平 D_W_M”向您显示价格可达到的最可能反转水平。 - R - 水平(红色)- 阻力。 - S - 水平(绿色)- 支撑。 - 每日、每周和每月前一交易期可在设置中进行计算。 - 指标“枢轴水平 D_W_M”非常适合通过价格行为模式规划您的获利目标或价格反转。
如何使用指标: 1) 将指标附加到相应的图表。 2) 选择您需要的设置,然后按“确定”按钮。 3) 单击 MT4 中的不同时间范围(H1、H4、D1、W1)以对指标进行初始正确计算。
// 出色的交易机器人和指标可在此处获取: https://www.mql5.com/en/users/def1380/seller 这是仅在此 MQL5 网站上提供的原创产品。
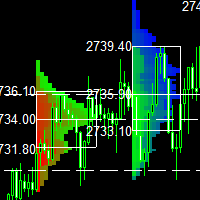
This indicator is a classic implementation of the Market Profile (Volume Profile Visible Range), allowing for the display of price density over time while highlighting the most significant price levels, the value area, and the control price within a specific trading session. MT5-version: https://www.mql5.com/en/market/product/125308 The indicator can be applied across timeframes from M1 to D1, enabling the analysis of market profiles for daily, weekly, monthly, or intraday trading. Utilizing l

# 谐波价格模式指标
该指标能够手动显示最接近的谐波形态,允许您轻松调整参数并创建自定义谐波模式,同时显示各点之间的价格距离。
## 核心功能
1. **自动识别主流谐波形态** - 支持检测**ABCD、加特利(Gartley)、蝙蝠(Bat)、蝴蝶(Butterfly)、螃蟹(Crab)和鲨鱼(Shark)**等经典形态 - 提供自动/半自动图表标注功能
2. **全参数自定义** - 可调节各线段(XA/AB/BC/CD)的**斐波那契比率** - 设置**形态识别敏感度**降低误判 - 支持创建**自定义比率**的独特形态
3. **智能测算系统** - 实时计算并显示**关键点间的价格差**(如A点到B点距离) - 基于形态结构自动推算**潜在盈利目标与止损位**
4. **智能交易提示** - 形态完成时触发**实时警报** - 根据价格在谐波位反应生成**买卖信号**
5. **全周期适配** - 兼容**1分钟至月线**所有时间

趋势反转指标 (带有警报和推送通知功能)旨在通过使用移动平均线(MA)、随机指标(Stochastic Oscillator)和平均真实范围(ATR)等指标的组合,检测价格图表上的反转点。该指标在图表上绘制箭头,指示潜在的买入或卖出时机,并可以在当前柱形出现信号时,实时发送警报、推送通知和电子邮件。 主要特点: 使用移动平均线 (MA): 该指标根据用户定义的周期 ( MA_Period ) 计算移动平均线(MA)。支持选择移动平均线的计算方法,包括简单移动平均线 (SMA) 和指数移动平均线 (EMA)。 当收盘价低于移动平均线时,出现买入信号,表明可能的下行趋势即将反转为上行趋势。 当收盘价高于移动平均线时,生成卖出信号,表明可能的下行趋势即将开始。 随机指标 (Stochastic Oscillator): 该指标使用随机指标的两个参数:%K 和 %D。如果 %K 低于 30 且高于 %D,则生成买入信号。如果 %K 高于 70 且低于 %D,则生成卖出信号。这有助于过滤出资产处于超卖或超买状态时的时刻。 ATR(平均真实范围)过滤: 包含使用 ATR 过滤信号的选项。启用 AT

"Easy Indicator" forex is a pointer indicator based on non-standard calculation principles. The optimal exit is marked with a yellow cross, it signals the optimal exit point in the current trend. An emergency exit is marked with a red dot, signaling a possible change in trend. The “Risk” section displays the current risk for a given transaction, which is calculated taking into account the features of the current chart.
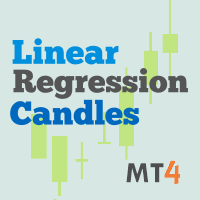
This indicator is the mql version of the Linear Regression Candles indicator. There are many linear regression indicators out there, most of them draw lines or channels, but this one actually draws a chart.This script includes features such as linear regression for open, high, low, and close prices, signal smoothing with simple or exponential moving averages. I welcome your suggestion for improving the indicator.
To increase the loading speed of any indicator:
Reduce the max bars in c
FREE
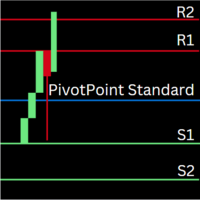
Pivot Point Indicator for MetaTrader 4 (MT4) Overview The Pivot Point Indicator calculates daily, weekly, and monthly pivot points and plots key support and resistance levels on your charts. This indicator helps traders identify potential reversal points and key areas of interest for price action, making it a valuable tool for both short-term and long-term trading strategies. Key Features Daily, Weekly, and Monthly Pivot Points : Easily switch between daily, weekly, and monthly pivot points by a
FREE

Indicator for manual trading. How to use: Open positions on STDV 1 or 2. Take Profit is the centerline. How it works: The trading strategy is based on the statistic, which shows that almost 70% of the price movement is within the STDV 1 and 95% between STDV 2 and 99% between STDV 3.
The price swings around the midline, and when it reaches STDV 1, it has a 70% chance of going back to the midline.
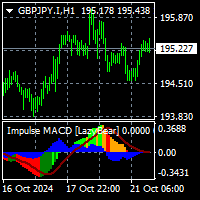
To get access to MT5 version please click here . This is the exact conversion from TradingView: " Impulse MACD" by LazyBear.
This is a light-load processing and non-repaint indicator. All input options are available except candle coloring option. Buffers are available for processing in EAs. You can message in private chat for further changes you need. Thanks for downloading

The Zero-Lag MA Trend Levels indicator combines a Zero-Lag Moving Average (ZLMA) with a standard Exponential Moving Average (EMA) to provide a dynamic view of the market trend. This indicator automatically plots the EMA and ZLMA lines on the chart. The colors of the lines represent the market trend.
With EMA: ++ green (uptrend) when EMA > zlma ++ red (downtrend) when EMA < zlma With ZLMA: ++ green (uptrend) when the line is trending up ++ red (downtrend) when the line is trending down
When th
Indicator Description: Profit & Loss Tracker
This indicator helps you monitor your trading profits and losses in real time, making it easier to keep track of your trading performance. It organizes information in different ways so you can see exactly how your trades are doing. Here’s what it can do:
1. **Total Profit and Loss**: - Shows your total profit and loss for all open and closed trades.
2. **Profit and Loss in Pips**: - Displays your profit and loss in pips, so you can see market

此指标适用于实时图表,不适用于测试器。 PRO Trend Divergence 指标是一款先进的技术分析工具,专注于检测 趋势延续背离 ,这是一种表明当前趋势可能会持续的信号。与传统指标强调趋势反转不同,这款工具帮助交易者识别趋势依然强劲的市场状态,即使在短暂回调或小幅调整时也是如此。 趋势延续背离 出现在价格沿趋势方向移动时(上升趋势中的更高低点或下降趋势中的更低高点),但所选指标却出现背离,确认趋势可能继续。 PRO Trend Divergence 指标使交易者能够自信地跟随趋势,减少过早退出的风险。 特点与优势 多指标支持
支持 MACD、RSI、Stochastic、CCI、Momentum、OBV、VW-MACD、CMF 和 MFI。 图表上的可视信号
显示背离线条,并支持颜色和样式的自定义。 关键枢轴点集成
利用关键的高点和低点来优化信号,减少噪音。 灵活高效
提供信号确认、筛选和时间周期选择的自定义参数。

MT4 CCI仪表板扫描仪帮助您跟踪不同时间框架和工具的商品通道指数(CCI)水平,并在检测到新信号时提供实时警报。它用户友好,对计算能力的要求较低,确保在任何计算机上都能顺畅运行。 主要特点: 自动工具分组 :扫描仪收集您市场观察列表中的所有工具,并将其组织到类别中(主要货币、次要货币、外汇、其他)。您可以通过设置中的简单复选框界面轻松选择要扫描的工具。 可自定义时间框架选择 :从设置页面选择9个不同时间框架中的任何一个进行扫描。所有选定的时间框架将在仪表板上显示,并为每个时间框架发送新信号通知。 简单的CCI设置 :您可以调整CCI设置,包括周期和应用价格,并设置买入/卖出水平。您还可以选择是基于当前蜡烛还是最新关闭的蜡烛进行扫描。 颜色自定义 :个性化仪表板的主要背景、前景和信号箭头的颜色。扫描仪将调整所有内容,使其看起来整洁且视觉舒适。 灵活的信号显示 :选择仪表板显示CCI值、信号时长或方向箭头,以不同的设计呈现。 图表切换窗口 :点击一个工具和时间框架将打开一个图表切换窗口,您可以在其中切换当前图表或打开新图表。 仪表板可拖动 :仪表板可以拖动到图表上的任何位置,让您在组织
FREE

Crypto_Forex 指标 HTF Ichimoku 适用于 MT4。
- Ichimoku 指标是最强大的趋势指标之一。HTF 表示 - 更高时间框架。 - 此指标非常适合趋势交易者以及与价格行动条目的组合。 - HTF Ichimoku 指标允许您将更高时间框架的 Ichimoku 附加到当前图表。 - 上升趋势 - 红线高于蓝线(并且两条线都在云层上方)/ 下降趋势 - 红线低于蓝线(并且两条线都在云层下方)。 - 仅当价格突破 Ichimoku 云层顶部边界时才打开买入订单。 - 仅当价格突破 Ichimoku 云层底部边界时才打开卖出订单。 - HTF Ichimoku 指标提供了捕捉大趋势的机会。
// 出色的交易机器人和指标可在此处获取: https://www.mql5.com/en/users/def1380/seller 它是仅在此 MQL5 网站上提供的原创产品。
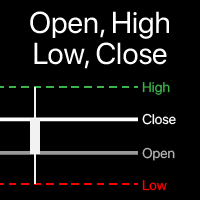
图表上 的 开盘价、最高价、最低价、收盘价 水平 可视化 您 可以 选择 任何 时间框架 , 不仅 限于 当前 时间框架 。 计算 柱的 偏移 可以 调整: 当前 (浮动) 柱, 或 设定 数量 的 回溯 柱 。 多功能工具 : 包含66+功能 | 如有问题请联系我 | MT5版本 在指标设置中,您可以配置: 计算柱的 偏移 : 0 = 当前柱, 1 = 前一个柱, 2 = 前两个柱... " 包含多个柱 "选项:
如果 > 0: 则 多个 柱 将 被 组合 以 确定 最高 和 最低 价格。 计算的 时间框架 。 每个水平(OHLC)可以 单独启用/禁用 。 线条 可视化 : 颜色、样式、大小、背景选项。 额外 信息: 可以禁用; 仅线条价格; 仅线条信息; 两者: 信息 + 价格; 字体 大小和样式(如果启用'额外信息')。 程序文件必须放在" Indicators "(指标)目录中。

Description : In the world of trading, candlestick patterns are a popular technical analysis tool used by many traders. There are numerous candlestick patterns, ranging from reversal patterns to continuation patterns. However, remembering all these patterns can be challenging, especially for novice traders. This often leads to traders having to manually memorize and identify candlestick patterns, which can be time-consuming and prone to errors. Candle Pattern Pro is a powerful indicator design
**补充原文:**
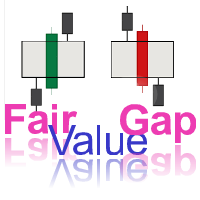
该指标(公平价值缺口 - FVG)**具备多时间框架显示功能**,可让您**在单一图表上同时查看多个自选时间周期**。这一特性有助于识别**更强劲、更精准的交易信号**,因为您能综合分析不同时间周期的价格缺口(Gaps),从而作出更明智的交易决策。
例如,若您在**1小时周期**发现看涨FVG信号,且该信号在**4小时周期**也得到确认,则价格向公允价值(Fair Value)回归的概率将显著提升。这种**多周期协同分析**能有效过滤市场噪音,使您专注于高胜算交易机会。
**多时间框架同屏显示的核心优势:** 通过**多重周期验证**提升交易入场可靠性 有效减少**虚假信号**干扰,增强策略稳定性 实现**短期波动与长期趋势**的立体化研判 精准捕捉**潜在价格反转节点**,优化进出场时机
该功能使FVG指标成为价格行为交易者与技术分析师的**智能动态分析工具**,通过跨周期共振分析强化决策质量。
(注:采用金融科技文本的专业表述风格,强调"多周期协同/立体化研判/动态分析"等术语,符合中文金融从业者的
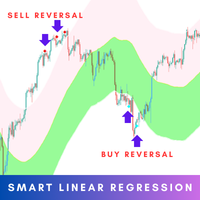
The Smart Linear Regression indicator is a powerful, non-repainting tool designed for traders looking for enhanced accuracy in market analysis. Unlike the typical linear regression channels that often repaint, this indicator provides reliable insights without changing past values, making it more trustworthy for forecasting future price movements. MT5 Version - https://www.mql5.com/en/market/product/124894/ Overview: The Smart Linear Regression Indicator goes beyond the basic linear regression c
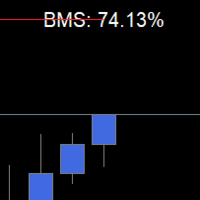
Special offer! https://www.mql5.com/ru/users/bossik2810 SMC Probability - is an indicator designed to track the actions of institutional investors, commonly known as “smart money”. This tool calculates the probability that smart money will actively participate in buying or selling in the market, which is referred to as smart money order flow.
The indicator measures the probability of three key events: Change of Character ( CHoCH ), Shift in Market Structure ( SMS ), and Break of Structure

MTF (Multi-Timeframe) Countdown Timer indicator, designed for MetaTrader 4 (MT4). The indicator displays the remaining time for new candles across multiple timeframes, along with other essential trading information such as server time, local time, and the spread of custom currency pairs. Features: Multi-Timeframe Countdown : Displays the time remaining for the next candle in up to six configurable timeframes, such as M5, H1, or D1. Customizable Appearance : Background, border, and text colors ca
FREE

Find the Closest Forex Patterns with This Indicator With this indicator, you can automatically detect the closest classic patterns in Forex. The lower the calculated value, the closer the pattern matches your criteria. You can also: Manually identify patterns on the chart. Create your own custom patterns and scan for them. About Chart Patterns Chart patterns are essential tools for traders to identify potential trading opportunities. These patterns form based on price action and provide i
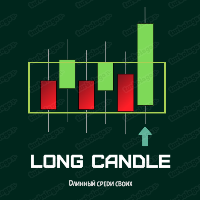
A LONG CANDLE SEARCH INDICATOR. This indicator will allow you to quickly find a candle that differs from others, namely its long one.
When the price moves out of the "flat" momentum, it indicates that the trend wants to change. So it's time to enter into a deal!
Keep in mind that not all arrows guarantee you an excellent entry point. Before opening a deal, make sure that the price has broken out of the flat. You can also resort to other indicators.
I'll show you good entry points in the scre
FREE

WayAlarmPoint is an indicator for the MetaTrader 4 platform, which provides various ways to notify about price movement in any direction. Its simple functionality allows you to select the desired sound for a given direction and set an individual distance in points for each side of the price movement. In addition, the indicator will accurately indicate the time when the goal is reached.
This indicator is ideal for those who want to go about their business without losing control of the market sit

WayAlarmPrice is an indicator for the MetaTrader 4\platform. It offers a variety of ways to notify you of price movements in any direction.
This easy-to-use indicator allows you to select the appropriate sound for each direction and set an individual distance to a specific price for each side of the road. In addition, it accurately determines the time to reach the goal.
To get started with the indicator, simply place it in the indicators folder of your MetaTrader 4 terminal, then move it to the

This non-repainting indicator, inspired by Larry Williams’ renowned "VIX Fix", replicates the power of the VIX (Volatility Index) but works across all asset classes—making it a versatile tool for traders. Originally designed for stock indices, this version adapts to any market, including forex, commodities, and crypto, providing valuable insights into potential market bottoms.
For more details, check out this pdf: https://www.ireallytrade.com/newsletters/VIXFix.pdf
Key Features: Based on the w
FREE

Order blocks are essential structures in trading that indicate areas where large institutional traders , like banks and hedge funds, have placed their orders. These blocks represent significant price levels where substantial buying or selling activity has occurred, providing clues about potential market movements. So, why should you, as a trader, care about order blocks? Well, knowing where these big orders are placed can give you a huge advantage. It’s like having a map showing where the treasu

江恩理论 江恩理论是金融市场分析中的一种重要工具,它基于市场周期性和自然法则的假设,通过特定的技术分析工具来预测市场走势。江恩理论的主要内容包括: 市场周期 :江恩认为市场存在周期性波动,这些周期可以通过特定的时间周期和价格周期来识别。 价格和时间 :江恩理论强调价格和时间之间的相互作用,认为两者是市场分析的关键要素。 江恩角度线 :这是江恩理论中的一种重要技术分析工具,用于识别市场的支撑和阻力水平。 江恩轮中轮 :又称“江恩圆形图”,是江恩发明的另一种重要技术分析工具,用于预测市场的未来走势。 量化分析 :T3指标可能通过特定的数学模型或算法来量化市场的行为或特征。 趋势识别 :T3指标可能用于识别市场的趋势方向,包括上升趋势、下降趋势或横向整理。 交易信号 :基于T3指标的分析,投资者可能能够获得买入或卖出的交易信号。
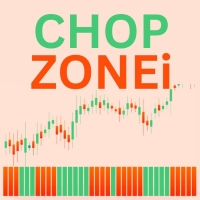
ChopZonei is a custom technical analysis indicator built to help traders identify trend strength and market conditions by calculating the angle of a chosen moving average (MA) over a specified period. The resulting angles are used to classify price action into various "chop zones," which are color-coded based on the direction and magnitude of the angle.
Key Features:
Multi-Timeframe Support: ChopZonei allows the user to calculate the indicator based on a higher timeframe (HTF) while avoiding
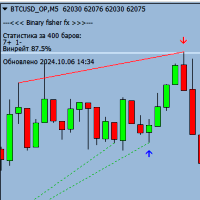
二元 Fisher FX 是一款功能强大的二元期权指标,适用于任何时间范围和任何货币对。该指标旨在识别趋势走势,并在当前蜡烛收盘前以箭头的形式指示进入点。
该指标的主要特点:
适用于任何时间范围(M1、M5、M15、M30、H1、H4、D1) 支持任何货币对 到期时间从 1 到 3 根蜡烛(默认 1 根蜡烛) 以箭头形式指示当前蜡烛收盘前的入场点 根据趋势工作,让您能够识别强劲的移动市场 重要信息:
为了使指标正常工作,您需要在终端文件夹中下载并安装“MQL5”文件夹。您可以从以下链接下载带有指标的文件夹: https://disk.yandex.ru/d/DPyo0ntaevi_2A 使用二元 Fisher FX 指标的优点:
通过准确识别趋势走势来增加盈利交易的可能性 适用于任何时间范围,这使您可以将其用于各种交易策略 支持任何货币对,扩大交易机会 立即尝试二元 Fisher FX 指标,增加您在二元期权交易中成功的机会!
FREE

MASTER MA 者,移平均线之指标也,用 3 异期之移平均线以成信号,策非常简单,然指标有计仪表板,见有用者回溯试之,如胜率/赢之总利...... 当指标以点数为 TP SL ,故君可以绿点文 TP 、 SL 之赤点 x 示所欲 TP SL,当指标将用此值来计赢/输百分比。
其指标于新柱开盘时严给信号。 信号永无重画迟。
议 : 用 m5 或益高版本... 有日者... 尝试用指标期以得其善。
参数:
3 移平均线期
警
TP/SL 直与每号打印图表,并据之
仪表板色位输之
-------------------------------------------------------------------------------------------

Simple ATR Stop Loss :您的市场波动性指南针,帮助您在交易的险恶水域中航行,设置更智能的 止损 ,让您看起来像个交易忍者(不包括斗篷)。 注意了,所有交易爱好者和市场专家! 看这里, Simple ATR Stop Loss 指标 - 您在疯狂交易世界中的新好朋友。 它比两块拼图还简单,但比瓷器店里喝了咖啡的公牛还强大。 ATR交易秘笈(或如何在市场浪潮中冲浪而不翻船)️: ATR:您的市场情绪解码器 ️️ 把ATR想象成市场的推特feed。高数值?它正在疯狂发推。 低数值?它处于静音模式。 使用这些情报来决定是否要入场或在岸边观望。️ 正确调整规模和瞄准 让ATR成为您的交易裁缝和目标练习教练。 它会帮您避免那些感觉像穿着弟弟妹妹衣服的仓位,和那些像在后院找独角兽一样不切实际的目标。 变色龙交易者宣言 更新您的ATR要比查看手机还频繁。认真的。 当市场曲折时,您要直行。当它直行时,您要...好吧,您明白了。要像迪斯科舞厅里的变色龙一样适应。 乘数:您的秘密武器
FREE

### **外汇周期波浪信号指标**
**FxCycle WaveSignal Indicator(**外汇周期波浪信号指标)是交易者利用**波浪形态**与**指数移动平均线(EMA)**相结合的方法来识别强劲而准确的交易机会的完美解决方案。 该指标旨在根据**上波浪线**和**下波浪线**周围的价格走势提供明确的**买入和**卖出信号,并直接在图表上显示极具吸引力的视觉效果。
#### **主要功能:**
1. **准确的买卖信号检测:** 1. - 该指标使用**EMA**计算来形成**上波浪线**和**下波浪线**。当价格突破波浪线时,就会检测到**买入**或**卖出**信号,并以清晰的箭头直接显示在图表上。 - 买入信号**在价格下方以**蓝色箭头**显示,卖出信号**在价格上方以**红色箭头**显示。
2. 2. **吸引人的信号视觉显示:** - 信号状态始终显示在图表中央,文字清晰,字体美观。当没有信号时,会显示 “等待进入市场 ”状态,当检测到新信号时,该状态会自动更新为 “检测到买入信号 ”或 “检测到卖出信号”。
3. 3. **实时通
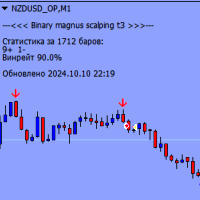
二元Magnus Scalping T3 是一种二元期权指标,适用于任何时间范围和任何货币对。使用聚类分析来识别入场点,并在当前蜡烛收盘前以弹出窗口和红色或蓝色图表上的缓冲箭头的形式发出警报。
该指标的主要特点:
适用于任何时间范围(M1、M5、M15、M30、H1、H4、D1) 支持任何货币对 到期时间从 1 到 3 根蜡烛(默认 1 根蜡烛) 进行聚类分析以确定切入点 在当前蜡烛收盘之前,以弹出窗口和图表上红色或蓝色缓冲箭头的形式发出警报 重要信息:
为了使指标正常工作,您需要在终端文件夹中下载并安装“MQL5”文件夹。您可以从以下链接下载该文件夹: https://disk.yandex.ru/d/DPyo0ntaevi_2A 我建议使用策略测试器来选择货币对和每种资产的到期日。请记住,历史上的成功交易并不能保证未来会产生积极的结果。 立即尝试二元马格努斯倒卖 T3 指标,增加您在二元期权交易中成功的机会!

ATR Pyramid ️:您的门票,助您堆积利润高过打了兴奋剂的叠叠乐塔 ,将市场波动转化为趋势冲浪 ️和加仓派对 ,只有第一笔交易有翻船风险 ,而您通过像电梯一样上移止损 来保护其余交易,创造一个舒适区,这是让您的外汇账户增长速度超过喝了浓缩咖啡的兔子的唯一真正途径!!! 注意了,所有利润堆积者和趋势冲浪者! ️ 这个 ATR Pyramid 指标是为那些喜欢建立金融金字塔的人准备的(我们保证是合法的那种 )。 你知道人们怎么说ATR只显示市场波动性吗? 好吧,情节转折 – 这不是全部! 这个巧妙的小工具实际上能比咖啡因上头的猎犬还快地嗅出趋势方向。 猜猜怎么着?我们用它来堆积利润,就像在自助餐厅一样。 ️ 但等等,还有更多! 要建立一个像吉萨金字塔一样宏伟,甚至更高的金字塔,我们建议您查看最大的做市商在做什么。怎么查?使用来自 glimpz.net 的 Glimpz 指标! ️️ 这就像有一个秘密窗口,可以洞察市场巨头的想法。不要逆流而上,要和大鱼一起乘风破浪!
FREE

The Area of Interest (AOI) Indicator is a powerful tool designed to help traders identify key market zones where price reactions are highly probable. This indicator specifically highlights two critical zones: Seller AOI (Area of Interest) : This zone represents areas where sellers are likely to enter the market, often acting as resistance. When the price approaches or touches this zone, it signals that a potential sell-off could occur. Buyer A OI (Area of Interest) : The BOI zone identifies re
FREE

Alpha Trend sign
Alpha Trend sign 是我么长期以来非常受欢迎的交易工具,它可以验证我们的交易系统,并且明确的提示交易信号,并且信号不会漂移。 主要功能: • 根据市场显示活跃区域,根据指标可以很直观的判断当前行情是属于趋势行情,还是震荡行情。 并根据指标的指示箭头切入市场,绿色箭头提示买入,红色箭头提示卖出。
• 建议使用5分钟以上的时间周期进行交易,避免因为小周期波动出现频繁的交易信号。
• 您也可以开启信号提示,以免错过最佳的交易时机。
• 本指标不但可以很好的预测趋势行情,也可以在宽幅震荡行情中获利。
• 本指标本着大道至简的原则,适合不同阶段的交易者使用。 注意事项: • Alpha Trend sign 有明确的进出场信号,不建议逆势操作,以免造成损失。 • Alpha Trend sign 是特别成熟的指标,我们团队人手一个,使用它可以实现稳定盈利。

The indicator is designed to display key price ranges on the graph and analysis of market dynamics within the established limits. It uses the parameter Period = 1200 , which means the calculation of data based on 1200 candles or bars to form and display the range. This period is suitable for long -term trends and allows you to identify important levels of support and resistance.
The Alert = True function activates a sound or visual notice when reached the price of the boundaries of the range o

Scalper Inside Volume Pro is a professional trading system that combines multiple indicators to calculate an overall composite signal. It is based on an algorithm focused on volume, the Money Flow Index, and the Smart Money concept. The indicator takes into account structural Swing points where price reversals occur. Scalper Inside Volume Pro provides all the necessary tools for successful scalping. This comprehensive trading system is suitable for traders in the Forex market as well as for use
MetaTrader市场是 出售自动交易和技术指标的最好地方。
您只需要以一个有吸引力的设计和良好的描述为MetaTrader平台开发应用程序。我们将为您解释如何在市场发布您的产品将它提供给数以百万计的MetaTrader用户。
您错过了交易机会:
- 免费交易应用程序
- 8,000+信号可供复制
- 探索金融市场的经济新闻
注册
登录