WaveMarkers MT4

Wave Markers:自适应波浪图,附多周期信息面板

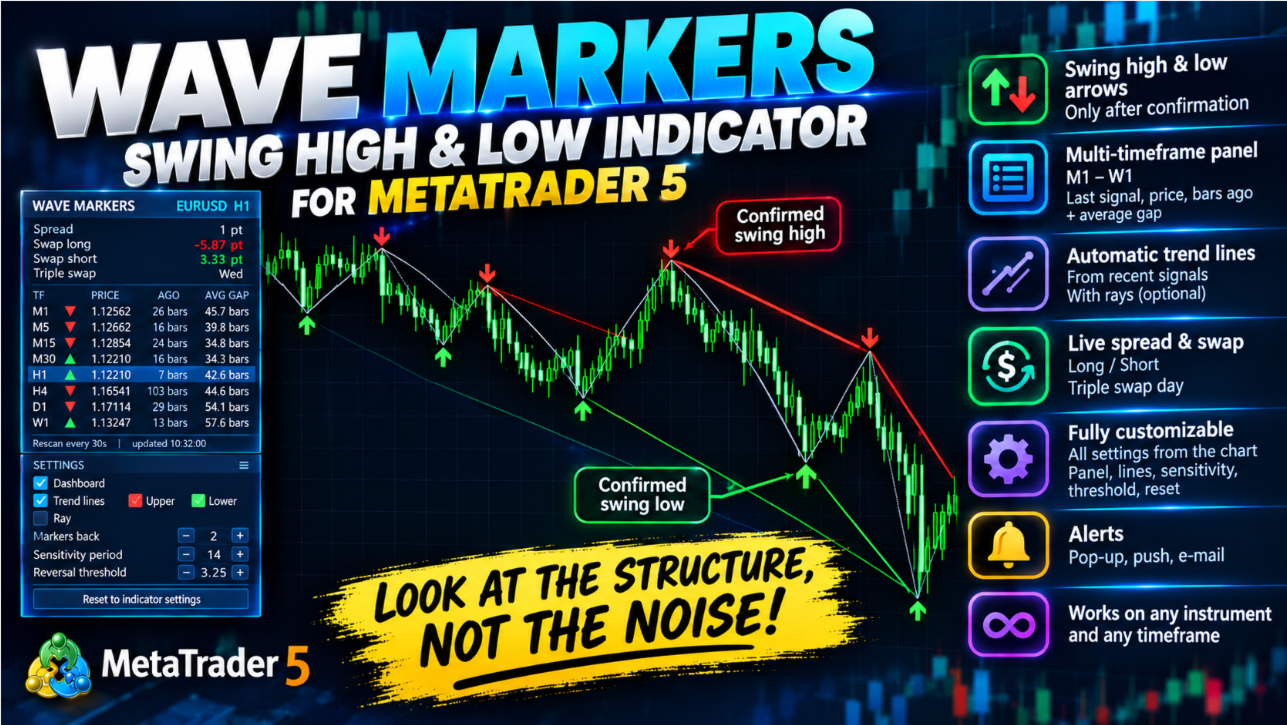
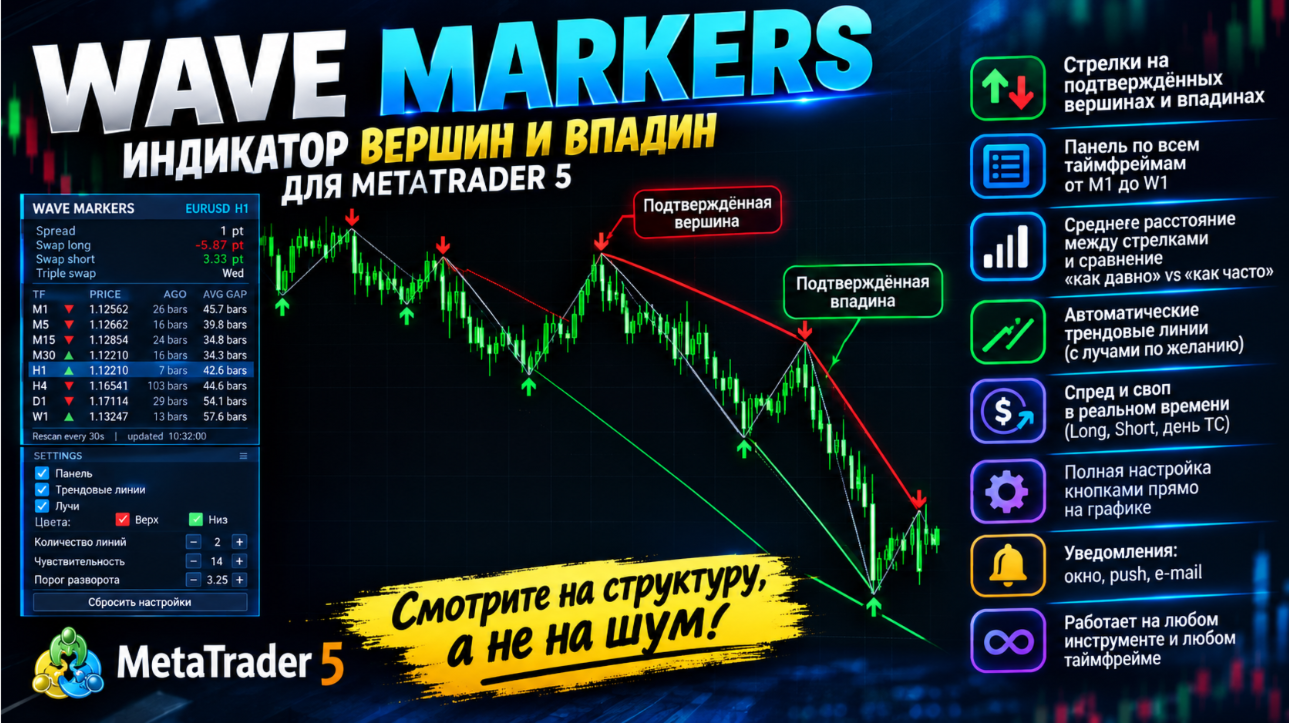
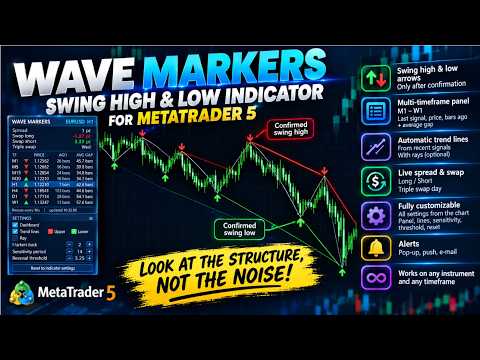
看清市场的真实结构,而不是噪音:已确认的波段高点与低点、穿过它们的趋势线,以及从 M1 到 W1 所有周期的情况,全部集中在一个面板里。

这是什么

Wave Markers 是适用于 MetaTrader 5 的图表结构指标。它会找出价格的转折点(波段高点和波段低点),用简洁的箭头标出,并围绕这些点提供实用工具:趋势线、全周期表格,以及实时点差和隔夜利息(Swap)显示。

指标不会发出"买入"或"卖出"指令,也不承诺任何结果。它只专注做好一件事:告诉你市场在哪里真正发生了转折,帮助你更快、更一致地阅读市场结构。

为什么它不是又一个 ZigZag

传统的 ZigZag 使用固定距离(点数或百分比)来判断什么算转折。这一个数字大多数时候都不合适:市场平静时太大,会错过真正的波浪;市场快速时太小,会产生大量噪音。

Wave Markers 的做法不同:

  • 反转阈值会根据当前波动率自动调整。 阈值以市场自身"典型波动幅度"的倍数来衡量:行情剧烈时自动放宽,行情平静时自动收紧。同一套设置在主要货币对、黄金、指数和加密货币上,以及在不同周期上,都能合理工作。
  • 只有在反转得到确认后才会出现标记。 价格必须真正从极值点回撤达到阈值。没有"偷看未来",也不会在 K 线还在运行时去猜顶部。
  • 确认延迟是明确且可预期的。 延迟由你选择的阈值决定:阈值越高,波浪越少、越重要,确认越晚;阈值越低,标记越频繁、越快。
  • 每个周期使用完全相同的逻辑,所以面板里的各周期之间具有可比性。

主要优势

  • 清晰易读的标记:每个已确认的波段高点上是向下箭头,每个波段低点上是向上箭头
  • 随波动率自适应的阈值,而不是一个固定数字
  • 自动绘制穿过最近标记的趋势线,可选择延伸为射线
  • 覆盖 M1 到 W1 所有周期的面板:最近一个标记的方向、价格、出现在多少根 K 线之前,以及同方向标记之间的平均间隔
  • 同一面板中实时显示点差和隔夜利息(多头、空头及三倍隔夜利息日)
  • 其他周期缺少的历史数据会被自动请求并加载
  • 对终端负担很小:图表上的标记每根新 K 线只重算一次,其他周期按定时器检查,而不是每个报价都计算
  • 所有操作都可以直接在图表上完成,无需打开设置窗口
  • 每出现一个新标记,可发送弹窗、推送和电子邮件提醒
  • 适用于任何品种、任何周期

你在图表上能看到什么

标记与波浪线。 在已确认的波段高点和低点上显示箭头,也可以用一条细线把它们连起来,让波浪一目了然。

趋势线。 指标会分别穿过最近的波段高点和最近的波段低点绘制趋势线。线段数量由你决定:设为 1 时,是穿过该类型最近两个标记的一条线;设为 2 时,是由两条线连接的最近三个标记,依此类推。趋势线可以向右延伸成射线,也可以保持为线段,起点和终点精确落在 K 线的最高价或最低价上。

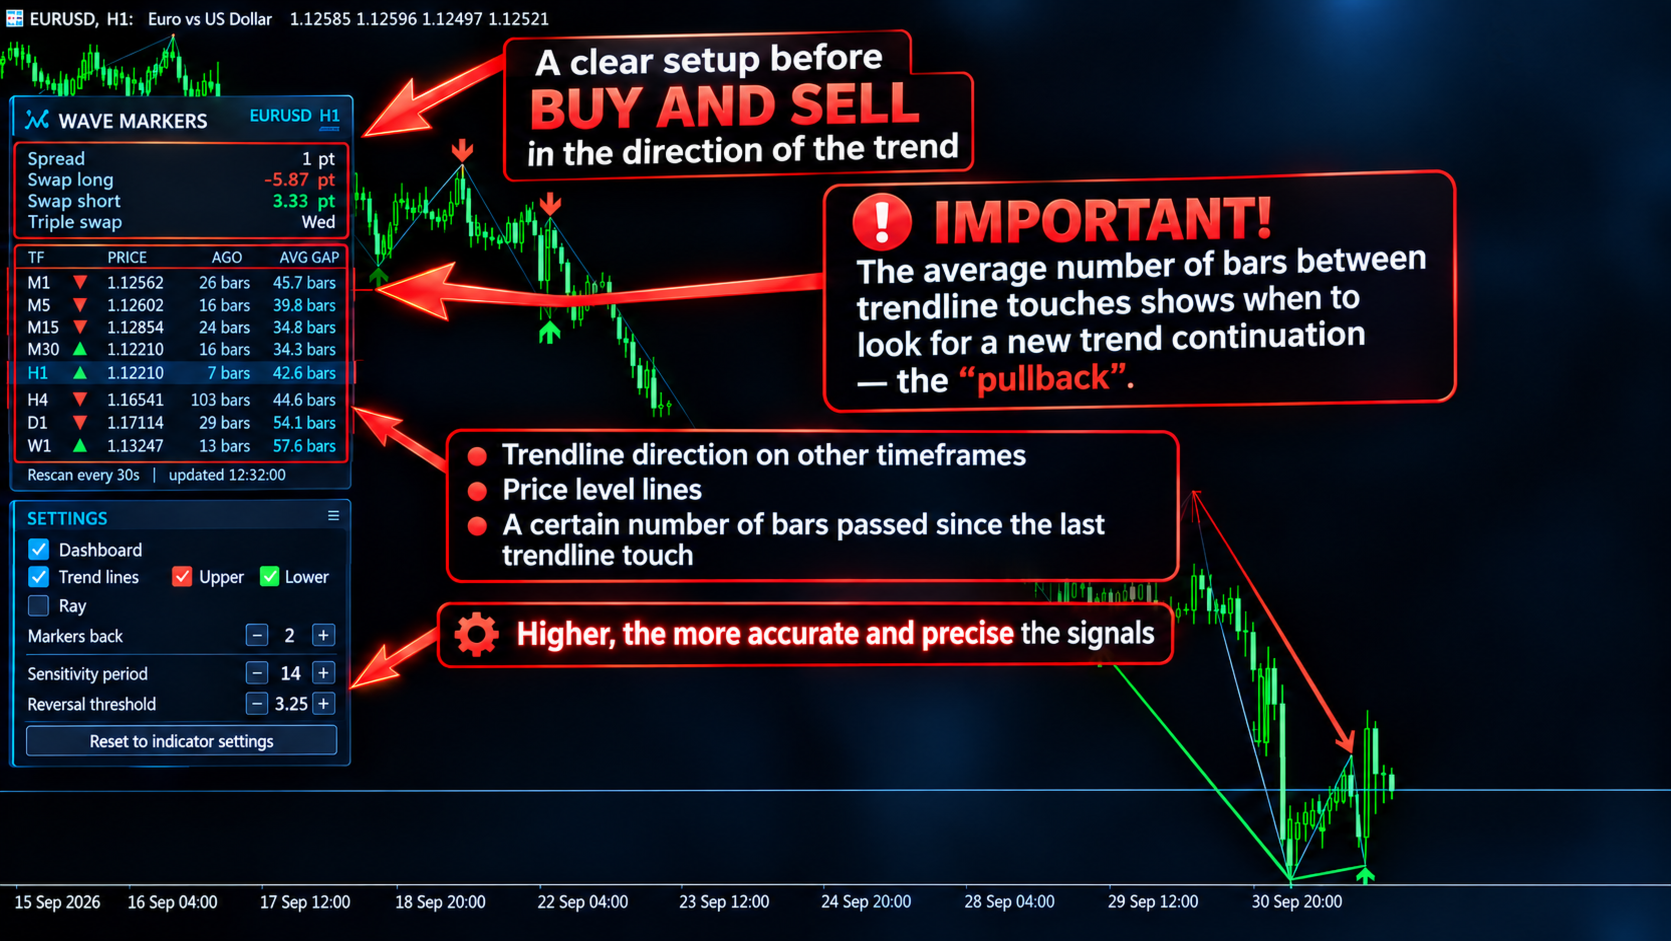
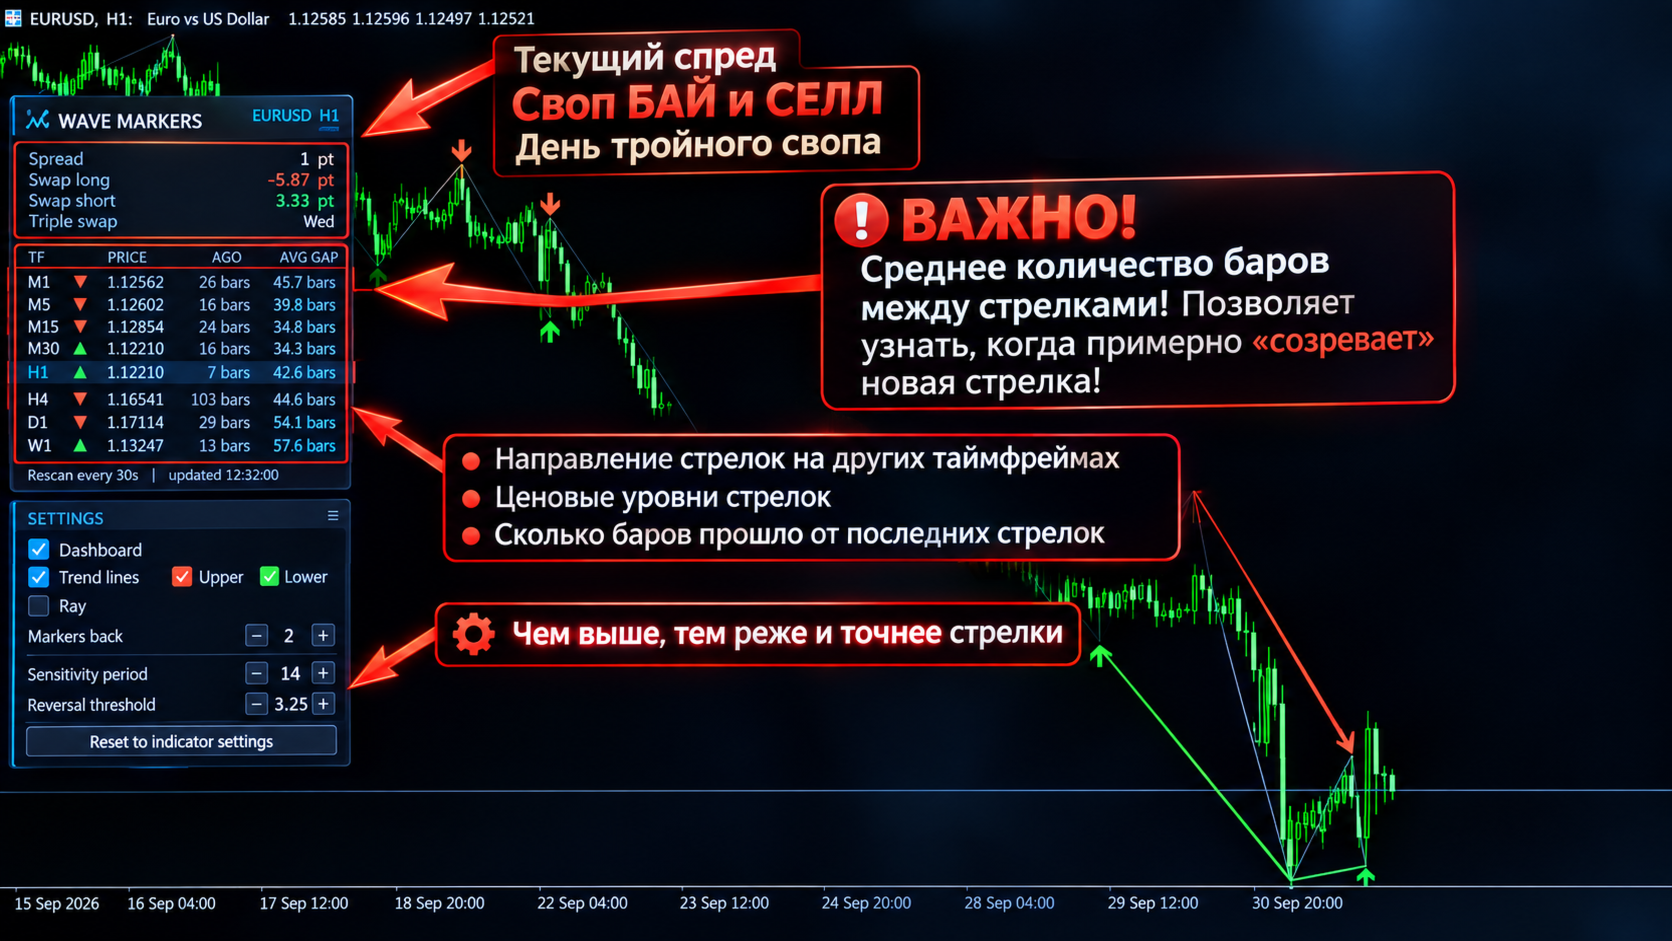
多周期信息面板。 从 M1 到 W1,每个周期一行:

  • 最近一个标记的方向(▼ 高点,▲ 低点)
  • 它的价格
  • 它出现在多少根 K 线之前
  • 在所分析的历史范围内,该方向标记之间的平均 K 线数

把"距今多久"与"通常多久出现一次"对照起来,就能快速感受某个周期正处于其节奏的哪个阶段。

点差与隔夜利息。 当前点差随每个报价更新,超过你设定的水平时可以高亮显示。多头隔夜利息、空头隔夜利息和三倍隔夜利息日都会以适合该品种的单位显示。

图表上的控制面板

主面板下方有一张紧凑的设置卡片。你可以:

  • 隐藏或显示主面板,以便查看被它遮住的那部分图表
  • 开关趋势线,上方线和下方线可分别控制
  • 开关射线
  • 用 "−" 和 "+" 按钮修改线的数量
  • 用 "−" 和 "+" 按钮修改灵敏度周期和反转阈值,并立即看到效果
  • 一键恢复为指标设置中的值
  • 拖动标题栏,把整个面板移到图表上的任意位置

设置窗口中的值是起点,之后以你在图表上的选择为准。切换周期时选择会被保留,"重置"按钮则会恢复原始值。

交易者可以怎样使用

  • 阅读市场结构:更高的高点和低点、更低的高点和低点,以及结构被破坏的位置
  • 自动获得重要的波段位和趋势线,不必再手工绘制
  • 在做决定之前,一眼查看多个周期的情况
  • 比较不同周期上标记出现的节奏
  • 无需离开图表即可关注点差和隔夜利息成本

Wave Markers 是一个分析工具,不保证任何交易结果,所有决策均由你自己作出。任何设置请先在模拟账户上测试。

需要了解的事项

  • 由于标记要在价格反转之后才会确认,所以它出现时总是有延迟。这是设计使然,延迟的大小由反转阈值控制。
  • 其他周期的数据来自你的经纪商的历史数据。如果某个周期显示 "loading...",说明终端仍在构建该周期的 K 线。
  • 要使用电子邮件提醒,需要先在终端中设置邮件(工具 → 选项 → 电子邮件)。

设置说明

Wave Markers

  • Wave markers: sensitivity period:用多少根 K 线来衡量市场的典型波动幅度。数值越小,对波动率变化的反应越快;数值越大,则越平稳。14 是一个不错的起点。
  • Wave markers: reversal threshold, x sensitivity:价格需要从极值点回撤多少(以典型波动幅度的倍数计),标记才会被确认。数值越高,波浪越少、越重要,确认越晚;数值越低,标记越多、越早,但噪音也更多。
  • Analysis depth, bars (per timeframe):指标在每个周期上向前分析多少根 K 线。深度越大,图表和面板统计中包含的历史越多。

Chart Display

  • Show wave markers on chart:开启或关闭箭头。
  • Connect wave markers with a line:用细线连接相邻的标记,便于追踪波浪。
  • Swing high marker color:波段高点上箭头的颜色。
  • Swing low marker color:波段低点上箭头的颜色。
  • Connecting line color:连接标记的线的颜色。
  • Marker size (1-5):箭头大小。
  • Connecting line width (1-5):连接标记的线的粗细。

Dashboard

  • Show info panel on chart:显示面板和图表上的控制卡片。关闭后,指标只使用此设置窗口中的值。
  • Panel offset X, px:面板的初始水平位置。之后可以用鼠标拖动。
  • Panel offset Y, px:面板的初始垂直位置。
  • Other timeframes re-check interval, sec:其他周期多久重新检查一次。当前图表在每根新 K 线时更新,本参数只影响表格(最小 5 秒)。
  • Spread highlight level, points (0 = off):点差超过此水平时,数值会变为橙色。设为 0 则关闭高亮。

Alerts (current timeframe)

  • Popup alert on new wave marker:当新标记被确认时,弹出终端提醒窗口。
  • Push notification on new wave marker:向手机发送通知(需要在终端设置中填写 MetaQuotes ID)。
  • E-mail notification on new wave marker:发送电子邮件(需要在终端中设置邮件)。

Trend Lines (through wave markers)

  • Draw trend lines through wave markers:所有趋势线的总开关。
  • Lines through upper markers (highs):绘制穿过波段高点的线。
  • Lines through lower markers (lows):绘制穿过波段低点的线。
  • Number of lines per side (markers back, 1-50):每一侧绘制多少条线段。设为 1 时,是穿过最近两个标记的一条线;设为 2 时,是由两条线连接的最近三个标记,依此类推。
  • Extend all lines to the right (ray):把每条线向右延伸到图表右边缘。关闭时,每条线只从其标记起始并在标记处结束。
  • Upper line color:穿过波段高点的线的颜色。
  • Lower line color:穿过波段低点的线的颜色。
  • Line style:实线、虚线、点线等。
  • Line width (1-5, solid style only):线的粗细。MetaTrader 只对实线应用大于 1 的粗细。
  • Draw lines behind the chart:把线绘制在 K 线下方,而不是上方。
推荐产品
The indicator plots flexible support and resistance levels (dots). A special phase of movement is used for construction. Levels are formed dynamically, that is, each new candle can continue the level or complete it. The level can provide resistance or support to the price even where it is no longer there. Also, support and resistance levels can change roles. The importance of levels is affected by: the amount of time the level is formed and the number of touches. The significance of these lev
In the context of trading,   Malaysia SNR   (Support and Resistance) refers to the technical analysis of   support and resistance levels   in financial markets, particularly for stocks, indices, or other assets traded. There are three type of Malaysia SNR level Classic , GAP and Flipped 1. Classic Support   is the price level at which an asset tends to stop falling and may start to rebound. It acts as a "floor" where demand is strong enough to prevent the price from dropping further. Resistance
The indicator draws trend lines based on Thomas Demark algorithm. It draws lines from different timeframes on one chart. The timeframes can be higher than or equal to the timeframe of the chart, on which the indicator is used. The indicator considers breakthrough qualifiers (if the conditions are met, an additional symbol appears in the place of the breakthrough) and draws approximate targets (target line above/below the current prices) according to Demark algorithm. Recommended timeframes for t
FiboZag
Andriy Sydoruk
Indicator FiboZag - transfer the indicator to the chart and the Fibonacci levels will be built automatically on the last ZigZag turn. The main advantage lies in the correct construction of Fibonacci levels and markup of price levels. Simple, visual and effective use. The indicator is not redrawn and does not lag. Works on all currency pairs and on all timeframes.
ChartGetSignal
Wartono
1 (1)
Provides instant signals on the chart in panel form. Equipped with signal description and trading analysis tools such as drawing auto trendlines, support/resistance area, regression channel, Fibonacci levels, Pivot levels and current signal price, signal time, signal expiry and stoploss recommendation. Also sending alert messages to all available mt4 alert tool. A detailed description panel provides information about where the signal comes from and what indicators are behind the signal. Includin
Indicator Support and Resistence plain in your chart seven lines; Red line=Resistence 3. Red line=Resistence 2. Red line=Resistence 1. Yellow line= Pivot. Green line= Support 1. Green line= Support 2. Green line= Support 3. adattable in all timeframe (minute 1, minute   5, minute   15, minute   30, Hour 1, Hour 4,Day 1,Week 1,Mounth 1); Buy under support and sell over the resistence;
Pivot Bro
Thushara Dissanayake
5 (1)
Pivot Confluence Zones 是一款 适用 于 MT4 和 MT5 的技术分析指标, 旨在 通过将 枢轴点 、 斐波那契回撤 、   ATR 和 ADR 整合到一个交易工作区中, 识别 回撤区域 、 反转区域 以及 支撑位和阻力位 。该指标并非依赖单一技术工具,而是搜索 多个交易水平重叠的 汇合区域 ,帮助交易者评估可能吸引更多市场关注的区域。为了增强价格分析,该指标还包含 多达 45 种 K 线形态 、 移动平均线趋势过滤器 、交互式绘图工具和可配置的触及价位警报。Pivot Confluence Zones 专为 外汇交易者 、 黄金 (XAUUSD) 交易者 、 指数交易 者 、 加密货币 交易者 、 短线 交易 者 、 日内交易者 、 波段交易者 、 价格行为交易者 和 趋势交易者 而设计,在一个集成的仪表板中提供了一种结构化的方法,用于分析市场结构、规划入场和出场点以及管理重要的交易水平。 核心功能 枢轴汇合区指标将多种常用的技术分析方法整合到一个指标中,简化了图表分析和日常交易准备。该指标无需手动绘制和管理多个工具,即可自动计算重要的 枢轴点 、 斐波那契
The Auto Super Pivot indicator is an indicator designed to calculate support points and resistance points for pivot points. this indicator has the ability to calculate standard pivot, fibonacci, camarilla, woodie and demark pivot points. It also allows you to use all time zones with the time frame feature. Another feature of the indicator is the auto time slice feature. This feature allows automatic calculations without having to set any time zone. Features 6 different pivot calculation modes A
RelicusRoad Daily Pivots 是适用于 MetaTrader 4 和 MetaTrader 5 的日内枢轴价位指标,将前一日区间划分为斐波那契价位,并向上下两侧延伸,范围从负 100% 到正 200%。 指标不采用经典的地板枢轴公式,而是把前一个已完成的区间当作一把刻度尺,最低价为 0%,最高价为 100%。图表右侧以紧凑的彩色标记打印出十九个价位,因此今日行情的大小可以直接读作昨日区间的分数或倍数。 工作原理 指标取前一个已完成参考周期的最高价与最低价,并在该区间的每个比例处放置一个价位:价位 = 最低价 + 比例 x(最高价 − 最低价)。周末的 K 线会被跳过,因此周一的参考是上一个交易日。参考周期由图表周期决定。 Inside set, gray:0%、23.6%、38.2%、50.0%、61.8%、78.6% 与 100%。 Above set, green:+123.6%、+138.2%、+150.0%、+161.8%、+178.6% 与 +200%。 Below set, red:-23.6%、-38.2%、-50.0%、-61.8%、-78.6% 与
FREE
Pivots
Paul Geirnaerdt
Pivots is an indicator to show pivots for relevant time frames. Besides the pivots the indicator can also show daly open line, the resistance and support levels, the ADR Fibonacci levels and the order of the pivots. Pivots includes an intelligent algorithm to eliminate Sunday candles, but only if your broker provides those. Pivots are significant price levels that may serve as support, resistance or breakout levels Settings textFont - font to use for the labels. textSize - font size. textColor -
support resistance levels indicator mt4: 此工具是一个多时间框架指标,能够在图表上识别和绘制支持和阻力线以及斐波那契水平,其准确性与人眼相同。TW 外汇支持和阻力水平具有复杂的算法,可以扫描图表以识别先前的价格稳定和反弹水平,并记录触碰次数。 您是否厌倦了手动绘制支持和阻力水平以及斐波那契回撤? 查看此产品的功能;您会感到惊讶。 产品特点: 1. 次要和主要水平:您可以根据自己的喜好自定义次要和主要水平,并使用高级算法删除额外水平。 2. 水平触碰次数:TW 支持阻力水平与突破 mt4,计算并提供每个水平在过去被触碰的次数,使您能够评估每个水平的强度。 3. 斐波那契水平:最后一波的斐波那契水平动态绘制,这使您能够检查这些水平与静态支持和阻力水平计算器获得的值之间的对齐。 4. 开发者缓冲区:该产品包括开发交易策略所需的缓冲区。 5. 适用于所有货币和时间框架:您可以将 TW 支持和阻力水平用于黄金、欧元、英镑、美元等。 6. 简单且可定制的用户界面:该产品的用户界面非常简单且可定制,允许您根据自己的喜好个性化或禁用颜色和项
GND Entry Signals
Nguyen Dang Giang
This is indicator signals entry buy or sell for trader. It notification price entry to trader and price Stop Loss and price Take Profit. Indicator price for entry orders Pending Limit. Input Parameters On Alert - true/false (Displays a message in a separate window.) On Send Notification - false/true. (Sends push notifications to the mobile terminals, whose Meta Quotes IDs are specified in the "Notifications" tab. (Strict use restrictions are set for the SendNotification() function: no more than
價格樞軸點 H1 - 顯示 H1 時間框架上的價格樞軸點的指標,準確度高達 95%。來自 100 的 95 個信號將準確指示相反方向的價格反轉位置。指標不會重繪其值。適用於任何貨幣對的交易。它可用於日內剝頭皮和長期交易。價格樞軸點 H1 將信號顯示為箭頭。當價格反轉時,指標將在圖表上繪製一個箭頭。如果價格上漲,指標會畫一個藍色箭頭,當價格下跌時,指標會畫一個紅色箭頭。信號的準確性使您能夠建立有效的交易策略。我們採用 Sonic 標誌來強調信號的速度。在 93% 的情況下,信號是在價格反轉的那一刻準確繪製的。他們沒有遲到。信號非常快。只有在 5% 時,價格不會立即反轉,而是在幾根柱之後反轉。 指標的好處: 未重繪 向交易者顯示價格方向的變化 非常簡單易用 無需其他設置和設置文件 適用於所有貨幣對 可以使用任何時間範圍。但最準確的信號是在 H1、H4 上。 適合二元期權交易! 指標設置: period - 指標週期。該值越高,過濾器的作用越強,指標繪製的信號就越少。 每個購買此指標並留下評論的人都將收到額外的非常有價值的禮物。購買後私信給我們留言,我們將送你一份禮物!
Insider Sniper MTF
Yaroslav Varankin
This is a dial indicator for trading from the level of support resistance  --- complete lack of redrawing ---  He is able to determine the levels of support resistance  Finds the best entry points and shows them with arrows.  If a trend is forming, the indicator will always notify with a arrow signal.  buy signal blue arrow for sale red arrow  This signaling tool can also be used on a sideways market.  The main thing is that it is volatile.!!!!!!  Good percentage of correct indicator predictio
KT Asian Breakout Indicator
KEENBASE SOFTWARE SOLUTIONS
标记亚洲时段区间 KT Asian Breakout Indicator 标记四小时亚洲交易时段窗口的最高价和最低价,并在区间完成后继续监测价格。GMT Offset 用于使时段与经纪商服务器时间保持一致,Draw Session Box 用于控制是否在图表上显示该区间。 同时查看突破与交易水平 当价格收盘于时段最高价上方时,指标显示看涨箭头。当价格收盘于时段最低价下方时,指标显示看跌箭头。启用 Draw Stoploss and Profit Targets 后,图表会添加入场线、位于区间另一侧的 Stop Loss,以及三个计算得出的目标水平。 看涨突破: 使用时段最低价作为保护水平。 看跌突破: 使用时段最高价作为保护水平。 目标 1、2 和 3: 根据区间大小和当前波动率提供分阶段参考水平。 突破状态: 识别突破蜡烛相对于时段区间明显偏大的情况。 查看历史信号表现 Performance Analysis 分析已加载图表中的已完成信号,并可显示 Total Signals、Win/Loss、Success Rate、以点数表示的 Average Profit,以及当前突破状态。
ZigZag Extras Display BreakOut points ZigZag Extras Display BreakOut points is a MetaTrader 4 indicator for traders who use ZigZag, breakout points, market structure, BOS, CHoCH, swing high, swing low, support and resistance, and higher timeframe bias in their trading analysis. Main Benefits Displays confirmed ZigZag swing highs and swing lows Marks BOS Up, BOS Down, CHoCH Up and CHoCH Down Shows Depth Highest High and Depth Lowest Low lines Adds HH, HL, LH and LL structure labels Includes HTF b
Trend Divergence Indicator: Your Essential Tool for Market Analysis The Trend Divergence Indicator is a powerful tool designed to assist traders in identifying market trends and pinpointing entry points with precision. By leveraging price divergence, this indicator enhances your trading strategy, offering reliable insights and filtering unnecessary signals. Key Features and Benefits of the Trend Divergence Indicator Accurate Trend Analysis: The Trend Divergence Indicator uses price divergence t
Auto Trade Pivot
Yonggang Shang
优化版基于轴心指标的自适应支撑、阻力、信号线指标,没有任何参数,简单易用,适用于日图及以下周期。 优势: 适用于所有品种。 适用于所有周期。 指标会随数据的变化自动变化,指标更准确。 使用说明: 如果当前价格向上突破信号线,趋势看多,初步目标为上方阻力线;价格向下突破信号线,趋势看空,初步目标为下方支撑线。 如果当前三条曲线同时向上, 趋势 看多;反之三条曲线同时向下,趋势看空。 大家有任何问题都可以联系我,我会及时回复大家,谢谢。 telegram联系方式: https://t.me/ai_trade_best MQL5联系方式:   https://www.mql5.com/en/users/zhihui_dianjin
The   Angle Prices   indicator is a tool that calculates the price angle based on price analysis, interpreting the time vector in the form of price points on the price chart. In other words, the X axis and Y axis are represented as price points, so you can actually calculate the angle with two axes of the same dimension. This allows traders to obtain information about the direction of price movement and possible entry or exit points for trades. Let's look at the main characteristics and interpr
Divergence Sync
Pavel Verveyko
5 (1)
Divergence and Convergence are important harbingers of reversals in stock markets. The Divergence Sync indicator is designed to automatically search for divergences on a large number of indicators with different parameters. The search for divergences is carried out on these indicators: (CCI, CHO, DeMarker, MACD, MFI, Momentum, OBV, OsMA, RSI, Stochastic, WPR, Awesome Oscillator ). To search for divergences, you can use one technical indicator or search simultaneously on any number of indicator
This indicator is designed based on Mr.   WD   Gann's square of nine methods. Using this indicator, we can enter the desired   pivot   price and, based on the coefficient we assign to it, extract 8   support and resistance   numbers with 8 angles of 45, 90, 135, 180, 225, 270, 315, and 360. Calculates 8   support and resistance   points and draws   support and resistance   lines. The coefficient is to triple the number of executions. To select   pivot points   in which a price is a large nu
BuySell FibPiv
Huu Tri Nguyen
BuySell FibPiv Fibonacci Pivot Level Indicator with Dynamic Support and Resistance Zones Overview BuySell FibPiv is a Fibonacci pivot-based technical analysis indicator designed to calculate dynamic support and resistance levels using previous session price data. The indicator applies Fibonacci expansion and retracement calculations to generate multiple pivot-based levels for intraday and swing trading analysis. It provides: Central pivot calculation Fibonacci-based support and resistance zones
Owl smart levels
Sergey Ermolov
4.26 (38)
在顺势交易中,主要的难点不在于找到一个水平位,而在于理解哪里才是一个真正有效的入场点。 价格经常对水平位产生反应,但无法延续 движение — 这会导致错误入场或错过行情。 Owl Smart Levels 不仅仅显示水平位 ,还会基于市场结构和回调构建区域。这使你可以以不同的方式评估入场点,并避免一部分虚假信号。 Owl Smart Levels 系统包含什么? Owl Smart Levels 不只是标记水平位,而是一个 完整的交易模型 ,其中每个元素相互配合。 系统包含: Owl Smart Levels(指标) 显示趋势方向、回调区域,以及预定义的入场、止损和止盈水平 系统指南 解释如何在实战中使用信号:哪些情况需要考虑,哪些需要忽略,以及如何管理交易 交易决策清单 帮助你快速评估信号,避免基于“感觉”入场 Owl Helper 辅助EA 简化交易执行和管理 (一键下单) 说明、示例和策略 帮助你快速上手,并在实践中理解系统逻辑 最终,你获得的不是一个单独的工具,而是一个完整的交易框架 —— 从分析到执行。 阅读更多: Owl Smart Levels 如何发展
Pivot Points MT4
KEENBASE SOFTWARE SOLUTIONS
KT Pivot Points 会根据最新市场数据自动在图表上绘制每日、每周和每月的枢轴点位。这是外汇市场中广泛使用的技术分析工具之一,用于识别潜在的支撑和阻力区域。 功能特点 当价格触及枢轴点时发送提醒。  每种枢轴点类型都支持全面自定义。   无须复杂设置即可显示日线、周线和月线的枢轴点位。 占用 CPU 资源极少,计算速度快。 可与图表上的其他指标兼容使用。 什么是枢轴点 枢轴点是通过上一交易日(或交易周期)的最高价、最低价和收盘价计算出的平均值。  通过计算得出的枢轴点可以预测未来的支撑和阻力位,帮助判断价格在这些关键水平附近的走势。 通常认为,如果价格高于枢轴点,市场情绪偏多;反之,则偏空。 枢轴点计算公式 我们使用前一天、一周或一个月的最高价、最低价和收盘价来计算枢轴点水平。 P = (H + L + C) / 3 R1 = P + (P − L) = 2×P − L S1 = P − (H − P) = 2×P − H R2 = P + (H − L) S2 = P − (H − L) R3 = H + 2×(P − L) = R1 + (H − L) S3 =
Point Implant
Nadiya Mirosh
What are "pivot points"? Pivot point analysis is often used in conjunction with the calculation of support and resistance levels, as is the case with trend line analysis. Pivot point analysis calculates the first support and resistance levels using the trading range width between the pivot point and the previous day's high or low price. The second support and resistance levels are calculated using the entire width between the previous day's high and low prices. Looking for a quality pivot poin
If you're familiar with COP, OP, and XOP levels, this indicator is definitely worth considering. There's no need to manually plot the ABC levels, as the indicator automatically calculates and displays the OP projection levels for you, updating regularly as the price changes. This is an essential indicator for your trading toolkit. Please if you are unsual on how to use this indicator feel fell to ask me for help and i can assist you where i can. Happy trading!
特别优惠 : ALL TOOLS ,仅 $35  每个! 新工具   售价   $30   首   一周   或   前 3 次购买 !  MQL5 Trading Tools 频道 :加入我的 MQL5 频道,获取最新动态 Deviation Trend Profile Scanner (DTPS) 是一款指标,可检测趋势方向、测量波动强度,并在一个表格中整理多个品种/时间框的数据。它通过可配置的移动平均线、自适应标准差区和分布直方图,提供基于统计的简洁价格行为视图。 查看 MT5 版本:  Deviation Trend Profile MT5 Scanner 查看更多产品:   All P roducts 1. 概述 该指标集成三大组件: 移动平均线 (MA) 标准差区间 (±1, ±2, ±3 × ATR) 趋势分布概况(直方图) 2. 核心概念 MA 斜率 (|Slope| > 0.1):  检测趋势变化——正值 = 多头,负值 = 空头 标准差带 (±1/±2/±3) × ATR:  从 MA 测量,形成波动率“漏斗” MA : 趋势基线;可选 SMA、EMA、SMMA、
Fibonacci Auto Levels
Mohamed yehia Osman
Possible Price reversals levels - based on  Fibonacci + Support +  Resistance Levels Auto levels drawn based on input index (Bars Count )  ---->>> Price Over 50% Fibo line ---> UP TREND ---> BUY when price drop near Support Lines  ---->>> Price Down 50% Fibo line ---> DOWN TREND ---> SELL when price goes up  near Resistance Lines  --->>> The more close price levels ----> the more possibility for price reversals --->>> are you a scalper --> try it on M1 charts with big index like 5000 bars  or
Fair Value Gap (FVG) & Inversion Fair Value Gap (iFVG) (公允价值缺口与反转公允价值缺口) 在 ICT (Inner Circle Trader) 和 Smart Money Concepts (SMC) 交易体系中,公允价值缺口 (Fair Value Gap, 简称 FVG)——也称为失衡区 (Imbalance)——发生在价格以极端的动能移动时,留下了一个流动性空白区。这些未填补的缺口充当未来价格行为的磁铁,使其成为专业交易者概率最高的回撤区和进场区。 但并非所有的 FVG 都是平等的。您如何知道哪个缺口具有真正的机构分量? 隆重推出 FVG & iFVG Pro 指标。 我们将标准的失衡检测提升到了一个新的水平。该工具不仅能以极高的精度自动检测新鲜 (Fresh)、已缓解 (Mitigated) 和反转公允价值缺口 (iFVG),还具备 首创的动态评分系统 。现在,您甚至可以直接看到每个 FVG 区域内部隐藏的买入和卖出压力! 停止手动绘制区域。让算法为您完成繁重的工作,从而让您可以专注于执行交易。 全新独家功能:动态区域评
This is the Full Version, to get the free version please contact me. The free version works on “GBPCHF” charts. All symbols and time frames scanner. Harmonic Pattern Harmonic patterns are used in technical analysis that traders use to find trend reversals. They are considered one of the most accurate technical analysis tools, as they allow traders to predict the future price movement direction and the potential trend targets. Also, unlike many other technical tools, the number of false signals
该产品的买家也购买
Trend SniperX MT4
Sarvarbek Abduvoxobov
5 (3)
Trend Sniper X 是一款用于 MetaTrader 5 的多周期趋势追踪指标,旨在帮助交易者清晰、精准地识别趋势方向及潜在的反转点。 适用于 MT5: https://www.mql5.com/en/market/product/181101 价格信息: 当前价格为促销价,随着后续更新和新功能的推出,价格可能会发生变动。 Code2Profit 频道 通过多周期分析掌控市场! 如何使用 Trend Sniper X 最大化胜率:关键规则与交易时段技巧 技术规格 交易平台 MetaTrader 5 指标类型 多周期趋势指标 运行时间周期 任意图表周期,支持独立选择更高周期(M1–MN1) 主要交易品种 外汇、黄金 (XAUUSD) 及其他 CFD 差价合约 推荐账户 任何账户类型 可视化呈现 彩色趋势 K 线(买入/卖出/弱势/转变)+ 买入/卖出信号箭头 附加模块 市场交易时段框(悉尼、东京、伦敦、纽约) 核心功能 多周期趋势分析: 将更高周期的趋势方向直接投影到当前图表上,提供清晰的宏观视角。 弱势/不确定 K 线检测: 高亮显示趋势状况不明确的 K 线,帮助交易者远离震
Miraculous Indicator Binary & Forex v3 StrategySafe Miraculous Indicator Binary & Forex v3 StrategySafe 是一款专业交易指标,适合希望获得清晰信号、强大确认工具以及结构化交易方式的 Binary 和 Forex 交易者。 v3 版本加入了 MIR Dashboard、Miraculous Confirmation Dashboard、GANN Law、Square of 9 水平线、GANN 角度以及更强的 Forex 分析模式。 核心功能 同时支持 Binary 和 Forex 交易模式。 MIR Dashboard 可快速读取市场状态。 Miraculous Confirmation Dashboard 用于确认交易机会。 GANN Law drawing lines 用于 Forex 市场结构分析。 Square of 9 线条、方向和关键价格水平。 1x1 GANN Angle 用于判断趋势压力。 Entry Information TP 帮助寻找合理止盈区域。 Strateg
SR Liquidity
Oleg Rodin
5 (2)
SR Liquidity 是一款旨在揭示市场流动性高度集中且价格反应最剧烈的隐蔽区域的交易指标。这些特殊的流动性区域充当着强有力的支撑位与阻力位,为您清晰呈现市场最可能发生反转的位置。 SR Liquidity 指标并非简单地绘制常规的支撑/阻力线,而是通过分析实际的价格行为,识别买卖压力积聚的区域。这些区域实际上是推动市场真实波动的流动性池。通过在图表上直观呈现这些区域,该指标能助您在价格反应发生前预判走势——这意味着它实际上能够预测价格方向可能发生的变化。它将原始的价格行为转化为清晰且具实操价值的市场蓝图,标示出那些可能成为市场转折点的关键价位。 该指标适用于任何交易品种和时间周期——包括外汇、指数、金属、加密货币等。支持任意时间周期。 购买后请联系我,以获取交易指南及免费赠送的优质附加指标!
Gann Made Easy
Oleg Rodin
4.84 (172)
Gann Made Easy 是一个专业且易于使用的外汇交易系统,它基于使用先生理论的最佳交易原则。 W.D.江恩。该指标提供准确的买入和卖出信号,包括止损和获利水平。您甚至可以使用推送通知在旅途中进行交易。 购买后请联系我,即可免费获得交易指导和超棒的额外指标! 您可能已经多次听说过江恩交易方法。通常 Gann 的理论不仅对于新手交易者而且对于那些已经有一定交易经验的人来说都是非常复杂的东西。这是因为江恩的交易方法在理论上并不那么容易应用。我花了几年时间来完善这些知识,并将最好的原则应用到我的外汇指标中。 该指标非常易于应用。您所需要的只是将其附加到您的图表并遵循简单的交易建议。该指标不断进行市场分析工作并寻找交易机会。当它检测到一个好的入口点时,它会为您提供一个箭头信号。该指标还显示止损和获利水平。 换句话说,当您像先生一样进行交易时,该指标会为您提供最佳江恩建议。江恩亲自告诉你此时此刻该做什么。但最好的部分是您不需要了解任何有关江恩交易原则的知识,因为该指标会为您完成整个市场分析工作。
PTS Precision Index Oscillator V2
PrecisionTradingSystems
5 (1)
精密指数振荡器(Pi-Osc)由Precision Trading Systems的Roger Medcalf开发 版本2经过精心重新编码,以在您的图表上加载速度非常快,还加入了一些其他技术改进,以提高体验。 Pi-Osc旨在提供准确的交易定时信号,旨在找到极端的耗尽点,这些点是市场被迫去触及,以清理每个人的止损单。 该产品解决了一个古老的问题,即知道极端点在哪里,这使得交易员的生活变得更加简单。 这是一个高度复杂的共识指标,与行业标准的振荡器相比,具有一些强大的区别。 它使用的一些特征包括需求指数、资金流动、RSI、随机指标、模式识别、成交量分析、标准偏差极端点以及不同长度上述各种变化的分歧。 乍一看,对于未经培训的人来说,它似乎与任何其他振荡器没有什么不同,但当与其他振荡器(如RSI或动量等)相对比时,这个指标的真正威力开始显现。 据我所知,没有其他振荡器可以频繁地精确指出顶部和底部,具有相同的定期效率。 精密指数振荡器由许多不同的数学方程组成,用于测量多个时间框架采样中的价格和成交量变动,从而高度准确地预测趋势可能发生转折的位置。 PTS Pi-Osc V2非
DayTrader PRO MT4
Davit Beridze
4.6 (10)
DayTrader PRO MT5:  https://www.mql5.com/en/market/product/186222 DayTrader PRO 是一款先进的交易指标,它结合了约翰·埃勒斯 (John Ehlers) 的 Laguerre 滤波器与强大的自动优化引擎。该指标不依赖固定的参数,而是根据最新的市场状况自动搜寻最佳设置,帮助您在无需手动调整的情况下适应不断变化的市场波动。 该指标可生成清晰的买入 (BUY) 和卖出 (SELL) 信号,并提供根据当前市场波动率计算得出的自适应止损 (Stop Loss) 和止盈 (Take Profit) 水平。内置的趋势、效率系数 (Efficiency Ratio)、波动率和蜡烛图过滤功能,有助于剔除低质量的交易设置,从而提高信号的准确性。 实时性能面板会显示当前已优化的设置、利润因子 (Profit Factor)、胜率 (Win Rate)、回撤 (Drawdown) 以及其他交易统计数据。DayTrader PRO 还支持弹出窗口、推送、邮件和声音提醒,确保您不会错过任何交易机会。 主要功能 全自动参数优化 自适应买入
Currency Strength Wizard
Oleg Rodin
4.85 (61)
货币强度向导是一个非常强大的指标,为您提供成功交易的一体化解决方案。该指标使用多个时间范围内所有货币的数据来计算这个或那个外汇对的力量。此数据以易于使用的货币指数和货币电力线的形式表示,您可以使用它们来查看这种或那种货币的力量。 您所需要的只是将指标附加到您要交易的图表上,该指标将向您显示您交易的货币的真实强度。该指标还向您显示买卖量压力的极值,您可以在顺势交易时利用这些压力。该指标还显示了基于斐波那契的可能目标。该指标可用于各种交易时间范围。该指标支持各种货币对的交易。 该指标为您提供所有类型的警报,包括推送通知。 购买后请联系我。我将与您分享我的交易技巧,并免费为您提供丰厚的红利指标! 祝您交易愉快,获利丰厚!
M1 Sniper
Oleg Rodin
4.97 (30)
M1 SNIPER 是一款易于使用的交易指标系统。它是一个专为 M1 时间框架设计的箭头指标。该指标可以作为独立的系统在 M1 时间框架下进行剥头皮交易,也可以作为您现有交易系统的一部分使用。虽然该交易系统专为 M1 时间框架交易而设计,但它也可以用于其他时间框架。我最初设计此方法是为了交易 XAUUSD 和 BTCUSD。但我发现这种方法在其他市场交易中也同样有用。 指标信号既可以顺势交易,也可以逆势交易。我教授一种特殊的交易技巧,帮助您利用指标信号进行双向交易。该方法基于使用特殊的动态支撑位和阻力位区域。 购买后,您可以立即下载 M1 SNIPER 箭头指标。此外,我还为所有 M1 SNIPER 工具用户免费提供下方屏幕截图所示的 Apollo Dynamic SR 指标!这两个指标的组合可以帮助您更轻松、更准确地利用 M1 时间框架进行交易。 购买后请联系我,免费获取交易提示和奖励指标! 祝您交易成功!
PRO Renko System
Oleg Rodin
5 (31)
PRO Renko Arrow Based System for trading renko charts.  准确的信号交易任何外汇工具. 另外,我将免费提供系统的附加模块! PRO Renko系统是RENKO图表上高度准确的交易系统。该系统是通用的。 该交易系统可应用于各种交易工具。 该系统有效地中和了所谓的市场噪音,打开了获得准确反转信号的通道。 该指标易于使用,只有一个参数负责产生信号。 您可以很容易地使算法适应您感兴趣的交易工具和renko酒吧的大小。 我很乐意通过提供任何咨询支持来帮助所有客户有效地使用该指标。 祝您交易成功!购买后,立即写信给我! 我将与您分享我的建议和我的renko发电机。 另外,我将免费提供系统的附加模块!
PZ Swing Trading
PZ TRADING SLU
5 (3)
Swing Trading 是第一个旨在检测趋势方向的波动和可能的反转波动的指标。它使用在交易文献中广泛描述的基准摆动交易方法。该指标研究多个价格和时间向量,以追踪总体趋势方向,并检测市场超卖或超买并准备好进行修正的情况。 [ 安装指南 | 更新指南 | 故障排除 | 常见问题 | 所有产品 ] 市场波动的利润不会被窃取 指示器始终显示趋势方向 彩色价格带代表机会基准 彩色虚线表示可能的反转波动 该指标分析其自身的质量和性能 它实现了一个多时间仪表板 可定制的趋势和波动周期 它实现了电子邮件/声音/推送警报 指示器为非重涂或重涂 什么是摇摆交易 摇摆交易是一种尝试在一天到一周内从证券中获得收益的交易方式,尽管某些交易最终可以保持更长的寿命。摇摆交易者使用技术分析来买入弱点和卖出力量,并有耐心等待这些机会的发生,因为在发生一波抛售浪潮之后购买证券而不是陷入抛售更有意义。 机会基准 关于历史数据的大量研究证明,适合于波动交易的市场倾向于在基线价格带上下交易,基线价格带由图表显示,使用平均真实区间计算得出。波动交易者使用基线,该策略是购买常态和卖出躁狂,或做空常态并掩盖沮丧。在没有疲
Smart Trend Trading System
Issam Kassas
4.8 (10)
本产品已针对 2026 年市场进行更新,并针对最新 MT5 版本进行了优化。 价格更新通知: Smart Trend Trading System 目前价格为 $99 。 接下来的 30 次购买 后,价格将上涨至 $199 。 特别优惠: 购买 Smart Trend Trading System 后,请发送私信给我,即可免费领取 Smart Universal EA ,并将您的 Smart Trend 信号转换为自动交易。 Smart Trend Trading System 是一套完整的交易系统,具备不重绘、不回绘、不延迟的特点,专为希望获得更清晰信号、更准确趋势方向以及更有组织交易方式的交易者打造。 Online course , manual and [download presets] . 它将 10 多种交易工具 整合到一个系统中,包括趋势检测、反转区域、Smart Cloud、移动止损逻辑、支撑与阻力、K线着色、提醒以及多周期分析。 该系统旨在帮助您应对不同的市场环境: 趋势市场: 识别主要趋势,发现回调,跟随动能,并通过止损指导和移动止损选项寻找更清晰的入场机会。
TPA True Price Action indicator reveals the true price action of the market makers through 100% non-repainting signals (except early signals mode) strictly at the close of a candle! TPA shows entries and re-entries, every time the bulls are definitely stronger than the bears and vice versa. Not to confuse with red/green candles. The shift of power gets confirmed at the earliest stage and is ONE exit strategy of several. There are available now two free parts of the TPA User Guide for our custom
Quantum Naked SMC Prime is a streamlined Smart Money Concepts indicator designed for traders who prefer a clean chart, structured market analysis and clear visual trade setups without unnecessary complexity. The indicator combines market structure, liquidity behavior, institutional zones and confirmation logic into a compact analytical framework. Instead of flooding the chart with technical indicators, Quantum Naked SMC Prime focuses on the core elements of price action and Smart Money Concepts.
KURAMA GOLD SIGNAL PRO(MT4)— 7层过滤 · 自动止盈止损 · 质量评分 · 信号历史保存 | 完整的XAUUSD交易系统 实时不重绘。信号出现的瞬间,箭头、入场、止盈、止损当场锁定,之后绝不移动。你交易的就是这个实时信号。而且在v7.20中,每一个真正发出的信号都会自动保存,并在重启后精确还原。 购买者专属赠品 购买永久授权,即可免费获得 AI Zone Radar(价值$59)+ 完整PDF手册。在产品价格之外,额外附赠价值$59的赠品。购买后在MQL5上给我留言即可。 AI Zone Radar: https://www.mql5.com/en/market/product/175834 在黄金交易者社区中被实际使用,因精度与易用性而广受好评。 你的难题 —— 以及解决方案 黄金一天波动$30–$50。你知道机会就在那里。但这些情况是否似曾相识: - 入场太早,价格逆行$10后才朝你的方
Quantum Breakout Indicator PRO
Bogdan Ion Puscasu
4.96 (26)
介绍     Quantum Breakout PRO   ,突破性的 MQL5 指标,正在改变您交易突破区域的方式!   Quantum Breakout PRO 由拥有超过 13 年交易经验的经验丰富的交易者团队开发,旨在通过其创新和动态的突破区域策略将您的交易之旅推向新的高度。 量子突破指标将为您提供带有 5 个利润目标区域的突破区域的信号箭头,以及基于突破框的止损建议。 它既适合新手交易者,也适合专业交易者。 量子 EA 通道:       点击这里 MT5版本:   点击这里 重要的!购买后请私信我领取安装手册。 建议: 时间范围:M15 货币对:GBPJPY、EURJPY、USDJPY、NZDUSD、XAUUSD 账户类型:ECN、Raw 或 Razor,点差极低 经纪商时间:GMT +3 经纪商:IC Markets、Pepperstone with Raw 和 Razor 的点差最低 规格: 不重漆! 最多 5 个建议利润目标区域 建议止损水平 可定制的盒子。您可以设置自己的 Box Time Start 和 Box Time End。 接触 如果您
ARTEMIS 子窗口反转系统 是一款功能强大的无重绘外汇指标,旨在通过结合 Smart Money Concepts(智能资金概念)和随机动量分析来识别高概率的反转交易机会。 该指标专为追求精准入场的交易者设计,将流动性扫单检测、市场结构变化以及动量确认整合为一个简洁且专业的交易工具。 为什么这个指标脱颖而出 大多数指标都会给出随机信号,而 ARTEMIS 专注于真实的市场行为: 检测流动性扫单(猎杀止损) 确认市场结构变化(ChoCH) 使用 K/D 交叉进行入场时机判断 提供清晰的买入/卖出箭头 基于无重绘逻辑构建 这意味着更少的虚假信号,以及更高质量的交易机会。 完美买入信号系统(核心优势) 该指标在做多(Buy)方面尤为强大: 步骤 1:空头动能减弱 随机指标 K 和 D 显示动能开始变化。 步骤 2:流动性扫单 价格跌破前低,触发止损猎杀。 步骤 3:结构反转确认 市场向上转变,确认看涨意图。 步骤 4:精准买入箭头 在反转区域出现明确的 Buy 信号。 步骤 5:看涨柱状图确认 动能柱状图转为多头,确认趋势一致。 这一组合为交易者提供高置信度的买入信号。 完美卖出信号系统
Introducing the POWER TRADE Indicator Created by a small group of experienced traders with years of profitable experience in the financial markets, the Power Trade Indicator is a plug-and-play trading tool designed to help traders spot high-quality setups with ease and confidence. What It Does: It provides powerful entry signals, profit-taking zones, and rebound areas — giving you a complete view of where price action is most likely to move next. The indicator reacts in real time, al
Dark Support Resistance  is an Indicator for intraday trading. This Indicator is programmed to identify  Support and Resistance Lines , providing a high level of accuracy and reliability. Key benefits Easily visible lines Only the most important levels will be displayed Automated adjustment for each timeframe and instrument Easy to use even for beginners Never repaints, never backpaints, Not Lag 100% compatible with Expert Advisor development All types of alerts available: Pop-up, Email, Push
Scalper Inside PRO
Alexey Minkov
4.74 (69)
Scalper Inside PRO 帮你分析日内趋势,在入场前就把交易规划好。核心是三套专属策略,让你更精准地读懂市场。信号一出现,指标就自动判断行情方向并计算关键价位,你能提前看到潜在入场点、预期的止损以及多个止盈位。详尽的绩效统计会展示不同品种和策略在历史上的表现,帮你根据当前行情挑选合适的资产。它既可以作为独立的剥头皮工具,也可以融入你的系统,或者作为你自己 EA 的基础。运行于 MetaTrader 4 平台。 指标会直接在图表上标出入场、三个止盈位 - TP1、TP2、TP3 以及一个可选止损。你甚至可以接入自己的箭头指标,检验它们的统计数据和盈利能力。 购买后请直接联系我,即可获得指标的专属附赠 add-ons、更多关于实盘运用的说明,以及把它正确接入你自己交易系统和 EA 的帮助。 指标主要功能 内置三套专属交易策略,可即时切换。 箭头信号出现后即时计算价位:入场以及 TP1、TP2、TP3 多级目标立刻显示,方便你提前规划交易。开启手动或自动计算后,会显示止损位。 三套策略均内置优化模块:自动把参数适配到当前品种和周期,帮你快速筛选资产(仅在实时状态下可用)。 HTF
PZ Trend Trading
PZ TRADING SLU
4.8 (5)
许多盈利交易者不仅知道如何识别市场趋势,而且也能把握趋势建立后的交易机会。 Pz 趋势交易 指标设计用来在趋势行情中尽可能的赚取利润。 已建立的趋势提供了一揽子交易机会,但大多数趋势交易指标完全忽视了它们,让交易者在趋势行情时完全不知道该如何做!一般趋势指标只通知有关的趋势变化,但根本不足以得到卓越的回报. Pz 趋势交易 指标比一般趋势指标显示多达 20 倍的交易 , 因为它注重所谓的市场时机。它不仅显示当前的市场趋势,也有回调,内柱线的突破和调整。它令您在趋势回调之后介入,安全的柱线内突破金字塔加仓,以及发现潜在的反转,和已知的调整。 趋势改变 一个趋势改变在市场方向变化时发生。趋势变化在图表上用带数字的彩色圆圈显示。蓝色 (1) 信号为上涨开始, 而红色 (1) 信号为下跌开始。趋势变化并非评估当前价格动作的结果, 它意味着交易设置是不定时地。如果您正确使用本指标, 在趋势变化时, 您将将已经入场 (参看下面的调整)。 回调 但凡趋势在运动中,行情上下抖动,盈利者收割利润,且其它参与者入场。趋势回调代表好的买入机会,通常是由主力获利离场导致。如果行情在回调后回归上行, 指标将
This is a professional chart indicator designed for traders focused on stability and clear price action. It helps filter market noise and provides clear visual entry and exit zones for your trading decisions. Core Features: Strictly Non-Repainting: The system is built with strict non-repaint logic. What you see on the chart is the true historical performance. Confirmed Signals: Signals are triggered and confirmed only after the candle closes . Once a trading arrow appears on a closed candle, it
Introduction This indicator detects volume spread patterns for buy and sell opportunity. The patterns include demand and supply patterns. You might use each pattern for trading. However, these patterns are best used to detect the demand zone (=accumulation area) and supply zone (=distribution area). Demand pattern indicates generally potential buying opportunity. Supply pattern indicates generally potential selling opportunity. These are the underlying patterns rather than direct price action. T
目前八折优惠! 对任何新手或专家交易者来说都是最好的解决方案! 这个仪表板软件适用于28种货币对。它基于我们的两个主要指标(高级货币强度28和高级货币冲动)。它对整个外汇市场提供了一个伟大的概述。它显示高级货币强度值,货币运动速度和28个外汇对在所有(9)时间段的信号。想象一下,当你可以使用图表上的单一指标观察整个市场,以确定趋势和或剥头皮的机会时,你的交易将得到改善 我们已经在这个指标中建立了一些功能,使你更容易识别强势和弱势货币,同时识别和确认潜在的交易。该指标以图形方式显示货币的强势或弱势是增加还是减少,以及它在所有时间段的表现。 增加的新功能是动态市场斐波那契水平,它适应当前的市场条件变化,这是一个已经在我们的高级货币强度28和高级货币冲动指标中使用的成熟的加分项。 在交易时,总是将弱势货币和强势货币配对,这个新指标将帮助你做到这一点。 用户手册:点击这里  https://www.mql5.com/en/blogs/post/708783 特点  显示每个时间段的ACS28和GAP-speed(冲动)的货币强度值。 列:颜色代码以7种颜色显示货币强度:强势
RFI levels PRO
Roman Podpora
5 (1)
RFI LEVELS PRO 可识别反转结构以及关键的价格回归区域,这些区域可能出现大型市场参与者的活跃行为。 指标可以帮助您识别新趋势的形成、寻找潜在入场点,并提前控制风险和利润目标。 MT5 版本   —   与 TREND LINES PRO 配合使用时,可充分发挥指标的功能。 指标显示内容: 在新趋势开始阶段激活的反转结构和反转水平。 沿已识别趋势方向的潜在入场点。 可视化的 TAKE PROFIT 和 STOP LOSS 水平。 基础最低风险收益比为 RR 1:2 。 随着行情发展,Stop Loss 可根据智能逻辑进行动态调整。 趋势分析 RFI LEVELS PRO 可以根据以下两个指标的数据生成反转结构: TREND LINES PRO — 用于识别全局趋势反转。 TREND PRO — 用于识别更快速的趋势反转。 SCANNER 扫描器 内置扫描器实时运行,可帮助快速发现当前活跃的交易机会。 多时间周期品种过滤。 搜索当前激活的反转结构。 显示 LOGIC AI 信号触发后的结果。 显示当日信号已产生盈利的交易品种列表 — RB 按钮。 支持交易终端提醒。 支持向移动
Liquidity Heatmap Mt4
Israr Hussain Shah
Here   our MT5 version more valuable tools SMC Trend Trading   ,  Easy SMC Trading  ,  Institutional SMC Architect Volume Analysis Tools  ,  Volume flow Profile  ,  Market volume profile  , FVG with Volume  , Liquidity Heatmap Profile  ,  Volume Spread Analysis 2. Key Features Dynamic Filtering : The core feature. As soon as the current price crosses a historical liquidity level, that level disappears. This reduces chart clutter and prevents you from trading off "dead" support/resistance. Liqui
Trend Lines PRO
Roman Podpora
5 (1)
TREND LINES PRO 帮助您了解市场真正的方向转变点。该指标显示真实的趋势反转点以及主要参与者重新入场的时机。 您可以看到 BOS线、 趋势变化和更高时间框架的关键水平——无需复杂的设置或不必要的干扰。信号不会重绘,并在K线收盘后仍然保留在图表上。 VERSION MT 5    -   与……搭配使用时,可发挥其最大潜力   RFI LEVELS PRO 指示器 该指标显示的内容: 实际变化 趋势(BOS 线) 一旦信号出现,它就始终有效!这与会重绘的指标有着重要的区别,后者可能会发出信号后又改变信号,从而导致资金损失。现在,您可以更精准、更准确地进入市场。此外,还有一个功能,会在箭头出现后为K线着色,直到达到目标价位(止盈)或出现反转信号为止。 重复条目   以及主要玩家的充值 为了提高寻找入场点时的视觉清晰度,我们创建了一个模块,该模块首先显示买入/卖出区域,并在该区域内寻找最佳入场点。此外,我们还加入了智能逻辑来管理止损位,该逻辑会随着时间的推移逐步降低止损位的大小,从而降低入场交易时的初始风险(移动止损位)。 信号强度水平(BOS) 该指标采用三个显著性等级来衡量
Currency Strength Exotics
Bernhard Schweigert
4.88 (33)
目前8折优惠! 对任何新手或专家交易者来说都是最好的解决方案! 这个指标是专门用来显示任何符号的货币强度,如异国货币对、商品、指数或期货。它是同类产品中的第一个,任何符号都可以添加到第9行,以显示黄金、白银、石油、DAX、US30、MXN、TRY、CNH等的真实货币强度。这是一个独特的、高质量的、负担得起的交易工具,因为我们已经纳入了一些专有的功能和一个新的公式。想象一下,你的交易将如何改善,因为你能够准确地确定新趋势或剥头皮机会的触发点? 用户手册:点击这里   https://www.mql5.com/en/blogs/post/708876 它适用于所有时间框架。你将很快能够看到TREND! 根据新的基础算法设计,它使识别和确认潜在交易变得更加容易。这是因为它以图形方式显示了8种主要货币和一种符号的强弱。 该指标显示了8种主要货币(澳元加元瑞士法郎欧元英镑日元新西兰美元)的强弱线,再加上一个符号! 该指标显示了符号的真实价值。例如:对于XAUUSD(黄金):价格以美元报价。如果黄金在上涨,你怎么能知道是黄金的强势还是美元的弱势?只有当黄金走强时,我们才会进行交易。该指
Atomic Analyst
Issam Kassas
5 (13)
本产品已针对 2026 年市场进行更新,并针对最新 MT5 版本进行了优化。 价格更新通知: Atomic Analyst 目前价格为 $99 。 接下来的 30 次购买 后,价格将上涨至 $199 。 特别优惠: 购买 Atomic Analyst 后,请发送私信给我,即可免费领取 Smart Universal EA ,并将您的 Atomic Analyst 信号转换为自动交易。 Atomic Analyst 是一款不重绘、不回绘、不延迟的 Price Action 交易指标,专为手动交易、清晰信号和 EA 自动化而设计。 User manual: settings, inputs and strategy.      &   User Manual PDF . 它分析价格行为、强度、动能、多周期方向和高级过滤器,帮助交易者减少噪音,避免弱势交易机会,并做出更有结构的交易决策。 该指标将复杂的市场计算转换为简单的视觉信号、彩色K线、趋势读数、止损水平和多个止盈区域,使交易者能够快速理解并应用于真实市场环境。 主要交易用途: 剥头皮和日内交易: 专为快速决策、清晰箭头、提醒、K线
PipFinite Breakout EDGE
Karlo Wilson Vendiola
4.93 (488)
The Missing Edge You Need To Catch Breakouts Like A Pro. Follow a step-by-step system that detects the most powerful breakouts! Discover market patterns that generate massive rewards based on a proven and tested strategy. Unlock Your Serious Edge Important information here www.mql5.com/en/blogs/post/723208 The Reliable Expert Advisor Version Automate Breakout EDGE signals using "EA Breakout EDGE" Click Here Have access to the game changing strategy that will take your trading to the next l
Neo Wave PRO
Nikolay Raykov
5 (1)
Price & Time Market Structure Indicator A professional market structure tool that analyzes waves through both price and time — not price alone. Main Description NeoWave PRO is a professional market structure indicator for MetaTrader 4 designed for traders who want to move beyond traditional one-dimensional wave tools such as ZigZag, swing indicators, and basic high/low systems. Most wave indicators analyze only one thing: Price. But a real market wave is not only a price movement. A true wave de
作者的更多信息
ChangingTrends
Evgeniy Zhdan
該指標計算最可能的趨勢止損/逆轉區域,有信心的趨勢運動區域。 計算考慮: 價格變動率; 圖表的相對偏差角度; 價格變動的平均幅度; 價格離開“舒適區”; ATR 指標的值。 當價格進入止損/反轉區域時,該指標可以生成警報。 設置 Draw the entire length? - 繪製直到圖表末尾的區域; Show Stop UP-trend - 顯示上升趨勢的停止/反轉區域; Show UP-trend - 顯示上升趨勢的區域; Show DOWN-trend - 顯示有信心的下降趨勢區域; Show Stop DOWN-trend - 顯示下降趨勢的停止/反轉區域; Alert in the area change - 當價格進入趨勢止損/變化區域時生成警報; 接下來是每個交易區域的顏色設置。
Buy and sell zones
Evgeniy Zhdan
5 (2)
用於確定平面和趨勢的指標。 如果價格低於兩條直方圖和兩條線(紅色和藍色)中的任何一條,則這是一個賣出區域。 購買此版本的指標時,一個真實賬戶和一個模擬賬戶的 MT4 版本 - 作為禮物(收到,給我寫私信)! 如果價格高於兩條直方圖和兩條線(紅色和藍色)中的任何一條,則這是一個買入區域。 MT4 版本: https://www.mql5.com/en/market/product/3793 如果價格在兩條線之間或在任何直方圖的區域內,那麼市場就沒有明確的趨勢。簡單地說,市場是平的。 指標的工作在屏幕截圖中更清楚地顯示。 該指標可用作獨立的交易系統。該指標可用於獲取領先數據或確定當前趨勢的方向。對於任何級別的交易者來說,這都是一個很好的工具!
SuperTrend
Evgeniy Zhdan
2.5 (2)
The Supertrend Expert Advisor The Supertrend Expert Advisor with averaging elements. It has been developed during three months until I finally got good results. It is not a scalper. The minimum balance to start trading - 100 $. Is automatically adjusted to the 4 and 5-digit prices. Has an efficient risk management system. The lot and limit on the maximum lot is automatically calculated based on the settings specified in the EA. As a result, you have a complete automated trading system. Download
Stardust
Evgeniy Zhdan
StarDust searches for divergences in the values of several indicators considering them as signs of flat and enters the market if a relatively steady trend is detected. The Expert Advisor trades "basic" symbols with a low spread. The best results are achieved on М15. The EA automatically adjusts to 4 and 5-digit quote flows. Settings Comment_to_orders – comment to a placed order. The field can be left blank if no comment is required. MM – enable money management with automatic setting of a worki
Top Floor
Evgeniy Zhdan
The EA catches the price when it moves against the trend in an effort to open an order in an opposite direction (direction of the main trend). Screenshots illustrate examples of entries and the strategy gist. The EA uses stop losses depending on values of ATR. Settings: Lot_ - if Risk_ = 0, the EA will trade this lot; Risk_ - risk per one trade. Stop loss is taken into account; koeff_ATR - coefficient multiplied by the ATR value to calculate stop loss (the bigger the value, the bigger stop loss
FastBoom
Evgeniy Zhdan
The FastBoom EA finds the most probable points of price pullback/reverse and places an order. It places averaging orders if the price moves further against take profit. Settings of the EA: Lots - initial lot; LotExponent - multiplier for following orders (Martingale). 1 - no multiplier. TakeProfit - take profit in points; Stochastic Settings InpKPeriod - K Period of Stochastic InpDPeriod - D Period of Stochastic InpSlowing - Stochastic Slowing LevHigh - level for sell positions of Stochastic L
The Expert Advisor calculates the double/triple divergence of volumes, and starts trading. It uses a unique formula of lot calculation, which greatly improves stability of trading. Recommended TF - 1h. Currency pair - EURUSD , but the EA can be used on any trading instruments which are not subject to high volatility. Settings mode - trading direction can be set manually; close - order close level (details on the screenshot); Step between orders - step between orders in points; Maximum orders -
OrderOnLine
Evgeniy Zhdan
The Expert Advisor opens orders from the horizontal line, the a trader can set on any level by dragging using the mouse or by changing the line properties. For example, when a horizontal line is above the current price, the EA will open a Buy order once the horizontal line is reached. And vice versa: If the line is below the current price, the EA will open a sell order once the line is crossed. A buy crossover of the line is: opening of the current candlestick below the horizontal line; the curr
SellerATR
Evgeniy Zhdan
5 (1)
The Expert Advisor only sells. Recommended currency pairs : EURUSD; GBPUSD; USDCHF; USDJPY; USDCAD; AUDUSD; EURGBP; EURAUD; EURCHF; EURJPY; GBPCHF; CADJPY; GBPJPY; AUDNZD; AUDCAD; AUDCHF; AUDJPY; CHFJPY; EURNZD; EURCAD; CADCHF; NZDJPY; NZDUSD. Timeframe: H1. Percent% manages closing both loss-making and profitable deals based on the account overall status. Using the EA on 23 symbols mentioned above allows the robot to cope with the drawdown in case of a long trend. While positions on some pairs
Illusion
Evgeniy Zhdan
3 (2)
The Illusion EA uses the probability theory - after a series of consecutive virtual losses - i.e. right during a flat the EA already starts trading in the trend. In addition, the EA considers the ratio of bullish/bearish candles on the higher timeframes to determine the greatest probability of the price movement direction. Only 1 order can be opened at a time. In case of a loss the following order will be placed with an increased lot (the multiplication coefficient is set in the parameters). The
GoldenCoast
Evgeniy Zhdan
The indicator plots a trend line and determines the levels for opening trades, in case the price goes "too far" away from the trend level. More detailed information is available in the screenshots. Settings Away from the trend line - distance from the trend line to the trades level; Arrow Signal for deals - enable displaying an arrow when the price reaches the trades level; Size of Arrow - size of the arrow; Alert Signal for deals - enable generating alerts when the price reaches the trades lev
Turbina
Evgeniy Zhdan
5 (4)
The axiom of the Forex market is that any trend will be broken. The Expert Advisor determines trend direction (the pink line), and calculates levels for opening opposite orders depending on the settings. The value of Away from the trend line for Deal will be different for each pair and timeframe, depending on the volatility of the trading instrument. Next orders can be opened with an increased lot (a static lot is used by default). See the screenshots to understand the idea of the Expert Advisor
Odysseus
Evgeniy Zhdan
The Expert Advisor determines the moments of strong movements and opens a position in the direction of the most probable price movement. The strategy always uses stop loss and take profit. Several independent orders can be in the market (the maximum number is set in parameters). The goal of the EA's underlying trading system is the quantitative excess of the number of profitable deals over the number of losing ones. Recommended: EURUSD 5m; GBPUSD 5m; USDJPY 5m. The Expert Advisor is able to work
Vise
Evgeniy Zhdan
Vise is a trend indicator. The upper and lower lines follow the price showing the prevailing price direction. Frequent breakthroughs of the upper line indicate a bullish trend, while frequent breakthroughs of the lower line indicate a bearish one. Parameters Points for UpLine - initial number of points for the upper line; Points for DownLine - initial number of points for the lower line. During the breakthrough of the upper level (line), this level shifts upwards by Points for UpLine. If the up
Twinkle
Evgeniy Zhdan
Twinkle is a trend-based scalper using stop loss and take profit invisible to the broker. The EA does not look for trend reversals. The EA catches strong market movements and opens orders in the direction of the trend. Your broker will not see the order closing levels. The EA closes orders independently when reaching the take profit or stop loss levels specified in the settings. Recommended trading symbols: EURUSD M5, GBPUSD M5. ECN accounts with 5 digits quotes are recommended. Expert Advisor
Shine
Evgeniy Zhdan
4.75 (4)
This Expert Advisor implements elements of the Martingale system. Orders are opened at a specified distance from the moving average. The Parabolic SAR indicator and certain technical details are used to ensure the most accurate entries. The EA is highly customizable. It is recommended for simultaneous use on 4 currency pairs: EURUSD M15; GBPUSD M15; USDJPY M15; USDCAD M15. Despite good stability, it is advisable to disable the EA operation during the days rich in news releases. Configurations P
LuckyCase
Evgeniy Zhdan
LuckyCase is an Expert Advisor with martingale elements. The EA strategy is based on a significant "deviation" of the price from SAR inadicator and the Bands levels breakthrough point. The money management system is an essential part of the EA. It starts working after a trade is opened. Trades are closed after accumulating specified points of market orders, by deposit % or after an opposite side of the channel is broken through. The default EA settings are meant for: EURUSD M15; USDJPY M15. The
Elize
Evgeniy Zhdan
The Elize Expert Advisor has been designed to work with the EURCHF currency pair. It considers the peculiarities of this trading instrument, its behavior and dependence on the behavior of other currencies. In particular, when the currencies of the European countries (EURUSD, GBPUSD, EURNOK, EURCHF) move in the same direction, the EA starts its operation and opens a deal in the trend direction of the European currencies. In the event of price rollbacks, the EA uses a unique method for making the
AllTrendLines
Evgeniy Zhdan
4 (1)
Brief Description of the All Trend Lines Indicator The indicator analyzes the wave structure of the market. What it displays on the chart: First. Wave pivots (semaphores) • Red markers – wave highs • Yellow markers – wave lows • Yellow-green markers – additional local extremes Second. Trend lines • Purple/blue lines – trends based on highs (resistance/support) • Beige/green lines – trends based on lows • Lines are built automatically by connecting wave pivots of the same type Third. Main trend
FastTraffic
Evgeniy Zhdan
The Expert Advisor has been specifically developed for trading gold (Spot Gold). The strategy is based on Fibo levels calculated from the previous (first) candle High/Low and the width of the current and lower timeframes channel. If important Fibo levels of different orders are located in a single price channel (within a spread), the EA defines this channel as the target for price movement and starts operation. Martingale and averaging are not used. Each order is independent and is accompanied b
Jazz
Evgeniy Zhdan
The algorithm of this Expert Advisor determines the significant price levels, where the trend often turns into a flat or reverses. Stochastic Oscillator serves as an additional filter of overbought/oversold zones. The EA sets stop loss and take profit after opening an order. The underlying trailing strategy applies a trailing stop. The EA is recommended for simultaneously use on three trading instruments: EURUSD M5, GBPUSD M5, EURCHF M5. Settings: Comment to order - comment to orders. MaxRisk -
Panther
Evgeniy Zhdan
The Expert Advisor looks for technical analysis patterns formed on the higher (hourly) timeframe to start working on the 5-minute chart. Technical analysis patterns used: double top/double bottom, head/shoulders, flag, expanding/narrowing triangles. The Relative Vigor Index technical indicator is used as the filter for opening deals. It is based on the idea that on the bull market the closing price is, as a rule, higher, than the opening price. It is the other way round on the bear market. This
Spook
Evgeniy Zhdan
The Expert Advisor calculates the divergence on the current and higher timeframes. In case the divergences coincide, the EA starts its operation. Deals have strict take profit and stop loss levels. Each deal is managed by trailing stop. The strategy involves the use of a tight stop-loss. Therefore, losing deals and/or series of losing deals are not uncommon. This EA is not suitable for those who have difficulties coping with losing deals. The EA is recommended for simultaneous use on the followi
Grand
Evgeniy Zhdan
The Expert Advisor has been developed specifically for the features of the CHFJPY currency pair. The EA's algorithm determines the direction of the current trend and starts operation. In case of a price reversal within the current trend, the EA adds additional orders. If trend changes, the EA starts to work in the direction contrary to the initial grid of orders. If there were no conditions for closing orders and the trend direction changed again, the EA continues to work with the "first" grid o
Intensive
Evgeniy Zhdan
The Expert Advisor algorithm determines on daily charts those candlestick patterns, which set the intraday trading direction. The trading EA determines how long the price is moving in overbought/oversold zones and starts working in the direction of the expected trend movement. Each position is accompanied with a tight stop loss and take profit. Only one active position can be open in the market. The EA was developed and tested using 99% quality quotes. The Expert Advisor has a built-in news filt
Slender
Evgeniy Zhdan
The strategy of this Expert Advisor is based on a hedging system, which implies placing opposite orders. The EA algorithm determines trend beginning and opens a position in the trend direction. In case of a wrong entry, the EA tries to neutralize the drawdown through opposite (hedging) orders at a preset interval (Coefficient of counter orders). Orders are closed when one of the two values ​​is reached - profit in percent or profit in points. The EA does not use lot increase. The EA wast tested
Dreamer
Evgeniy Zhdan
Советник работает по принципу хеджирования с периодическими "перекосами" в сторону трендовых направлений. Направления тренда советник определяет на основании стандартного индикатора Parabolic Stop and Reverse system (SAR). Уникальная стратегия установки балансирующих позиций позволяет избегать больших просадок даже при самых не благоприятных рыночных условиях. Параметры по умолчанию рекомендуется использовать на торговом инструменте: GBPJPY 15m. Разработка и оптимизация параметров производились
Snoot
Evgeniy Zhdan
5 (1)
This Expert Advisor works using a grid in the direction of a trend movement with the step between opened positions defined in the settings. The positions are closed by the total take profit. The Parabolic SAR standard indicator is used to filter order opening, which comes in the MetaTrader 4 package. The EA has been developed and tested using 99,9% quality of quotes. Operation of the EA in real time can be viewed in the signals . The best trading results have been achieved on CHFJPY M15. Settin
Solipsism
Evgeniy Zhdan
The Expert Advisor builds channels based on the data obtained using ATR and MA indicators according to the equations: Upper channel border = MA + ATR * (FIBO); Lower channel border = MA - ATR * (FIBO), where FIBO has the following values: Style of Trade - Aggressive = 1.61852; Style of Trade - Average = 3.26704; Style of Trade - Calm = 4.85556. Trades are opened inside the channel with the intervals defined in the settings. Long and short positions are opened independently. Positions are closed
The trading statistics indicator notifies the trader of the aggregate income of the trading account for different time intervals. The indicator has wide display settings on the graph. There is a choice of one of the two display languages on the chart- English and Russian. Settings Indicator language (ENG, RUS) - Select the language to display on the chart; To control the magic (-1: any magic) - Entering the Magic for control (-1: any Magic); Angle of indicator tie - Selecting the angle of the c
筛选:
无评论
回复评论