适用于MetaTrader 4的新技术指标 - 4

The Gold Ripper Oscillator is a specialized momentum-pressure gauge designed for XAUUSD. It visualizes the real-time tug-of-war between bullish gold strength (“GoldRush”) and opposing USD pressure (“USDCrush”). The indicator displays two color-coded histogram streams that expand or contract based on shifting market drive. When the gold side dominates, golden bars rise above the baseline, reflecting strong upward energy. When USD-driven weakness takes control, crimson bars form below the baseline

Commodity Channel Index. Не рисующий индикатор для отображения старшего таймфрейма (далее ТФ) на текущем графике. Возможно использовать на текущем ТФ. Несколько вариантов расчета по различным ценам и используемым мувингам. Параметры: TimeFrame - должен быть больше равен текущему. Period - должен быть больше 1. Price Type - варианты: Close, High, Low, Median, Typical, Weighted, Average, Body, Median, Trend Biased. MA Metod - метод вычисления на основе МА: SMA, EMA, SMMA, LWMA, LSMA, WEMA. Sm

Super IA Channel Creator PRO Intelligent Adaptive Channels & Smart Trade Context Super IA Channel Creator PRO is an advanced market-structure and decision-support indicator for MetaTrader 4 , designed to help traders clearly identify high-probability trading zones , context strength , and price reaction behavior in real time. This is not a repainting tool and not a simple channel indicator.
It is a complete decision framework built around adaptive price channels, smart scoring, and visual confir

SUPER IA SNIPER – VOLUME PRO (MT4) Super IA Sniper – Volume PRO is an advanced volume and price-behavior analysis indicator , designed to identify high-probability short-term reversal conditions based on qualified volume events , using closed candles only (NO REPAINT) . It was built for traders who demand precision, transparency, and real statistical validation , eliminating random signals and purely subjective market interpretations. WHAT THE INDICATOR ANALYZES The indicator continuously

Hello friends. I am very proud to introduce you to this new indicator that I have been working on for a while. Drag the indicator to the xauusd chart on the 1-minute time frame and enjoy. The indicator will tell you when a buy or sell signal occurs. You can place your stop loss order at the end of the buy or sell arrows. Please be careful, keep your account management and transaction amount at a level that will not make you sad about possible loss of money. Good trading.

Gold Pattern Scanner Pro Gold Pattern Scanner Pro automatically detects trend channels and rising/falling wedges directly on your chart, using an Autochartist-style approach. It draws clean upper/lower trendlines, calculates the current price position inside the pattern , and sends smart alerts (including push notifications) when price touches the channel boundaries. Designed especially for GOLD (XAUUSD).
It can be applied to other symbols such as forex pairs, indices, or crypto. Main Features

**Zonar** is a professional-grade trading assistant designed to automate the **Opening Range Breakout (ORB)** strategy. Unlike standard indicators, Zonar uses a "Smart-Align" engine that automatically detects the true market open for **Any Instrument** (Gold, US30, NASDAQ, Forex, or Stocks) without manual timezone adjustments. It combines volatility analysis (ATR), Smart Money Concepts (FVG/OB), and Daily Sentiment levels to provide a complete, data-driven trading system on a clean chart. ### **
Squeeze Momentum Alert (挤压动能指标) 1. 识别价格“爆发”点 (The "Squeeze") 该指标最大的优势在于能够捕捉市场在大幅波动前“盘整”或“积蓄能量”的时机。 优点: 市场总是在平静(盘整)和剧烈波动(爆发)之间交替。该工具会告诉你: “现在图表正在剧烈挤压,准备好迎接下一次大行情” ,让你不会错过大趋势的起点。 2. 详细区分趋势“强度” (Color Coded Momentum) 柱状图不仅告诉你价格涨跌,还使用 4 种颜色 来指示趋势的健康状况: 亮绿色 (Lime): 强劲上涨(适合追涨)。 深绿色 (Dark Green): 上涨疲软(警示:动能减弱,准备锁定利润)。 鲜红色 (Red): 强劲下跌(抛压重)。 暗红色 (Maroon): 下跌疲软(卖盘动能耗尽)。 优点: 帮助你在趋势强劲时知晓**“入场” 时机,并在颜色改变(动能减弱)时立即 “离场”**,快于价格反转。 3. 过滤震荡市场的假信号 (Noise Filtering) 在无趋势或窄幅震荡期间,该工具会显示 "Compression" (挤压) 状态。 优点: 防止你

Market Time Watch 一款轻量、简洁且对每位交易者都至关重要的时间显示工具 Market Time Watch 是一款专业的图表时间显示工具,为需要精确本地时间、服务器时间和当前 K 线倒计时的交易者设计。 该工具可以在图表上直接显示 本地时间 、 服务器时间 和 K线倒计时 , 无需复杂界面或多余元素。 无论您是剥头皮交易、波段交易、新闻交易,或只是需要一个简洁清晰的时间参考, Market Time Watch 都能以最简约、最优雅的方式呈现所有关键信息。 为什么交易者喜欢 Market Time Watch 超轻量级 ,适用于所有 MT4/MT5 环境 不重绘图表 ,不干扰 EA 或指标 零延迟 、零负载、几乎不占用 CPU 完美适配剥头皮、日内交易、消息面交易以及指数 (US30, NAS100, Gold, Forex) 专业视觉设计,适用于任何图表主题 主要功能 实时时钟 在图表上清晰显示当前时间(本地或服务器)。 K 线倒计时 显示当前 K 线剩余时间,特别适合剥头皮和新闻交易者。 现代信息面板 精美弹出面板包含: 所有 TesterM
FREE

自动化艾略特波浪理论 (Automated Elliott Wave) 1. 自动数浪并减少主观偏见 (客观性) 通常,艾略特波浪的计数往往带有很强的“主观想象”或个人观点。该指标通过以下方式提供帮助: 寻找推动浪 (Impulse Wave 1-2-3-4-5): 使用严格的规则(例如:第3浪不能是最短的,第4浪不能与第1浪重叠),为您展示理论上正确的价格结构。 寻找调整浪 (Corrective Wave A-B-C): 帮助捕捉价格回调的时机,以便顺势再次入场。 2. 多层次分析 (Multi-Degree Analysis) 该指标不仅仅关注单一时间框架,而是同时分析3个深度的波浪级别,提供3D市场视图: 微浪 (Minor): 用于观察快速波动。 中浪 (Intermediate): 用于观察主要趋势。 主浪 (Primary): 用于观察市场大局。 优点: 您可以根据自己的交易风格开启或关闭每个级别的显示。 3. 寻找价格目标和入场点 (Targeting & Entry) 当系统发现完整的波浪时,它不仅会标记波浪,还会帮助制定交易计划: 斐波那契预测 (Fibonacci
Volume Profile Pro 指标 该指标是 Volume Profile Pro 工具,用于分析“在哪个价格水平交易最活跃”。它具有以下增强功能: 显示模式 (Display Modes) Volume Profile (标准): 显示每个价格区间的总交易量 (Total Volume),以识别关键的支撑和阻力区域。 Delta / Money Flow: 显示买卖压力 (Buy vs Sell) 之间的“差值”,以判断谁在该价格控制市场。可选择显示成交量或资金流 (Money Flow)。 计算模式 (Calculation Modes) Pro 版本的一大亮点是选择时间范围的灵活性: Fixed Mode (固定模式): 设置固定的回溯蜡烛数量(例如最近 100 根)。 Dynamic Mode (动态模式 - 特色功能): 图表上会出现一条垂直线。您可以用鼠标将其 拖动 到图表上的任何位置,指标将立即计算从该点到现在的分布图。这使得分析特定的波段或趋势变得非常容易。 关键水平 (Key Levels) POC (Point of Control - 控制点): 延伸的红
产品标题 Smart ZigZag Pro (MT4) – SmartView 系列的一部分 简短描述 ZigZag 指标的专业版,配备图表智能控制面板、高级分析工具、动态支撑/阻力位、自动交易信号、模式识别、波动统计以及所有元素的全面自定义功能。免费版与 Pro 版共享 SmartView 面板功能。 概述 Smart ZigZag Pro 是 Smart ZigZag 指标的专业版,为需要更深入市场洞察的严肃交易者提供高级分析工具和增强的可视化功能。该指标包含嵌入图表的智能控制面板,显示当前值和关键信息,配备 20 个数据缓冲区,为高级分析和专家顾问集成提供全面的数据。 主要功能 图表上的智能控制面板(免费版也提供)。 高级支撑/阻力位 – 显示已确认的水平和可突破的水平。 通道分析 – 显示 ZigZag 通道的上轨和下轨。 自动交易信号 – 在关键突破点显示买入/卖出箭头。 自动模式识别 – 检测连续的高/低模式。 波动统计 – 点数、柱数和百分比测量。 增强的文本信息 – 灵活的价格和百分比显示。 全面自定义 – 每个元素的独立自定义。 数据窗口集成 – 20 个数据缓冲区用
产品标题 Smart ZigZag (MT4) – SmartView 系列的一部分
See also >> Smart ZigZag Pro
简短描述 面向 MT4 的新一代 ZigZag 指标,内置图表智能控制面板,支持一键显示/隐藏、动态缓冲区数值悬停显示以及现代化参数窗口。具备 Dual‑color ZigZag 功能,解决了单线颜色限制;可与其他 Smart Indicators 系列指标无缝协同工作。 概述 Smart ZigZag 专注于用户体验:在图表左上角提供紧凑控制面板,直观展示关键参数,双击即可打开原生参数窗口,一键隐藏/显示或删除当前实例,并可在面板中直接查看实时与历史数值。 主要功能 图表内 Smart 控制面板,在图表上直接查看和管理关键参数。 Dual‑color ZigZag 功能,解决 MetaTrader 中单线颜色限制的问题。 双击快速打开设置窗口,一键隐藏/显示或删除当前实例。 适合多个 Smart 指标同时运行的清晰布局,自适应深浅色背景,并在悬停 K 线时于面板中显示缓冲区数值,配合简洁提示说明。 输入参数 标准 ZigZag 参数(
FREE

产品标题 Smart Bollinger Bands (MT4) – SmartView 系列的一部分 简短描述 面向 MT4 的新一代布林带指标,内置图表智能控制面板,支持一键显示/隐藏、动态缓冲区数值悬停显示以及现代化参数窗口,可与其他 Smart Indicators 系列指标无缝协同工作。 概述 Smart Bollinger Bands 专注于用户体验:在图表左上角提供紧凑控制面板,直观展示关键参数,双击即可打开原生参数窗口,一键隐藏/显示或删除当前实例,并可在面板中直接查看实时与历史数值。 主要功能 图表内 Smart 控制面板,在图表上直接查看和管理关键参数。 双击快速打开设置窗口,一键隐藏/显示或删除当前实例。 适合多个 Smart 指标同时运行的清晰布局,自适应深浅色背景,并在悬停 K 线时于面板中显示缓冲区数值,配合简洁提示说明。 输入参数 标准布林带参数(周期、偏差、价格类型)并扩展了可视化控制(颜色、突破 MT 传统上限的线宽、线型选择),集中在整洁的主选项卡中便于编辑。 适用场景 适合在同一图表上运行多种 Smart 指标、追求干净工作区域与快速设置入口的交易
FREE

产品标题 Smart Parabolic SAR (MT4) – SmartView 系列的一部分 简短描述 面向 MT4 的新一代抛物线 SAR 指标,内置图表智能控制面板,支持一键显示/隐藏、动态缓冲区数值悬停显示以及现代化参数窗口,可与其他 Smart Indicators 系列指标无缝协同工作。 概述 Smart Parabolic SAR 专注于用户体验:在图表左上角提供紧凑控制面板,直观展示关键参数,双击即可打开原生参数窗口,一键隐藏/显示或删除当前实例,并可在面板中直接查看实时与历史数值。 主要功能 图表内 Smart 控制面板,在图表上直接查看和管理关键参数。 双击快速打开设置窗口,一键隐藏/显示或删除当前实例。 适合多个 Smart 指标同时运行的清晰布局,自适应深浅色背景,并在悬停 K 线时于面板中显示缓冲区数值,配合简洁提示说明。 输入参数 标准抛物线 SAR 参数(步进、最大值、价格类型)并扩展了可视化控制(颜色、突破 MT 传统上限的线宽、线型选择),集中在整洁的主选项卡中便于编辑。 适用场景 适合在同一图表上运行多种 Smart 指标、追求干净工作区域与快速
FREE
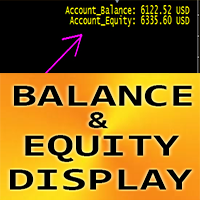
这是免费产品,欢迎您使用!
也非常感谢您的积极反馈!非常感谢!
// 优秀的交易机器人和指标可在此处获取: https://www.mql5.com/en/users/def1380/seller ................................................................................................................. Crypto_Forex 指标“余额和净值显示”适用于 MT4,是一款出色的辅助交易工具。
- 该指标显示账户当前余额和净值。 - 可在图表任意位置显示数值: 0 - 左上角,1 - 右上角,2 - 左下角,3 - 右下角 - 还可设置颜色和字体大小。
这是仅在本 MQL5 网站上提供的原创产品。
FREE
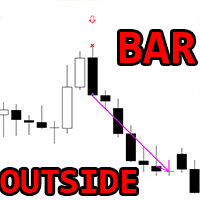
Crypto_Forex MT4 OUTSIDE 柱状图指标,无需重绘,无延迟。
- “OUTSIDE 柱状图”指标是一款非常强大的价格行为交易指标。 - 指标可检测图表上的 OUTSIDE 柱状图: - 看涨 OUTSIDE 柱状图 - 图表上显示蓝色箭头信号(见图)。 - 看跌 OUTSIDE 柱状图 - 图表上显示红色箭头信号(见图)。 - 提供 PC、手机和电子邮件提醒。 - “OUTSIDE 柱状图”指标非常适合与支撑/阻力位结合使用。 ................................................................................................................. // 优秀的交易机器人和指标可在此处获取: https://www.mql5.com/en/users/def1380/seller 这是一款仅在 MQL5 网站上提供的原创产品。
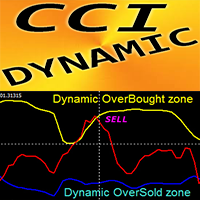
Crypto_Forex 指标“CCI 带动态超卖/超买区域”,适用于 MT4,无需重绘。
- 商品通道指数 (CCI) 非常适合顺势交易,顺势而为。 - 非常适合在动态超买区域设置卖出入场点,并在动态超卖区域设置买入入场点,顺势而为。 - 此指标也非常适合与价格行动入场点结合使用。 - 动态超买区域 - 黄线上方。 - 动态超卖区域 - 蓝线下方。 - CCI 震荡指标用于测量当前价格与历史平均价格之间的差额。 - 提供 PC 和移动端提醒。 ................................................................................................................. // 优秀的交易机器人和指标可在此处获取: https://www.mql5.com/en/users/def1380/seller 本产品为原创产品,仅在 MQL5 网站上提供。
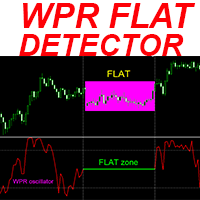
Crypto_Forex 指标“WPR 平缓探测器”是一款高效的交易辅助工具!无需重绘。 我推荐您使用这款适用于 MT4 的出色指标来升级您的交易方法。
- 指标在图表上显示价格平缓区域。它具有“平缓敏感度”参数,用于平缓检测。 - “WPR 平缓探测器”可用于价格行动入场确认,或与其他指标结合使用。 - 您可以将其用于趋势跟踪系统,以检测平缓区域并避免在该区域交易。 - 您可以将其用于反转剥头皮交易 - 从平缓区域进行反转交易。 - 有很多机会可以使用“WPR 平缓探测器”替代标准 WPR 振荡器。 - WPR 本身是快速剥头皮交易的最佳振荡器之一。 - 非常适合在超买区域(高于 -20)进行卖出入场,在超卖区域(低于 -80)进行买入入场。
// 优秀的交易机器人和指标可在此处获取: https://www.mql5.com/en/users/def1380/seller 这是仅在 MQL5 网站上提供的原创产品。
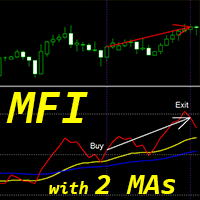
Crypto_Forex MT4 平台“MFI 和 2 条移动平均线”指标,无需重绘。
- 资金流量指数 (MFI) 是一种技术振荡指标,利用价格和成交量数据来识别超卖和超买区域。 - “MFI 和 2 条移动平均线”指标可让您查看 MFI 振荡指标的快速和慢速移动平均线。 - 指标让您有机会尽早发现趋势变化。 - 该指标可通过参数轻松设置,适用于任何时间周期。 - 您可以在图片上查看买入和卖出的入场条件。 - 买入信号条件: (1)- 快速移动平均线向上穿过慢速移动平均线; (2)- 红色 MFI 线位于快速移动平均线上方; (3)- 红线与黄线紧密接触; (4)- 红线从黄线反弹; (5)- 买入钩子刚形成 - 在此开仓; (6)- 重要提示:仅使用移动平均线交叉后的第一个钩子。 (7) 卖出交易反之亦然(见图)。
// 优秀的交易机器人和指标可在此处获取: https://www.mql5.com/en/users/def1380/seller 这是仅在 MQL5 网站上提供的原创产品。

Confluence+ 是一款多因子指标,通过结合趋势、动能和成交量来识别交易信号。依靠其动态共振系统,只有在多项技术条件同时满足时才会生成信号,从而有效减少假信号。 主要功能: 自适应趋势检测(动态均线 + ATR) 多周期确认(M15 至 D1) 高级动能过滤(RSI、随机指标、背离) 成交量与波动率分析(自动比率) 实时共振评分(0–100%) 可调参数:严格度、MTF、提醒 全彩信息面板 内置提醒:弹窗、声音、手机推送 Confluence+ 可自动适应市场环境,在外汇、指数和 XAUUSD 上无需频繁优化即可高效运行。适合 M15 日内交易和 H1 波段交易。 技术特点: 无重绘(信号在K线收盘时确认) CPU 占用 <5%,只对最近K线重新计算 2 个 Buy/Sell 箭头缓冲区 全面参数设置:趋势、动能、成交量、MTF、提醒
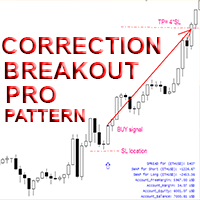
适用于MT4平台的加密货币外汇指标“修正突破专业版”,无重绘,无延迟。
- “修正突破专业版”指标是一款功能强大的价格行为交易指标,具有很高的盈利潜力。 - 该指标可检测价格修正后的看涨和看跌突破柱: - 看涨修正突破形态 - 图表上的蓝色箭头信号(见图)。 - 看跌修正突破形态 - 图表上的红色箭头信号(见图)。 - 支持PC和移动设备提醒。 - “修正突破专业版”指标非常适合与支撑/阻力位结合使用。 - 指标带有信息显示功能 - 显示所关联外汇货币对的当前点差和隔夜利息。 - 信息显示还显示账户余额、净值和保证金。 - 信息显示可以放置在图表的任意位置: 0 - 左上角,1 - 右上角,2 - 左下角,3 - 右下角。
// 这里提供优秀的交易机器人和指标: https://www.mql5.com/en/users/def1380/seller 这是仅在 MQL5 网站上提供的原创产品。
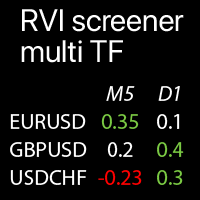
多时间框架RVI值在选定交易品种上的应用:比较当前市场趋势 该 指标 显示 相对活力指数(RVI) 值 来自 所有 选定 时间框架 和 交易品种 , 并 在 单个 表格 中 呈现 ,使您能够 快速 分析 当前 市场 价格 趋势 。 我的 多功能工具 : 66+ 功能 | 联系我 如有任何问题 | MT5版本 每个 交易品种 都可以自定义:删除或替换。您最多可以添加40个交易品种。 面板可以移动到图表的任何位置(任意拖放)。
在 输入设置 中,您可以配置: RVI指标设置: 移动平均周期,显示数据: "信号线"或"数值"。 每个时间框架 可以启用/禁用 。 高亮 选项:如果启用 - 极端水平将以自定义颜色高亮显示。 极端水平 设置:高值和低值。 警报 :可以为极端水平启用:高RVI / 低RVI / 两者。 视觉 样式:尺寸,深色/浅色主题,高亮颜色。 RVI(相对活力指数):
它是 技术分析中使用的动量震荡指标,通过比较证券的收盘价与其交易区
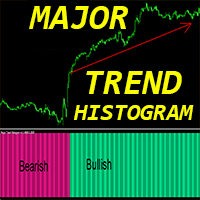
适用于 MT4 的加密货币外汇指标“ Major_Trend_Histogram ”,无需重绘。
- Major_Trend_Histogram 指标旨在捕捉真正巨大的趋势。 - 指标支持两种颜色:粉色表示看跌趋势,绿色表示看涨趋势(颜色可更改)。 - 它能够在趋势初期就进行检测,比任何标准移动平均线 (MA) 都更高效。 - Major_Trend_Histogram 可与任何其他交易方法结合使用:价格行为、VSA 和其他指标。 - 指标内置移动端和 PC 端警报。
// 优秀的交易机器人和指标可在此处获取: https://www.mql5.com/en/users/def1380/seller 本产品为独家产品,仅在 MQL5 网站上提供。
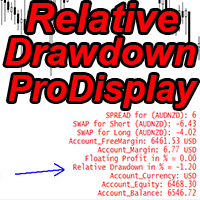
对于使用网格交易系统的交易者来说,这绝对是必备指标!!!
- 相对回撤专业显示指标以百分比显示您账户当前的相对回撤或浮动盈利。 - 内置 PC 和移动端提醒,触发级别可调。 - 它显示与其关联的外汇对的当前点差和隔夜利息。 - 指标还显示账户余额、账户净值和保证金。 - 指标值可在图表任意位置显示: 0 - 左上角,1 - 右上角,2 - 左下角,3 - 右下角。 - 还可以设置颜色和字体大小。 - 使用相对回撤显示,交易者无需再使用计算器。 ................................................................................................................. // 优秀的交易机器人和指标可在此处获取: https://www.mql5.com/en/users/def1380/seller 这是仅在 MQL5 网站上提供的原创产品。
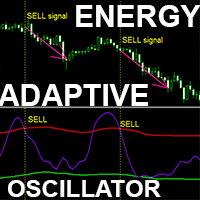
高级自定义加密货币外汇指标“自适应能量震荡指标”——MT4平台的高效辅助交易工具!
- 该指标是新一代震荡指标。 - “自适应能量震荡指标”具有可调节的自适应超卖/超买区域。 - 这是一款技术动量指标,在趋势市场中非常实用。 - 该震荡指标是一款辅助工具,可帮助您从超卖/超买区域找到进入主趋势方向的精确入场点。 - 自适应超卖区域:绿线下方。 - 自适应超买区域:红线上方。 - 它比标准震荡指标更精准。 - 该指标可用于任何时间周期。 - 内置PC和移动设备警报功能。 .............................................................................................................. // 更多优秀的交易机器人和指标请访问: https://www.mql5.com/en/users/def1380/seller 本产品为MQL5独家原创产品。
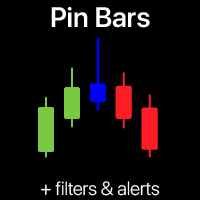
Pin Bar形态扫描器 | 智能警报和趋势过滤器 再也不会错过高概率的Pin Bar反转!这款自动化的Pin Bar形态扫描器为您完成繁重的工作。
这款交易工具实时扫描您的图表,识别强大的Pin Bar(锤子线/流星线)形态,并向您发送即时信号。该交易指标专为希望利用纯粹价格行为而无需猜测的新手和专家交易者设计。 我的 多功能工具 : 66+种功能,包括此指标 | 联系我 如有任何问题 | MT5版本
什么是Pin Bar形态及其在交易中的重要性? Pin Bar(Pinocchio Bar)是最可靠和最流行的价格行为模式之一。它表明价格被强烈拒绝,市场可能出现反转。其定义特征是一个至少占整个K线长度2/3的长影线,相对端有一个小的实体。 看涨Pin Bar (锤子线):在 下跌趋势 中形成。长下影线表明卖方将价格推低,但买方积极介入并将其推回,拒绝了较低的价格。
看跌Pin Bar (流星线):在 上涨趋势 中形成。长上影线表明买方将价格推高,但卖方积极介入并将其推回,拒绝了较高的价格。
如何使用Pin Bar形态进行交易: 该指标识别设置,您根据清晰的
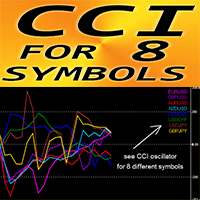
适用于 MT4 的“8 个交易品种 CCI”外汇指标,无需重绘。
- CCI 是最受欢迎的交易震荡指标之一。 - 商品通道指数 (CCI) 衡量当前价格与历史平均价格之间的差异。 - 重要水平:+/-200。 - 非常适合在 +200 以上区域进行卖出操作,在 -200 以下区域进行买入操作。 - “8 个交易品种 CCI” 允许在一张图表上控制多达 8 个不同交易品种的 CCI 值。 - 此指标也非常适合与价格行动入场相结合。 ................................................................................................................. // 优秀的交易机器人和指标可在此处获取: https://www.mql5.com/en/users/def1380/seller 这是仅在 MQL5 网站上提供的原创产品。
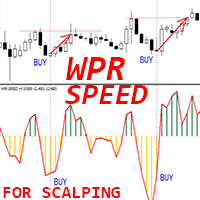
适用于 MT4 的 Crypto_Forex 指标“WPR SPEED”——卓越的预测工具,无需重绘。
- 该指标基于物理方程计算。WPR SPEED 是 WPR 振荡指标的一阶导数。 - WPR SPEED 非常适合在横盘和盘整市场中进行剥头皮交易。 - WPR SPEED 指标显示 WPR 自身方向的改变速度——它非常灵敏。 - 建议将 WPR SPEED 指标用于动量剥头皮交易策略:找到指标的峰值——在相反方向进行剥头皮交易(如图所示)。 - 指标内置移动端和 PC 端警报。 ................................................................................................................. // 优秀的交易机器人和指标可在此处获取: https://www.mql5.com/en/users/def1380/seller 这是仅在 MQL5 网站上提供的原创产品。
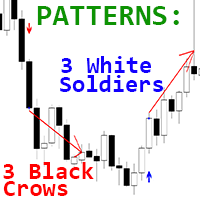
Crypto_Forex MT4 平台“三白三黑乌鸦形态”指标,无需重绘,无延迟。
- “三白三黑乌鸦”指标对于价格行为交易非常有效。 - 指标可检测图表上的三白三黑乌鸦形态。 - 看涨三白三黑乌鸦形态 - 图表上显示蓝色箭头信号(见图)。 - 看跌三黑乌鸦形态 - 图表上显示红色箭头信号(见图)。 - 提供 PC、手机和电子邮件提醒。 - “三白三黑乌鸦”指标非常适合与支撑/阻力位结合,并顺应主要趋势方向进行交易。 ................................................................................................................ // 优秀的交易机器人和指标可在此处获取: https://www.mql5.com/en/users/def1380/seller 这是仅在 MQL5 网站上提供的原创产品。

终极市场趋势大师 精准掌握市场方向的力量 Ultimate Market Master Trend 是一款为追求 清晰、精准与信心 的交易者打造的多功能市场趋势分析指标。
它融合了 智能趋势识别系统 、 多时间周期随机指标 以及 动态可视信号 ,帮助您轻松捕捉高胜率的买卖机会。 核心功能 1. 智能趋势系统(主图显示) 采用 LWMA200(线性加权移动平均线) 来确定市场主方向。 通过颜色区分趋势状态: 绿色云层 = 多头趋势(买入) 红色云层 = 空头趋势(卖出) 当价格与趋势线交互时显示 实时买卖箭头 ,帮助您及时识别趋势反转点。 2. 多时间周期随机指标面板(副窗口显示) 同时显示多个时间周期(如 M5、M15、M30)的随机指标信号。 每个时间周期以颜色代表动能方向: 绿色 → 上升动能 红色 → 下降动能 黄色 → 中性震荡 让您轻松确认主要趋势与当前周期的一致性,避免逆势操作。 3. 智能信号与提醒系统 仅在 趋势真正变化或确认交叉 时发送提醒。 启用 每日一次信号模式 ,避免重复提示。 适用于 手动交易者 、 信号服务提供者 与 EA 策略开发者 。 4. 完

PROFESSIONAL FOOTPRINT CHART INDICATOR
A Footprint Chart is an advanced order flow visualization tool that displays the volume traded at each price level within a candlestick. Unlike traditional candlestick charts that only show open, high, low, and close prices, footprint charts reveal the battle between buyers and sellers at every price level. KEY CONCEPT: Footprint charts show WHERE volume occurred, not just HOW MUCH volume occurred. This is critical for understanding institutional ac
Volatility Matrix – 会话波动率分析器 Volatility Matrix 分析当前市场波动率,并与历史会话进行比较,以检测异常并预测突破。该指标会将当前波动率与同一小时、同一星期几的 200+ 历史会话进行比较,并计算 Z-Score 来识别波动率是否偏离正常范围。 功能特点 实时 Z-Score 监控与显示 历史会话匹配(相同小时/星期几) 动态价格区间(±1σ 和 ±2σ 标准差) 突破概率预警(5 分钟冷却时间) 专业可视化面板显示市场状态 通用市场兼容性(外汇、贵金属、指数) 技术规格 历史周期:200 个会话(可配置 50–500) 偏差阈值:2.0 标准差(可配置 1.0–3.0) 性能优化:每根 K 线仅计算一次 自动点值检测(根据小数位数) 面板尺寸:180×100 像素 四角定位,可调偏移 使用方法 指标会显示一个紧凑面板,包括: 当前 Z-Score 值(18px 大号字体) 市场状态(正常、波动升高、高波动、突破警报) 基于波动等级的颜色标识 当 Z-Score 超过 2.0 时触发警报,表示突破概率较高。 如果找到的历史会话少于 10 个,指
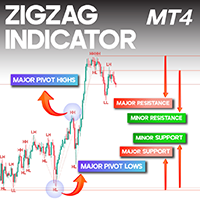
ZigZag Indicator for MetaTrader 4 The ZigZag Indicator in MetaTrader 4 is widely used for identifying significant highs and lows—known as pivot points —directly on the price chart. By marking both Major and Minor pivots, it helps traders recognize potential reversal zones and understand overall market structure. Each pivot is labeled as HH, HL, LH, or LL , making it easier to detect dominant trends as well as short-term price movements. Spotting these peaks and troughs is a vital component of te
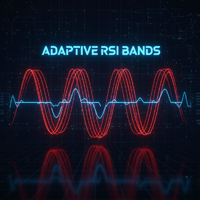
DESCRIPTION: Discover the power of adaptation with Adaptive RSI Bands, a revolutionary indicator based on the concepts of self-adaptive trading rules. Unlike traditional RSI with static levels of 70 and 30, this indicator “breathes” with the market, dynamically adjusting its overbought and oversold bands according to recent volatility.
Why use Adaptive RSI Bands? Markets are not static. An RSI level of 70 may be significant in a sideways market, but irrelevant in a strong trend. This indicator
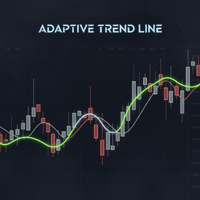
Adaptive Trend Line is not an ordinary moving average. It is an intelligent trend line that changes color based on the internal strength of the market, as measured by the RSI.
How does it work? It combines the smoothness of an Exponential Moving Average (EMA) with the sensitivity of the RSI. - Green Line: The RSI is above 55, indicating that buyers are in control. - Red Line: The RSI is below 45, indicating that sellers are in control. - Gray Line: The RSI is in the neutral zone (45-55), indic

TrendScan is a visual scanner that detects bullish, bearish, or neutral trends across multiple symbols and timeframes. It analyzes market structure, EMA alignment, and price range to display clean, reliable signals. Ideal for traders seeking clarity and speed in their analysis.
Compatible with up to 25 symbols. Support for 8 timeframes. Advanced trend filters. Compact and customizable visual interface.
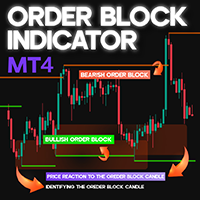
Order Block Indicator for ICT and Smart Money Trading in MT4 The Order Block Indicator is an important tool for traders using ICT (Inner Circle Trader) and Smart Money Concepts on the MetaTrader 4 (MT4) platform.
This indicator highlights key price zones where institutional orders are likely positioned, helping traders identify potential reversal points and strong reaction levels.
Bullish order blocks are displayed in green , while bearish ones appear in brown . When price enters these zones, it
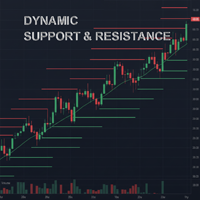
Forget about drawing lines manually. Dynamic Support x Resistance automatically identifies critical price levels based on the market structure of higher time frames. Inspired by institutional strategies, this indicator projects the significant highs and lows of the last few days (or the period you choose) directly onto your trading chart.
Why is it different?
Many support and resistance indicators are too complex or subjective. This indicator uses pure, hard logic: “If the price breaks the hi
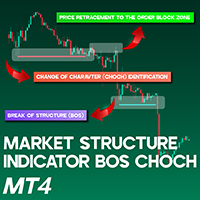
Market Structure Indicator BOS CHOCH MT4 The BOS-CHOCH Market Structure Indicator is an ICT-inspired tool developed for MetaTrader 4 (MT4). It is designed to help traders who follow ICT methodologies identify shifts in both dominant and secondary market trends. By pinpointing structural breaks and changes in market character, this indicator enhances technical analysis and supports more accurate trading decisions.
Market Structure Indicator (BOS-CHOCH) Overview Below are the general details and

MULTI INDICATOR SCANNER - PROFESSIONAL EDITION
PRODUCT DESCRIPTION
Multi Indicator Scanner is the most comprehensive technical analysis scanner on the market. It analyzes 10 different indicators simultaneously and provides you with clear BUY-SELL-NEUTRAL signals. No more checking dozens of indicators one by one!
Multi Pivot Indicator - Professional Trading Tool MULTI
PIVOT PRO INDICATOR Professional Multi Pivot Indicator for MT4 5-in-1 Pivot Indicator Professional Trading Tool for MetaTrader 4 ENGLISH TÜRKÇE Multi Pivot Indicator PRO Classic Fibonacci Camarilla Woodie DM What is Multi Pivot Indicator? Multi Pivot Indicator is a professional trading tool that displays 5 different pivot calculation methods on your MetaTrader 4 charts. Pivot points are critical support and resistance
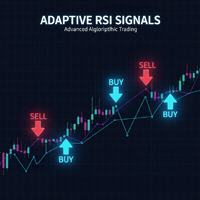
Adaptive RSI Signals is the complete implementation of the Auto-Adaptive Trading Rules strategy. This indicator combines market structure (Dynamic Support and Resistance) with the intelligence of Adaptive RSI to generate high-probability buy and sell signals directly on your chart.
What is the strategy? The indicator looks for extreme situations where the price has broken a key support or resistance level from previous days, BUT the RSI has also reached a dynamically calculated extreme deviati
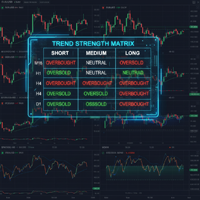
Tired of switching between charts? Trend Strength Matrix gives you an eagle-eye view of the market. This professional dashboard monitors the status of the Adaptive RSI across four key time frames (M15, H1, H4, D1) simultaneously.
What does this dashboard tell you? For each time frame, it calculates in real time: 1. The current RSI value. 2. The “Adaptive Status”: Is the market in an Overbought or Oversold zone based on historical volatility?
FEATURES: - Information at a glance: Instantly see
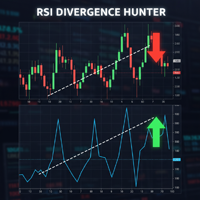
Divergences are one of the most powerful signals in technical analysis, but they are difficult to spot with the naked eye in real time. RSI Divergence Hunter automatically scans the market for these discrepancies between price and momentum.
What is a divergence? - Bullish: The price makes a lower low, but the RSI makes a higher low. (Buy signal). - Bearish: The price makes a higher high, but the RSI makes a lower high. (Sell signal).
FEATURES: - Automatic Detection: Intelligent algorithm that
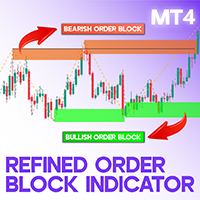
Refined Order Block Indicator MetaTrader 4 The Refined Order Block (OBR) indicator is a specialized tool designed for traders who follow ICT and Smart Money (SMC) methodologies on the MetaTrader 4 (MT4) platform. This indicator highlights bullish order blocks in green and bearish order blocks in brown, helping traders identify critical market zones. Order block regions are key price areas where significant institutional orders can increase the likelihood of trend reversals or directional shifts
# Product Name: SamuraiFX Momentum Hunter **Current Version:** 4.0 (Smart Validation Update) **Category:** Trend / Oscillators / Fractals **Timeframes:** M15, H1, H4, D1 (Recommended)
### ️ Trade with Discipline. Eliminate the Noise.
**SamuraiFX Momentum Hunter** is not just another arrow indicator. It is a complete trading system that combines the momentum of the **Awesome Oscillator (AO)** and **Accelerator Oscillator (AC)** with the structural precision of **Fractals**. Most indicators flo
Verion PowerSignal es un indicador diseñado para proporcionar señales visuales de posibles cambios en la dirección del precio, basado en un análisis interno de las condiciones del mercado que combina la dinámica de las velas y el comportamiento estructural. El propósito del indicador es ayudar al usuario a identificar áreas donde el precio puede mostrar cambios de impulso, agotamiento o continuidad dentro de una tendencia existente. Las señales se muestran directamente en el gráfico como flechas

Read carefully, because I’m about to sell my strategy based on over 11 years of study: This indicator plots multiple levels: thick and dotted, taking the ATR into account. On 90% of trading days, it touches one thick level and one dotted level. Levels are updated daily. If the price touches a thick level and a dotted level in a single day, trading for that day is over—you wait for the next day to look for the same setup. If the price comes very close to a level but doesn’t reach it, it’s likely
Shows Kaufman Efficiency Ratio value and smoothed by MA. Calculation is based on movement divided by volatility on a specified period. Levels are adjustable as well as visualization. Parameters: KERPeriod - period for ratio calculation. EMAPeriod - period for moving average. Shift - indicator shift. HigherLevel - low value of the higher zone. LowerLevel - high value of the lower zone. ShowHigherZone - allow higher zone drawing. HigherZoneColor - higher zone color. ShowLowerZone - allow lower zon
FREE

Stop Guessing, Start Sniping: Introducing SR Sniper! Tired of entry points that seem random? The SR Sniper indicator is your new essential tool for finding high-probability trades with surgical precision. It's designed to cut through the market noise, giving you clear Buy and Sell signals right at the most critical price zones. This powerful indicator combines the dynamic analysis of the Commodity Channel Index (CCI) with automatic Support and Resistance (S/R) detection —and then filters everyt
FREE

Stop Guessing, Start Winning: Meet Swing Hunter Pro! Are you tired of confusing charts and late entries? The Swing Hunter Pro indicator is your ultimate weapon for capturing profitable market swings with unmatched clarity and confidence. This powerful tool combines the best of Hull Moving Averages (HMA) and Exponential Moving Averages (EMA) with a strict trend filter, giving you strong, high-probability signals right on your chart. Available in EA format. Link download https://www.mql5.com/en
FREE

TouchGuard Alert – Advanced Price Alert & Notification Indicator for MetaTrader 4 (MT4) TouchGuard Alert is a fast, lightweight, and highly accurate price-touch Alert & Notification system designed for MetaTrader 4 (MT4) and MetaTrader 5 (MT5) . It automatically sends real-time Alerts, Pop-Up Alerts, Email Notifications, Push Notifications and early-warning notifications when price touches or approaches your chart objects. Key Features (High-Precision Alert & Notification System)
Stop Guessing, Start Confirming: Introducing Signal Sentinel Are you tired of signals that leave you hanging? The Signal Sentinel indicator is your ultimate weapon against market uncertainty, designed to deliver high-probability trading setups directly to your chart. We've combined the power of two MACDs with a long-term EMA filter to ensure you only trade in the strongest, most confirmed trends. This isn't just another indicator; it's a complete confirmation system that acts as your guard a
FREE

Stop Chasing Trends, Start Sniping Reversals: Introducing Stochastic Sniper Are you tired of trading sideways markets or getting caught by false breakouts? The Stochastic Sniper indicator is engineered for precision entry . It combines the volatility channels of Keltner Bands with the momentum timing of the Stochastic Oscillator to pinpoint extreme price reversals with high accuracy. Think of it as having a sniper scope on the market. It waits for the price to stretch to its maximum, confirm
FREE
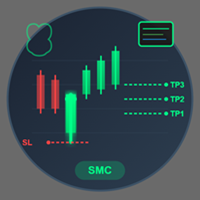
Only 5 copies $49 next price will be $89 Recommended Pair : XAUUSD, BTCUSD Recommended Timeframe : M15 Recommended Broker : ECN low or zero spread broker MT5 Version
The Smart Money SMC Breakout Indicator provides precise Buy/Sell breakout signals based on Smart Money Concepts. It automatically generates 3 Take-Profit levels and a Smart Stop-Loss level , helping traders manage entries and exits with clarity. The indicator includes a professional Statistics Panel with two selecta
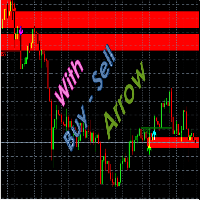
Indicator Guide: Key Price Levels & Structure Shifts 1. Description The indicator is a technical analysis tool for the Meta Trader 4 platform. It is designed to automatically identify specific price movements and to highlight corresponding price zones based on preceding price action. This provides a visualization of key price areas according to the indicator's internal logic. 2. Visual Elements & Their Identification The indicator identifies and draws several types of visual elements on the char

Trend tier-профессиональный индикатор визуализации каналов, разработанный для быстрого анализа дневной структуры цены и удобного мониторинга ключевых уровней. Индикатор автоматически определяет текущий максимум и минимум торгового дня по таймфрейму M5 и строит две отдельные проекции (High и Low), которые можно настраивать отдельно по процентному и фиксированному сдвигу. Каждая проекция формирует набор уровней (уровни вверх/вниз), опциональные P1-линии и рамки, а также «overlay» — чёрные

This is the MACD Confirmation Dashboard that allows users to find signal across all timeframes where signals agree. The Dashboard also provides ADR, AWR and AMR to allow its users to know range left for a pair. The AI Scoring System is currently in its early development and will continue to be updated. This Dashboard also has a Trade Executor that will Execute trades when signals are received however, this is a separate product and is in development and will begin sale as a compliment to the

This indicator identifies market structure breakouts using ZigZag-based swing points and confirmation blocks. When price breaks above a bullish block or below a bearish block, it generates a BUY/SELL signal and automatically draws Fibonacci levels for entry, stop-loss, and targets. Built-in alerts notify you instantly when a valid breakout forms, making it useful both as a stand-alone tool or as a powerful addition to any existing strategy.
Since this tool relies on ZigZag structure, some hist

# Product Name: Gold ATR Pro – Daily Breakout System
**Gold ATR Pro** is a specialized trend-following indicator designed exclusively for **XAUUSD (Gold)**. It eliminates market noise by identifying high-probability breakout zones based on the **Daily Opening Price** and **ATR (Average True Range)** volatility.
Unlike standard indicators that repaint, **Gold ATR Pro** provides fixed, reliable signals based on confirmed candle closes, ensuring that what you see on historical charts is exactly w

**Product Name:** Gold Seasonality Pro (Auto Fibonacci) **Headline:** Automate the "Smart Money" Seasonal Strategy for Gold (XAUUSD). **Overview** Stop guessing where Gold will reverse. History shows that **March** and **October** are the two most powerful months for institutional trend changes. **Gold Seasonality Pro** automatically scans for these key months, analyzes the buying or selling pressure, and draws the exact Fibonacci "Sweet Spot" levels for you. It turns 45 years of statistical dat

符号: USDCHF、USDJPY、XAUUSD、GBPUSD、EURUSD、AUDUSD、GBPJPY(我最喜欢 USDCHF_H1)
时间周期: H1, H4, D1
主要特点: 无重绘、无延迟、趋势信号、多重确认
安全性: 信号包含止损、止盈,并遵循风险回报规则
包含: 免费多周期扫描器(购买产品后,只需通过私信发送截图给我,我会亲自把扫描器文件发送给您。)
完整的交易系统概念: 阅读文章 (完整概念在本文中解释) Break Out Explosion 的 MT5 版本现已上线: https://www.mql5.com/en/market/product/152676 展示我在 1000 美元账户上真实交易的实时信号 : https://www.mql5.com/en/signals/2348010
加入讨论 在 MQL5 社区聊天中有一个支持小组。 加入 支持小组 ,与其他用户分享想法、提问或讨论交易策略。 关于 Break Out Explosion Break Out Explosion 是一套完整的交易系统,用于识别与主要市场趋势方向一致的

Smart Risk Manager Pro – 拖拽即可自信交易
Smart Risk Manager Pro MT5: https://www.mql5.com/en/market/product/155713 Smart Risk Manager Pro 是一款专业级图表内风险管理工具,能够根据你的美元风险自动计算仓位大小。 只需在图表上 点击并拖拽 ,指标就会立即显示: 方向 (Buy / Sell) 距离 (点数) 推荐手数 (基于你的 RiskUSD 数值) 该工具极其轻量、非常快速,专为需要 干净图表 和 以风险为核心 交易流程的交易者设计。 功能特点 ️ 在图表上拖拽即可直接测量风险 ️ 智能自动手数计算 ️ 显示买卖方向(Buy/Sell) ️ 显示点数距离 ️ 适用于所有品种(外汇、黄金、指数、加密货币) ️ 超高速 – 几乎零延迟 ️ 界面干净、极简 ️ 无子窗口、无笨重面板 ️ 只在你松开鼠标时计算 → 节省 CPU 资源 使用方法 将 Smart Risk Manager Pro 附加到任意图表。 设置你希望的 RiskUSD 金
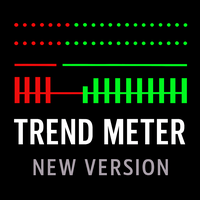
Trend Meter – 多货币趋势强度分析器 Trend Meter 是一个强大且极轻量化的趋势指标,可让你一眼看到 趋势强度 —— 实时、彩色显示、清晰、无延迟。 它会分析 多个时间周期 、 多个货币对 以及 多个内部趋势信号 ,并将所有信息组合成一个紧凑的“趋势指示灯”。 非常适合剥头皮交易、日内交易和波段交易。
适合新手和专业交易者 —— Trend Meter 会立即显示: 是否存在趋势 趋势强度 趋势方向(BUY 或 SELL) 多个确认信号 颜色、大小和位置完全可自定义 主要功能 趋势分析(Trend Meter 1、2、3) 该指标包含 三个独立的趋势模块 : Trend Meter 1
→ 使用更亮的颜色(浅绿色 / 浅红色)
→ 对趋势变化反应 最早 (早期信号) Trend Meter 2
→ 主要趋势逻辑(绿色 = BUY / 红色 = SELL)
→ 中等敏感度
→ 非常适合剥头皮和日内交易 Trend Meter 3
→ 最强过滤
→ 仅显示 清晰、确认的趋势 这三个模块可 一起使用或单独使用 。
交易者可以立即看到 有多少模块一致 →

想象一下:你正处于巨额利润的边缘,但市场突然发生变化,你错过了机会。 或者更糟糕的是,你得到的是损失而不是利润。 如果你有一个可靠的盟友提前低语:"做好准备-海浪来了!"? 遇见 Harbinger,MetaTrader4 的革命性指标,专为厌倦混乱并希望预测市场变化的交易者而设计!
Harbinger 是一种智能算法,可以分析隐藏的趋势波动模式,以令人难以置信的准确性发出即将到来的回调,反转或累积的信号。 Harbinger mt5 version
如何使用Harbinger指标.
当指标 Harbinger 的信号出现在图表上时,这意味着信号之前的价格走势将被停止。 并且会有累积,回滚,或者一起回调的累积,或者趋势反转。 通常这两件事同时发生。 最主要的是要明白,如果一个信号出现,这意味着先前趋势的变化即将到来。 所有这些都让我们明白,我们需要重新考虑我们在这个工具市场上的未平仓头寸。 并采取必要的安全措施。 例如,您可以将其设置为盈亏平衡,或锁定部分利润,甚至完全锁定整个利润。
如果在指标 Harbinger 的信号出现后,市场的积累阶段已经开始,最好等待积累结束,然后

Dynamic FVG Detector – MetaTrader 4 公平价值缺口指标 Dynamic FVG Detector 可在图表上自动检测并显示公平价值缺口(FVG)。它识别三根K线形成的价格低效区域,并在价格回填时实时更新这些区域。 主要功能 自动识别多头与空头 FVG 可自定义点差阈值 基于三根K线的最小结构 区域创建时立即进行历史验证 动态回填监控 根据价格行为持续调整 区域大小根据回填百分比自动缩小 区域完全填补后自动移除 实时更新 提供两种模式: 标准模式:在新K线形成时更新 实时模式:每个tick检测和更新,优化为监控最近10根K线 可视化显示 绿色(多头)、红色(空头)、灰色(已填补)矩形 区域自动向当前时间延伸 可调节透明度及已填补区域的显示 性能优化 可设置历史扫描深度 可限制最大跟踪区域数量 自动清理图表对象 防止重复检测 适用于所有时间周期 使用场景 适用于识别价格反应区域、优化入场点、设置止损与目标,以及分析市场结构。

产品标题 Smart Moving Average (MT4) – SmartView 系列的一部分 简短描述 面向 MT4 的新一代均线指标,内置图表智能控制面板,支持一键显示/隐藏、动态缓冲区数值悬停显示以及现代化参数窗口,并可与其他 Smart Indicators 系列指标无缝协同工作。 概述 Smart Moving Average 专注于用户体验:在图表左上角提供紧凑控制面板,直观展示关键参数,双击即可打开原生参数窗口,一键隐藏/显示或删除当前实例,并可在面板中直接查看实时与历史数值。 主要功能 图表内 Smart 控制面板,在图表上直接查看和管理关键参数。 双击快速打开设置窗口,一键隐藏/显示或删除当前实例。 适合多个 Smart 指标同时运行的清晰布局,自适应深浅色背景,并在悬停 K 线时于面板中显示缓冲区数值,配合简洁提示说明。 输入参数 标准均线参数(周期、算法、价格类型),并扩展了可视化控制(颜色、突破 MT 传统上限的线宽、线型选择),集中在整洁的主选项卡中便于编辑。 适用场景 适合在同一图表上运行多种 Smart 指标、追求干净工作区域与快速设置入口的交易者,
FREE
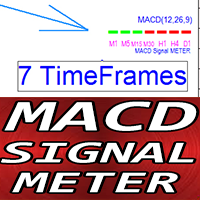
适用于 MT4 的 Crypto_Forex MACD 信号 METER 指标。
- 非常实用的 MACD 信号 METER 指标可同时显示 7 个时间框架的当前 MACD 值(高于/低于信号线)。 - 绿色矩形 - MACD 位于信号线上方。 - 红色矩形 - MACD 位于信号线下方。 - 外汇 MACD 信号 METER 指标可用作多时间框架交易系统的交易入场过滤器。 ................................................................................................................. // 优秀的交易机器人和指标可在此处获取: https://www.mql5.com/en/users/def1380/seller 这是仅在 MQL5 网站上提供的原创产品。
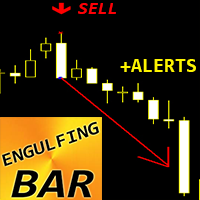
Crypto_Forex 指标 ENGULFING Bar Pattern 适用于 MT4,无需重绘,无延迟。
- “ENGULFING Bar” 指标是一款非常强大的价格行为交易指标。 - 指标可检测图表上的 ENGULFING Bar 形态: - 看涨 ENGULFING Bar - 图表上显示蓝色箭头信号(见图)。 - 看跌 ENGULFING Bar - 图表上显示红色箭头信号(见图)。 - 提供 PC、手机和电子邮件提醒。 - “ENGULFING Bar Pattern” 指标非常适合与支撑/阻力位结合使用。
// 优秀的交易机器人和指标可在此处获取: https://www.mql5.com/en/users/def1380/seller 本产品为独家产品,仅在本 MQL5 网站上提供。
MetaTrader 市场 - 在您的交易程序端可以直接使用为交易者提供的自动交易和技术指标。
MQL5.community 支付系统 提供给MQL5.com 网站所有已注册用户用于MetaTrade服务方面的事务。您可以使用WebMoney,PayPal 或银行卡进行存取款。
您错过了交易机会:
- 免费交易应用程序
- 8,000+信号可供复制
- 探索金融市场的经济新闻
注册
登录