适用于MetaTrader 4的新技术指标 - 13

This indicator allows you to find out how much the price can pass on the current bar. It looks for the average ATR value for the previous 5 bars and draws 2 price boundaries. You can use it on any timeframe of any instrument.
Based on this indicator, you can set stop loss and profit levels, as well as use it in other good strategies.
Do not forget to use risk management while trading!
FREE
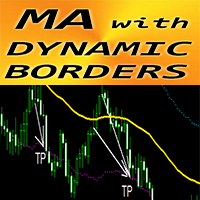
MT4 外汇指标“MA with Dynamic Border”
指标具有附加到移动平均线的独特功能 - 动态波动边界 动态波动边界使用平均真实范围值进行计算 该指标非常适合止盈定位和边界线止损安排 指标也非常适合与价格行为条目结合使用 ............................................................................................................. // 这里提供更多优秀的 EA 交易和指标: https://www.mql5.com/en/users/def1380/seller 它是仅在该 MQL5 网站上提供的原创产品。

Tired of using the same technical indicators? The "Tekno RSI" is an innovative tool designed to make the interpretation of the Relative Strength Index (RSI) more intuitive and accessible to traders of all levels. It displays the RSI as a 3-color histogram, providing a clear and intuitive visual representation of market conditions.
1)Key Features 3-Color Histogram: RSI is a versatile indicator providing insights into market direction and potential reversal points. However, when analyzing the ch
FREE

The Ruby Trend indicator calculates the saturation levels of the price chart. A signal to exit the resale area is a buy signal. A signal to exit the overbought area is a signal to sell. Usually you need to set relative values for the overbought and oversold levels Bottom and Top for this indicator.
Most often, a good trend is visible visually on the price chart. But an experienced trader must clearly understand the current balance of power in the market before entering. And the indicator will

Using the Neo Forex indicator algorithm, you can quickly understand what trend is currently developing in the market. The NeoX indicator accompanies long trends and can be used without restrictions on instruments or timeframes. Using this indicator you can try to predict future values. But the main use of the indicator is to generate buy and sell signals. The indicator tracks the market trend, ignoring sharp market fluctuations and noise around the average price. The indicator implements a type

The Compare Graphs indicator is an analysis tool that allows traders to compare two or more graphs on the same chart window. This indicator is commonly used in trading platforms such as MetaTrader and provides a clearer comparison of different financial instruments or time frames.
Functions of the Compare Graphs indicator may include: Selecting Charts: The trader can select the charts he wants to compare, such as price charts of different currency pairs or indicators on the same chart. Settin

RockTrader is an indicator that identifies market direction across chosen currency pairs and generates line signals for potential buy and sell opportunities within the selected timeframe. Its straightforward design makes it highly regarded and easily comprehensible for traders at basic and intermediate levels. The visual representation on the chart also enables users to conduct pure price action analysis. RockTrader is versatile, functioning across various financial assets, and boasts over an 85
The FX_ride custom indicator assists traders in recognizing market trends across preferred currency pairs and provides signals based on trend strength via a multi-colored histogram within chosen timeframes. It is particularly suited for day trading, swing trading, and position trading. Following signals from FX_ride in conjunction with employing sound money management practices can enhance the likelihood of profitable trading outcomes.

Miko Trend is a hybrid trend indicator, as it is based on signals from elementary indicators and a special algorithm for analysis. The indicator shows favorable moments for entering the market. The indicator's intelligent algorithm determines the trend, filters out market noise and generates input signals.
The indicator can be used primarily to determine the trend. The indicator can work both for entry points and as a filter. Uses two parameters for settings. The indicator uses color signalin

Contact me after payment to send you the user manual PDF file. Introduction The moving average indicator is the most well-known and one of the most popular indicators among traders. It is very simple to work with, but a basic question has always become a big challenge among traders: What is the most optimal setting of the moving average for each chart-time frame? The answer to this question is very difficult, you have to try different settings of the moving average indicator for different chart

Indicator for determining the direction of the current trend Sends signals about trend changes to the terminal, smartphone and email Allows you to quickly navigate when changing price direction Works on all timeframes, on any currency pairs, metals and cryptocurrencies Can be used when working with binary options Distinctive features Doesn't redraw Gives three types of signals Has simple settings Quickly adapts to any trading instrument; Works on all timeframes and all symbols; Suitable for trad

Subscribe to the 'MA7 Trading' channel to receive notifications about new programs, updates and other information. Ask questions in the profile on the MQL5 .
Description of work
The 'MA7 Flax' indicator is based on the standard Average True Range (ATR) indicator and candle data. Shows candles that are larger in size relative to the ATR indicator value. Detailed information about the 'MA7 Flax' indicator.
Indicator settings
General settings: ATR period – Average True Range indicator period
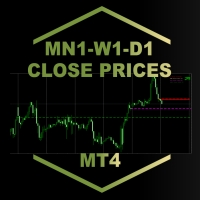
MN1-W1-D1 Close Price Indicator to Index Trading for MT4
The indicator draws lines to the close prices of the last closed bars of monthly, weekly and daily timeframes. Observably, these prices are significant support and resistance prices at major indices, like Nasdaq, DAX. The info panel always shows the prices relative to each other in the correct order. If the current price is the highest - i.e. higher than the last monthly, weekly and daily closing price - it is in the first row. The lowest

Subscribe to the 'MA7 Trading' channel to receive notifications about new programs, updates and other information. Ask questions in the profile on the MQL5 .
Description of work
The 'MA7 Viola' indicator is based on the standard Moving Average (MA) indicator. Shows a sharp increase or decrease in the moving average. Detailed information about the 'MA7 Viola' indicator.
Indicator settings
General settings: Difference – difference between the last two MA values, percentage; Period ; Method
Introducing the Engulfing Goddess Metatrader 4 (MT4) Indicator , a revolutionary tool designed for traders who seek to harness the power of candlestick patterns in their trading strategy. This indicator is built on the principles of engulfing candlestick patterns , a popular method used by successful traders worldwide. Our Engulfing Goddess Indicator stands out with its ability to detect various kinds of engulfing patterns . It employs a range of filters, providing you with a comprehensiv
Embrace the Power With Ultimate Trend Trader Indicator. Facing the reality of individual traders, we are far from harnessing the capabilities of AI and high-frequency trading algorithms that dominate today's markets. Without access to massive data centers or infrastructure to compete on microseconds, the battle seems skewed. Yet, the true advantage lies not in technological arms but in leveraging human intellect to outsmart the competition. The Ultimate Trend Trader Indicator embodies this appr
Exclusive Limited Time Offer! Grab this powerful indicator for a lifetime at just $65. Open the power of precise decision-making with our revolutionary product, FX Correlation Matrix. This indicator is your key to understanding multiple FX currency pairs' positive and negative correlations at a glance, providing valuable insights to elevate your trading strategies.
Indicator Features:
Multiple-Frame Multi-Currency Dashboard: Displays 10 multiple currency pairs positive and negative correlati
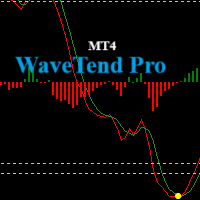
Introducing the Wave Trend Oscillator Indicator for MetaTrader 4(MT4). Our carefully designed oscillator leverages wave trend analysis principles to track market trends accurately. It assists traders in identifying potential buying and selling points based on market wave patterns, allowing you to stay informed. Key Features: Divergence Detection : Spot potential reversals in the market. Intermediate Level Crosses : Gain granular insights into market trends. Please note: The indicator states are

Introducing Momentum Jurik—an innovative indicator designed to optimize your forex trading strategy by incorporating custom moving averages based on the Momentum indicator with the MetaTrader 4 indicator, Momentum.
Jurik moving averages are renowned for their precision and reliability in analyzing price movements in the forex market. They provide traders with smoother representations of price action, reducing noise and offering clearer signals for identifying trends and potential reversals.
FREE

Introducing CCI Jurik—a dynamic indicator designed to elevate your forex trading experience by integrating custom moving averages based on the Commodity Channel Index (CCI) with the MetaTrader 4 indicator, CCI.
Jurik moving averages are renowned for their accuracy and reliability in analyzing price movements in the forex market. They offer traders a smoother representation of price action, reducing noise and providing clearer signals for identifying trends and potential reversals.
The Commo
FREE

Introducing MACD Jurik—an advanced indicator designed to enhance your forex trading strategy by integrating custom moving averages based on the Moving Average Convergence Divergence (MACD) with the MetaTrader 4 indicator, MACD.
Jurik moving averages are renowned for their accuracy and reliability in analyzing price movements in the forex market. They offer traders smoother representations of price action, reducing noise and providing clearer signals for identifying trends and potential revers
FREE

Introducing Austin Bands—an innovative indicator designed to enhance your forex trading strategy by applying moving averages to the MetaTrader 4 indicator, Bollinger Bands.
Bollinger Bands are a popular technical analysis tool that consists of a middle band (usually a simple moving average), an upper band (calculated by adding a specified number of standard deviations to the middle band), and a lower band (calculated by subtracting a specified number of standard deviations from the middle ban
FREE

Introducing RSI Jurik—an innovative indicator designed to revolutionize your forex trading strategy by combining custom moving averages based on the Relative Strength Index (RSI) with the MetaTrader 4 indicator, RSI.
Jurik moving averages are renowned for their accuracy and reliability in analyzing price movements in the forex market. They provide traders with smoother representations of price action, reducing noise and offering clearer signals for identifying trends and potential reversals.
FREE

Introducing Demarker Jurik—an innovative indicator poised to revolutionize your forex trading strategy. This indicator combines the precision of custom moving averages based on the Demarker indicator with the MetaTrader 4 indicator, Demarker.
Jurik moving averages are renowned for their accuracy and reliability in analyzing price movements in the forex market. They offer traders smoother representations of price action, filtering out noise and providing clearer signals for identifying trends
FREE

Introducing Force Jurik—a powerful indicator designed to enhance trading insights by combining custom moving averages based on Jurik with the MetaTrader 4 indicator, Force Index.
Jurik moving averages are renowned for their precision and smoothness, making them ideal for analyzing price movements in the forex market. They offer traders a reliable method of identifying trends and filtering out market noise, ultimately providing clearer signals for decision-making.
The Force Index, a popular
FREE
Introducing Austin RSI—an innovative indicator designed to elevate your forex trading strategy by applying moving averages to the MetaTrader 4 indicator, RSI.
The Relative Strength Index (RSI) is a popular momentum oscillator that measures the speed and change of price movements. It oscillates between 0 and 100 and is used to identify overbought and oversold conditions in the market. Traders often use RSI to gauge the strength of price movements and anticipate potential trend reversals.
Aus
FREE

The MACD 2 Line Indicator is a powerful, upgraded version of the classic Moving Average Convergence Divergence (MACD) indicator.
This tool is the embodiment of versatility and functionality, capable of delivering comprehensive market insights to both beginner and advanced traders. The MACD 2 Line Indicator for MQL4 offers a dynamic perspective of market momentum and direction, through clear, visually compelling charts and real-time analysis. Metatrader5 Version | How-to Install Product | How-t
FREE

Fair Value Gap is and MT4 Non Repaint and Non Lagging indicator which give alerts upon a signal is detected. It can be used for both scalping and swing trading.
The indicator is based on Trend following strategy and inbuilt trading algorithms of pure price action
Has alerts and also push notifications to your phone with signals to buy or sell.
Works on all Time-frames and MT4 brokers. It is as well a Multi-Currency Indicator, including Gold, Nasdaq and US30 pairs
Take advantage of this wo
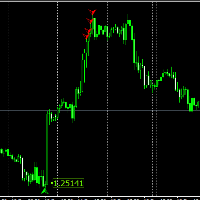
For those who have followed my FCK Quantum Scalping thread know about the FCK Quantum Scalping indicator and have taken the indicator to different levels (Mastermind) to suit his or her trading style. In this system, the Quantum indicator is only for showing us trading entries, and that’s it. Targets and stop levels are a little later. For those who don’t know what the FCK Quantum Scalping indicator is, I’ll tell you. The FCK Quantum Scalping indicator is basically a modified Wave indicator

RaysFX Donchian Channel
Questo indicatore può essere utile per identificare i livelli di supporto e resistenza, nonché per visualizzare visivamente la gamma di prezzo di un determinato periodo. Variabili Valore Periodo 20 TimeFrame Current Mode High/Low(true) o Close (false) Modalità true Telegram: https://t.me/SmartSaverOfficial Store: https://www.mql5.com/it/users/rays96/seller
Questo indicatore è stato Progettato da RaysFX

The Limiter One of the helpful tool to identify the limits of HH, HL, LH and LL easily, The Limiter is only a auxiliary tool and not a complete trading system, The market changes his psychology every week, day and sometimes every hour, for that there's no fixed default values and you must use the tuners settings and change the values, and use the limiter as you need, it's very simple customized tool, you can use it with any kind of indicators to have the best entry Recommend to use it on H1 bu

RaysFX TMAT3 è uno strumento potente che combina due tipi di medie mobili per aiutarti a identificare e seguire le tendenze del mercato. L’indicatore utilizza una media mobile triangolare centrata (TMA) e un T3 Moving Average. Queste due medie mobili lavorano insieme per fornire segnali di trading chiari e tempestivi. Quando il T3 Moving Average è inferiore alla TMA, l’indicatore considera che la tendenza del mercato sia al rialzo e genera un segnale di acquisto. Al contrario, quando il T3 Movin
Draw On 1 Timeframe: Does exactly what the name says! When you draw a rectangle or trendline - the timeframe you draw it in, is the one it is visible. When you look at a higher or lower timeframe - the drawn object is not seen, but when you change back to the timeframe you originally draw in - the object can be seen. How to use it: This is an indicator that interacts with all trendline or rectangle objects drawn. Once running - it will automatically make any drawn trendline or rectangle objec

Market Structure MTF Dashboard Alerts: Is an fast way of checking the currently market structure on 4 timeframes! It lets you know if you are trading in the direction of both long-term and shor-term market bias. It is setup to track the High and Low positions to determine the current bias. Once the bias is shifting on the any of the 4 timeframes - you have the option to have an alarm notify you of the change. Once the alarm has gone off - you will be able to see a break of structure (BOS) form

ATSCStrategy is a versatile indicator designed for both binary options and forex markets. Empower your trading strategies with this dynamic tool, providing valuable insights for making informed decisions in the fast-paced world of binary options and forex trading.
-Forex Market
-Binary Option Market
-Binary use timeframe 1M - 5M
-Forex use timeframe M30 or high
FREE

介绍我们的新指标:[ON Trade Breakout Zone] 对所有交易者而言简单而强大的市场分析工具! 适用于专业人士和初学者 您准备激发您的交易策略吗?我们最新的指标旨在简化市场分析,并赋予各个层次的交易者力量。无论您是经验丰富的专业人士还是初学者,[ON Trade Breakout Zone] 是您解锁市场潜在利润的关键。 如何使用 [ON Trade Breakout Zone]: 每天,这个智能工具都会使用其先进的算法在您的图表上轻松绘制区域。以下是如何充分利用它的方法: 区域识别: [ON Trade Breakout Zone] 准确识别图表上的关键区域,让您轻松发现潜在的交易机会。 交易执行: 等待价格移动到绘制区域的任一侧。 如果价格上涨超过购买线,请考虑输入购买交易,目标设置在上部绘制的水平。 如果价格下跌到卖出线以下,请考虑输入卖出交易,目标设置在下部绘制的水平。 风险管理: 在中心线上设置止损水平,以实现有效的风险管理。 资金管理: 遵循合理的资金管理规则,以优化您的交易策略。 独立使用: ON Trade Breakout Zo

StalkeR Arrow 是一个箭头指标,可在柱形开盘/柱内发出买入和卖出信号,该指标基于价格行为模式和分形
该指标为每个买入和卖出信号提供 tp 和 sl ,tp 和 sl 以线的形式出现在每个信号的上方和下方,它们会延伸直至形成新的信号。
该指标具有回溯测试面板/仪表板,可提供历史信号的赢/输统计数据,该指标不会重新绘制或背面绘制。
参数 :
StalkeR 周期:箭头周期,数字越大,信号越少
spread : 将使用以点为单位的点差值来计算面板上的盈利和亏损
止损 ATR x : atr 乘法中的止损值
止盈 ATR x : atr 乘法中的 TP 值
ATR period : 用于计算 tp 和 sl 的 atr 周期
TP/SL 线颜色和宽度
箭头颜色和宽度
面板/仪表板位置。
警报/电子邮件/通知

该产品旨在根据您的经纪商服务器的时区显示 15 个国家的交易时段,并根据您所需的设置提供各种显示模式,以防止图表拥塞,并可以根据用户所需的时间设置时段。
外汇市场上的太阳永远不会落下,但它的节奏随着不同交易时段的节拍而舞动。了解这些交易时段、它们的重叠部分以及它们独特的氛围对于任何想要跟随市场而不是对抗市场的外汇交易者来说至关重要。
Tokyo China London Canada New York Moscow Saudi Arabia ... USDJPY *** *
***
AUDJPY ***
NZDUSD *
***
EURAUD
**
GBPUSD
***
***
EURCHF
***
USDCHF
*
***
GBPJPY *** *** EURUSD *** *** US
市场轻松指标
市场轻松指标是一个允许交易者在单个屏幕上方便地切换不同货币对的工具。这个专家顾问(EA)集成了多个功能,使交易者分析变得更加简便,包括市场会话、点差和ATR。
使用市场轻松指标,您可以轻松交易而无需打开多个选项卡,使您的图表屏幕更清晰,更有利于分析。
更多顶级EA和指标: https://www.mql5.com/en/users/lothimailoan/seller
主要特点:
1. 一键打开不同货币对的图表 该指标可以配置为设置货币对并使用单击打开图表。您不再需要反复打开市场监视选项卡。
2. 自动绘制市场会话 该指标将使用可自定义的彩色框绘制亚洲、伦敦和纽约的时间框。这个功能使您更容易识别市场活动的价格区域,有助于更轻松地做出交易决策。
3. 自动计算当前点差 该指标会自动计算市场上所有货币对的点差,并默认在右上角显示。这有助于您轻松确定当前货币对的点差。
4. 自动计算当前ATR(平均真实范围) 该指标会自动计算市场上所有货币对的ATR,并默认在右上角显示。这有助于轻松了解当前货币对的ATR,使设置止损(SL)和获利(TP)变得
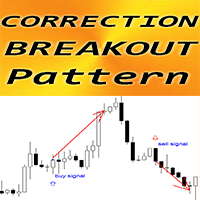
MT4 外汇指标“修正突破模式”
“修正突破模式”指标对于价格行为交易来说是非常强大的指标:无需重绘,无延迟; 价格修正后,指标检测看涨和看跌突破柱: 看涨修正突破模式 - 图表上的蓝色箭头信号(见图) 看跌修正突破模式 - 图表上的红色箭头信号(见图) 带有 PC、手机和电子邮件警报 指标“修正突破模式”非常适合与支撑/阻力位结合使用 ............................................................................................................. // 这里提供更多优秀的 EA 交易和指标: https://www.mql5.com/en/users/def1380/seller 它是仅在该 MQL5 网站上提供的原创产品。
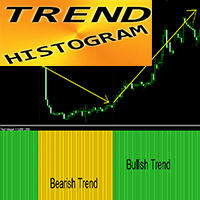
MT4 的外汇指标“趋势直方图”
趋势柱状图指标比任何标准 MA 交叉更加灵敏和高效 指标有 2 种颜色:黄色(金色)代表看跌趋势,绿色代表看涨趋势(颜色可以在设置中更改) 趋势直方图内置移动和 PC 警报 将此指标与任何其他交易方法结合起来是个好主意:价格行为、VSA、其他指标 ............................................................................................................. // 这里提供更多优秀的 EA 交易和指标: https://www.mql5.com/en/users/def1380/seller 它是仅在该 MQL5 网站上提供的原创产品。

O Touch VWAP é um indicador que permite calcular uma Média Ponderada por Volume (VWAP) apenas apertando a tecla 'w' no seu teclado e após clicando no candle do qual deseja realizar o calculo, clicando abaixo do candle é calculada a VWAP baseado na minima dos preços com o volume, clicando sobre o corpo do candle é calculado uma VWAP sobre o preço medio com o volume e clicando acima do candle é calculado uma VWAP baseado na máxima dos preços com o volume, voce tambem tem a opção de remover a VWAP
FREE

The ICT Unicorn Model indicator highlights the presence of "unicorn" patterns on the user's chart which is derived from the lectures of "The Inner Circle Trader" (ICT) .
Detected patterns are followed by targets with a distance controlled by the user.
USAGE (image 2) At its core, the ICT Unicorn Model relies on two popular concepts, Fair Value Gaps and Breaker Blocks. This combination highlights a future area of support/resistance.
A Bullish Unicorn Pattern consists ou

This indicator plots in the candles the divergence found in the selected indicator and can also send a notification by email and / or to the cell phone.
Works on all TIMEFRAMES. Meet Our Products
He identifies the divergences in the indicators:
Relative Strength Index (RSI); Moving Average Convergence and Divergence (MACD); Volume Balance (OBV) and;. iStochastic Stochastic Oscillator (STOCHASTIC).
It is possible to choose the amplitude for checking the divergence and the indicator has
FREE

BreakHarmony Multi-Timeframe Breakout Indicator for MT4
The BreakHarmony Multi-Timeframe Breakout Indicator for MT4 is a highly advanced tool providing information on breakout points across different timeframes, aiding traders in decision-making and understanding market movements. [ Features and Manual | MT5 version | All Products ] The indicator tracks breakout points on price charts across 6 timeframes. Breakout prices are indicated with the closing price of the corresponding candl

Subscribe to the 'MA7 Trading' channel to receive notifications about new programs, updates and other information. Ask questions in the profile on the MQL5 .
Description of work
The 'MA7 Agave' indicator is based on the standard Average Directional Movement Index (ADX) indicator. Shows the intersection of the +DI and -DI lines. Detailed information about the 'MA7 Agave' indicator.
Indicator settings
General settings: ADX period - Average Directional Movement Index indicator period.
'MA7

This is one of the most popular and highly rated volatility index (VIX) indicators on the market. It provides the same readings as the VIX does for stock indexes. However, this indicator works across all asset classes. VIX Fix Finds Market Bottoms. This indicator is not for inexperienced traders. Use it for day and swing trading. MT5 Version - https://www.mql5.com/en/market/product/112284
Bernard Baruch summed it out best: "Markets fluctuate." The Chicago Board Options Exchange (CBOE) Vola
FREE
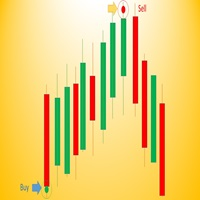
Wave Entry Alerts In Gold is a custom indicator developed by Azad Gorgis for MetaTrader 4. This indicator is designed to provide alerts based on ZigZag patterns, specifically tailored for trading on the Gold (XAU/USD) symbol.
Key Features: - Chart Window Indicator: The indicator is designed to be displayed on the main chart window. - Arrow Signals: The indicator generates arrow signals on the chart, indicating potential reversal points based on ZigZag patterns. - Customizable Parameters: Trad
FREE

Информационный индикатор, показывающий самые важные торговые уровни для внутридневной торговли, и не только. О понятии уровней «Поддержка» и «Сопротивление».
Всем известно, что исторический ценовой диапазон цен состоит из уровней от которых в прошлом, были значимые движения.
И уровни работающие в прошлом, наверняка будут работать и сейчас. К примеру, уровень, находящийся снизу текущей цены
является уровнем «Поддержки», если от него ранее было значительное движение. К примеру, уровень,

Intro to APAMI, PROfessional edition Trace exactly how far prices trend between two price levels with fractional pip precision, while qualifying price movement between the same price levels.
Completely automate when trends change direction and volatility, without any lag . This is possible because the Accurate Price Action Measurement Indicator (APAMI) actually does what no other indicator can: measure price distance between two points and simultaneously qualify the price action that occurs

Preface: First of all, let me introduce myself. I am a programmer and have been working for over 20 years. 2023 has passed, and our studio has achieved a record of 500 times with 7 manual transmissions. Below, we will show you how to do it through a series of operations. The first step is to model. Modeling is to find a fixed trading pattern. I think everyone has heard of a 2/8 probability, and through this probability, we can further refine it, which means that 1 to 4 is the optimal state. We h

This indicator is based on chart with specialty in volume, it clearly shows where the buying and selling force.
Note on images:
Settings and adjustments to the colors you prefer.
Being able to see the price that the market is at at the exact moment.
Able to accept more indicators in the same window, such as Bollinger Bands, Ma, Stochastic, MACD and many others that adapt to your best configuration.
SEEDER_Volume1 Mt4 indicator can be used on all types of charts, including RENKO c

Product Name: BicsOut - The Ultimate MT4 Breakout Indicator Introducing BicsOut, the indispensable tool for MT4 traders seeking precision in detecting breakouts across any currency pairs. BicsOut is meticulously designed to streamline your trading experience, providing automatic identification of breakout opportunities coupled with seamless entry and exit point calculations. Features: Breakout Detection: BicsOut excels in swiftly pinpointing breakout moments, enabling traders to capitalize on ma
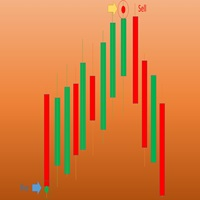
Wave Entry Alerts Oil is a custom indicator developed by Azad Gorgis for MetaTrader 4. This indicator is designed to provide alerts based on ZigZag patterns, specifically tailored for trading on the Oil (XIT/USD) symbol.
Key Features: - Chart Window Indicator: The indicator is designed to be displayed on the main chart window. - Arrow Signals: The indicator generates arrow signals on the chart, indicating potential reversal points based on ZigZag patterns. - Customizable Parameters: Traders c
FREE
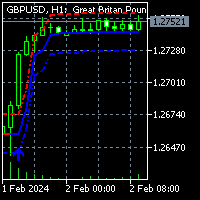
To get access to MT5 version please click here . This is the exact conversion from TradingView: "HalfTrend" by "Everget". This is a light-load processing indicator. This is a non-repaint indicator. Buffers are available for processing in EAs. All input fields are available. You can message in private chat for further changes you need. Thanks for downloading

RaysFX StochRSI Presentiamo un indicatore MQL4 sviluppato da RaysFX, un rinomato sviluppatore nel campo del trading algoritmico. Questo indicatore è una combinazione semplice ma potente di due indicatori popolari: RSI e Stocastico. Caratteristiche principali: RSI : Un indicatore di momentum che misura la velocità e il cambiamento dei movimenti dei prezzi. Stocastico : Un indicatore di momentum che confronta il prezzo di chiusura di un titolo con la gamma dei suoi prezzi durante un certo periodo
FREE

O Chart Control é um indicador que permite de forma rapida e pratica alterar o timeframe e ativo do grafico, possibilitando que voce possa fazer todas as suas analises em apenas um grafico sem precisar abrir vários, além disso voce pode escolher o entre os temas claro e escuro para o qual melhor se adapta a sua preferencia.
MT5: https://www.mql5.com/pt/market/product/109444
FREE

RaysFX Strategy è un sofisticato strumento di trading che genera segnali di ACQUISTO e VENDITA basati su una combinazione di quattro indicatori tecnici: 3 SMA (Simple Moving Average), 1 StochasticRSI , 1 Choppy, e 1 DeMarker. Only M1 TimeFrame! **Segnale di VENDITA**
Quando la candela precedente è sotto i 3 SMA, sopra il livello 80 dello Stochastic, sotto il livello 38 del Choppy e sopra il livello 0.3 del DeMarker, l'indicatore genera un segnale di VENDITA, rappresentato da una freccia rossa.

Introduction The Commodity Channel Index, commonly known as the CCI, is a versatile indicator used by traders and investors to identify cyclical trends in commodities, stocks, and other securities. It was developed by Donald Lambert in 1980, primarily for commodity trading, but has since found widespread application in various financial markets. The CCI is particularly favored for its ability to gauge overbought and oversold levels in price movements. Historical Background Donald Lambert, the

Calculate your account's consistency rule in one click! Works for all HFT Prop Firms: - Nova Funding - Infinity Forex Funds - KortanaFx - Next Step Funded - Quantec And many more! --------------------------------------------------- Settings: profitConsistencyPercentage = Max profit limit per order (%) according to your prop firm. lowerRangePercentage - Lowest range for lot size (%) according to your prop firm. upperRangePercentage - Upper range for lot size (%) according to your prop firm.
--

经过7年的时间,我决定免费发布一些我自己的指标和EA。
如果您觉得它们有用,请 通过五星评级表达支持!您的反馈将继续带来免费工具! 也查看我的其他免费工具 这里
_________________________________ %B 指标用于外汇交易高级分析 %B 指标在 MQL4 中巧妙编写,是一款旨在改变外汇分析方式的动态工具 。通过利用布林带的强大功能,为市场趋势和交易机会提供准确及时的洞察。 主要特点: 精确计算 : 使用公式 %B = (当前价格 - 下带) / (上带 - 下带) 进行深入市场分析。 市场洞察 : 有效识别超买 (>100) 和超卖 (<0) 条件,为市场反转提供早期信号。 趋势分析 : 帮助交易者判断市场趋势的强度,约 50 的值表明市场平衡。 发现差异 ️: 标记价格运动与 %B 值之间的差异,这是潜在趋势变化的关键指标。 无论您是经验丰富的交易者还是刚开始入行,%B 指标都是您工具箱中不可或缺的增补 。其设计用户友好,提供清晰、可操作的数据以指导您的交易决策。 想了解更多关于该指标的信息,请
FREE

经过7年的时间,我决定免费发布一些我自己的指标和EA。
如果您觉得它们有用,请 通过五星评级表达支持!您的反馈将继续带来免费工具! 也查看我的其他免费工具 这里
_________________________________ 波林格带宽度指标——高级市场波动性分析工具 在MQL4中精心开发的波林格带宽度指标,是一款先进的工具,旨在提升外汇交易分析的水平。它利用波林格带测量波动性的能力,为交易者提供关于市场动态和潜在交易场景的关键洞见。 喜欢这个免费指标吗?请用五星评价来表示支持!您的反馈是我们提供免费工具的动力! 主要特点: 精准波动性测量 : 计算波林格带宽度(上带 - 下带)/ 中带,准确评估市场波动性。 市场状况洞见 : 识别战略性交易所需的高波动性(潜在突破)和低波动性(市场整合)时期。 全面趋势背景 : 加强对市场趋势的理解,较宽的带表明更大的波动性和潜在趋势强度。 与交易策略集成 ️: 作为各种交易策略的有价值组成部分,尤其是与其他指标结合时,用于细致分析。 使用和信号解读: 设置 ️: 轻松将波
FREE

After 7 years I decided to release some of my own indicators and EAs for free.
If you find them useful please Show support with a 5-star rating! Your feedback keeps the free tools coming! See other my free tools as well here
_________________________________ Volume Moving Average (Volume MA) Indicator for Advanced Forex Market Analysis Introducing the Volume Moving Average (Volume MA) Indicator, meticulously developed in MQL4, a pivotal tool for enhancing your forex trading str
FREE

经过7年的时间,我决定免费发布一些我自己的指标和EA。
如果您觉得它们有用,请 通过五星评级表达支持!您的反馈将继续带来免费工具! 也查看我的其他免费工具 这里
_________________________________ 日内强度指数(III)——精准外汇交易分析工具 精心开发的 MQL4 日内强度指数是一个尖端工具,旨在增强外汇交易分析。该指标采用独特的方法分析基于日内价格变动的资金流动,为交易提供深入的买卖压力分析。 主要特点: 高级分析 : 采用公式 [(2 × 收盘价 - 最高价 - 最低价) / (最高价 - 最低价)] × 成交量,全面展示市场动态。 市场动能 : 准确衡量日内买卖动力,对理解短期市场运动至关重要。 趋势识别 : 帮助发现潜在的趋势反转和市场强度,对及时决策至关重要。 以量衡量的洞察 ️: 整合成交量数据,提供比仅基于价格的指标更细致的视角。 使用和信号解读: 设置 ️: 轻松将 III 指标集成到您的 MetaTrader 4 平台中。根据您的具体交易策略调整设置。 日内分析 : 持续
FREE
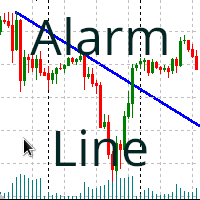
趋势线突破警报 描述: 该指标在价格突破趋势线时触发警报(声音、 警报或通知), 无论是在上方还是下方。 参数: Names of the trendlines. : 趋势线的名称, 用逗号分隔(确保您的趋势线名称开头没有空格且准确)。 Value over/under the line (E.g.: 0.03% or 500 pips). : 在触发警报之前定义趋势线上下方范围的值, 可以根据以下参数以百分比或点数给出。 Use value in percentage or pips? :定义前一个参数是按百分比还是按点数给出的。 2nd bar? :True, 当有两根柱高于或低于趋势线时触发警报。 Play sound? (Bug!) :True, 通过扬声器播放声音(有一个罕见的错误, 正在分析中)。 Send Notification? :True, 将通知发送到 Options>Notifications 中配置的移动设备。 Display alert? :True, 在终端上显示警报。 Color line, value is above it. : 当值高于趋势线时线的
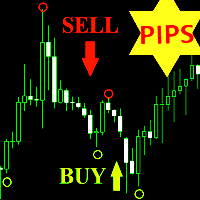
Pips Scalper Indicator - is a forex trading indicator specially designed for traders who are interested in scalping strategy. Scalping is a trading strategy in which a trader attempts to make a positive trade by snippets of small price movements. How to use the indicator? When the indicator draws a green circle on the chart of the currency pair, we open a buy deal and set a short TakeProfit of 20-25 points. In 87% of the signals, the price will go at least 20 pips in the direction of the arrow.

MCDX Pro is based on Buyer and Seller Volume analysis . Buyer also known as Banker is represented by GREEN BAR Seller also known as Retailer is represented by RED BAR The indicator is showing STACKED BAT representing BANKER (Green) and RETAILER (Red) activities Height of GREEN bar > 50% means Bull is in control while RED bar > 50% means Bear is in control. DARKER GREEN COLOR - STRONG BANKER - Active Buying Activity LIGHTER GREEN COLOR - STRONG Down - Weak Buying (Pullbac

What if God Created a Trade System? No miracles... Just see how mathematics can be effective in the market. We managed to combine technical analysis / price action into indicators, creating the best setup for trading, be it in Forex, Indices, or stocks. It took us 2 years to create something that really works, and now it's time for you to discover it. TrendX3 is a revolution in trend analysis. Based on advanced algorithms and real-time data, it provides valuable insights so that you can make inf

What if you could see trouble from far, just imagine having some ability to foresee danger. This indicator has the ability to see consolidations before they are clear to everyone else. In the market everything is always fun until the market starts consolidating and often times by the time people realise it it's often too late. This Indicator will spot consolidations very fast and let you know at the top right of the chart so that you can either avoid losses by stopping to trade using trend follo

If you are curious about the position of the stochastic, RSI, CCI curve, whether it is at the OBOS level or not, then this trading tool is for you. Introducing the advanced trading tools of 2024. ATF Trend Following Trend Bar OBOS. This indicator is similar to MTF PPAAF Model S but have two layers. Click here to learn more about MTF PPAAFS . This trading tool is equipped with various powerful features : MTF = Multi Time Frame = Time Frame can be changed. On/off button. Customizable parameter,
MetaTrader市场是一个简单方便的网站,在这里开发者可以出售自己的交易应用程序。
我们将帮助您发布您的产品,并向您解释如何为市场准备您的产品描述。市场上所有的应用程序都是加密保护并且只能在买家的电脑上运行。非法拷贝是不可能的。
您错过了交易机会:
- 免费交易应用程序
- 8,000+信号可供复制
- 探索金融市场的经济新闻
注册
登录