适用于MetaTrader 4的新技术指标 - 113

The ARIMA Trend Forecaster indicator is designed for analyzing and forecasting the trend component of a financial instrument based on the integrated ARIMA autoregressive model. The ARIMA methodology aims at identifying the presence of unit roots and the order of time series integration. In financial markets, autoregressive models are used for working with price time series to predict future price points. The ARIMA Trend Forecaster indicator using all the advantages of the ARIMA method allows to
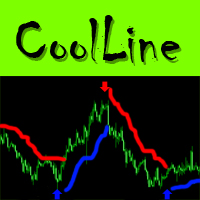
CoolLine is a signal indicator displaying on a chart points for opening and closing trade positions. The indicator signals are not redrawn. It draws arrows on the zero bar Open[0]. It works on all currency pairs and all time frames.
Indicator Advantages Precisely shows the opening and closing points on the chart Does not redraw signals Works on all currency pairs and timeframes Very easy to use; suitable even for beginners Has a very flexible system of settings Can send push and email notifica
The RSI S-RoC indicator differs from the standard RSI in that it takes into account the price rate of change when calculating values. When the price moves in a trend, the indicator produces good entry signals oncethe price touches its levels. The level values can be configured in the indicator settings. They can also be modified and adjusted directly in the indicator window. You can also set on a chart signal lines. Once they are crossed, the indicator will produce a sound alert or play a user

The indicator uses the Envelopes channel in its calculations, which allows working with dynamic support and resistance levels. It also considers the direction and strength of the trend, as well as the mathematical calculation that determines the percent range of the price channel, which is generally formed at the time of the accumulation of positions. It first generates a preliminary signal in the form of a round arrow. Then it is necessary to wait for a normal arrow and enter the market only af

The Master Figures indicator analyzed the market for the most common chart patterns. The first pattern is called Pin bar . This pattern can rightly be considered one of the most widespread. This pattern looks like a candle with a small body and large tail (wick). Once you see it on the chart, open a position against the wick. It is better to use the resistance lines for closing. Master Figures shows this pattern in the form of circles. A position should be opened when a new candle appears after

The indicator is designed for determining Fibonacci levels. Does not repaint/redraw The blue level shows the zero Fibonacci value (it is also the Pivot level) Red levels show calculated Fibonacci levels (used as a rollback or reversal point) Automatic period detection (periods can be entered manually) Adjustable display calculation method. Settings BarsHistory - the number of bars to be used to display the indicator. Method - method of calculation. AutoPeriod - automated period calculation (true

The TrendsAssistantMt4 indicator is shown in a separate window in the form of rhombi of different colors: red rhombi indicate a drop in the price, green ones signify a growth. Two rhombi of the same color in a row serve as the trade signals. The indicator should be attached to a chart of any timeframe and any trading symbol.
Parameters Per - period for calculation. The greater the period the longer the indicator is calculated and the less the number of false signals.

BinaryIndicator is a highly accurate indicator for trading binary options. It shows excellent results in scalping. This indicator is based in multifactor analysis of trend indicators, as well as confirmation oscillators, which in the end gives an increased accuracy of signals.
Advantages of the indicator Increased accuracy of signals. Excellent results when trading binary options with a short expiration time from M30 to M1 . It works on any timeframes. Works with any trade symbols.
Parameter

This oscillator is smooth as the name implies. It also shows hidden divergence arrows. The indicator also has multi timeframe features to make it very flexible to use. The multi time frame features can be adjusted as follows: 1 or M1, 5 or M5, 15 or M15, 30 or M30, 60 or H1, 240 or H4, 1440 or D1, 10080 or W1.
Indicator parameters Timeframe - When set to 0, works on the current timeframe. Draw Divergence arrows - If set to True allows divergence lines to be drawn. Display Alert - If set to Tru

The product is based on a number of standard indicators. It shows strong trends on large timeframes – H4 (recommended) and higher. I recommend using confirming indicators on lower timeframes for trading. The product works on any symbols. Low volatility symbols are recommended.

Extract Candle Power 是一种实时交易量提取器指标,可提供有关每根蜡烛期间买卖双方行为的宝贵见解。通过分析交易量数据,交易者可以就市场趋势和潜在逆转做出更明智的决策,超越传统移动平均线指标的能力。 这个强大的工具允许您提取和分析当前蜡烛的买卖双方交易量,并将其与之前蜡烛的交易量进行比较。该信息对于了解交易者当前在市场中的定位至关重要。此外,您可以通过将实时蜡烛的交易量与移动平均线进行比较,轻松识别潜在的反转点。 Extract Candle Power 指标用途广泛,适用于所有时间范围和任何货币对。它提供了准确的见解,并且在更高的时间范围内使用时尤其有价值。无论您有特定的交易策略还是更喜欢适应不同的时间框架,该指标都可以根据您的需要进行定制。 该指标还提供了一系列附加信息和参数,可增强您的交易体验。您可以访问详细信息,例如经纪人的服务器时间、买家和卖家的交易量百分比、蜡烛交易量、买入价和卖出价、价差、当日最高价和最低价、掉期利率、杠杆、保证金、净值、利润和余额。 通过可自定义的显示参数,包括颜色选择、字体选择和大小选项,您可以个性化指示器的外观以满足您的喜好。信息面板

Renko True 该指标在常规报价图表的背景下以矩形(“砖块”)的形式显示价格变化。价格的向上移动(按设置中指定的点数)通过在前一个下一个矩形上方相加和向下移动 - 在前一个矩形下方相加来标记。 该指标旨在直观地识别主要趋势。用于确定关键支撑位和阻力位,因为它平均了潜在趋势。此视图不考虑小的价格波动(“噪音”),这使您可以专注于真正显着的变动。 仅当价格变动超过指定的阈值水平时,才会绘制高于或低于新的指标值。其大小在设置中设置并且始终相同。例如,如果基数为 10 点,而价格上涨了 20,则将绘制 2 个指标值。 该指标的优点是任何砖块都可以显示其形成时间的持续时间。如果价格在一定范围内波动,没有上涨和下跌的门槛值,那么砖将一直保持价格不变。 指标设置说明 单元格 - 矩形(砖块)的阈值级别或高度,以磅为单位(例如,10 磅)。 RenkoPrice - 基于构建指标的价格,High_Low - 最大和最小价格值,_Close - 基于收盘价。 Draw - 绘制指标读数的样式:LINE - 简单线,HISTOGRAM - 直方图,ARROW - 以十字符号的形式,ZIGZAG
Market Scanner Elite is a new generation of indicators of the Market Scanner series. The Elite version features an improved market analysis algorithm, with a better identification of the entry points and filtering of the false signals. The logic of market analysis and calculation of effective entry points applied in this product are significantly different from those applied in Market Scanner . This indicator cannot be called a big brother, as it is a completely new product with innovative analy
FREE

The indicator displays on a chart trading results. You can configure the color and font of displayed results, as well as filter trades based on the magic number. If multiple trades were closed within one bar of the current timeframe, the result is summed and output in one value.
Utility parameters Plot profit in - the format of output results: wither in deposit currency taking onto account commission and swap, or in points. Start from - start processing data at the specified time. Plot last de
FREE

The Candle Patterns indicator provides a visual display of candlestick patterns. There are more than 100 patterns that can be displayed. The indicator allows for candles on the chart to be grouped and considered as one candle. This allows the price action within a candle to be observed in the context of a candlestick pattern. The number of bars per candle can be set in the parameters. All patterns can be filtered so that only patterns with certain attributes are displayed. The prior trend is tak

HeatMap MT4 allows traders to see inside the charts. This indicator plots congestion zones over a certain period of time, known as "Lookback", by analyzing thousand of variables simultaneously. These spots act like strong supports and resistances and now are easy to see. HeatMap MT4 works with all timeframes and all instruments.
Settings Computations - define whether the algorithm works continuously or only at the opening of each candle (default: New Candle). Lookback in Bars - define the peri

Magic Pivot is a professional indicator for finding the support and resistance lines; it has been developed by a group of professional traders. The indicator plots three support lines and three resistance lines, where a price reversal is highly probable. Magic Pivot is an excellent tool for scalping and intraday trading. Advantages
High accuracy of signals. Suitable for scalping and intraday trading. The indicator does not redraw. Simple indicator setup, minimum parameters. Works on any finan

指標顯示最大和最小手數,以及交易品種的價差大小。
為了獲得快速而豐厚的利潤,需要使用此信息來根據最大存款快速做出進入市場的決策。它是根據可用資金和開設一個手數的資金計算的。
當您參加各種外匯競賽或以最大可能的方式交易市場時,以及在波動性增加或減少期間獲得快速且豐厚的利潤時,通常會發生這種情況。
該指示器連接到工具窗口後,立即顯示您所需的信息。如果需要在工具窗口中更改字體大小或替換信息,則可以在指示器設置中執行此操作(請參見屏幕截圖)。
Fontsize-字體大小; Xdistance-相對於錨定角的X坐標距離(以像素為單位); Ydistance-以像素為單位的Y坐標相對於錨定角度的距離。 有關作者產品的其他信息……
FREE

This is a multi-currency author strategy, designed for trading on the M1, M5, M15, М30, Н1, Н4. Entry points are calculated using custom formulas and algorithms that allow you to effectively determine current trend in the market, obtain the entry points (buy/sell) and the optimal levels to close orders. The Cosmic Diviner Scalper System indicator can be used on any Forex pairs. The detailed guide on how to use the indicator is provided in the blog: https://www.mql5.com/en/blogs/post/719602 A hug
The 'HLOC Cross' was created to show crosses of historical highs & lows Key Features This indicator looks for a custom pattern of 3 bars with a bars filter. There are many visual options available to choose from (bar count). Non-repainting trendlines & arrows: arrows either at bar 0 or bar 1.
Input Parameters Bar Count = 3000 - all bars on chart or only a select few bars displayed. Bar Buffer = 1 - pattern taken from selected bar, minimum is bar 1. Lines Visible = true - trendlines displaye

Variable Index Dynamic Average (VIDYA) is an original method of calculating the Exponential Moving Average (EMA) with the dynamically changing period of averaging, developed by Tushar Chande. The length of period in VIDYA depends on market volatility as indicated by the Chande Momentum Oscillator (CMO).
Typical Signals VIDYA generates buy and sell signals when the price crosses over and under the bands: When the price crosses over the upper band of VIDYA, this can be interpreted as a signal to
FREE
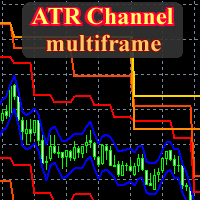
This is a fully multitimeframe version of the ATR Channel standard indicator, which works for any combination of timeframes. The indicator allows viewing price channels from different timeframes in one window, and they will always be displayed in a correct time scale. You can create and set of intervals and freely switch to a higher or lower one. Please note: in the " From Median Price " display mode, it is easy to identify reversal points at intersections of levels from higher timeframes by lev

SkyNet EMA is an indicator will assist you by suggesting when to go long or short based on price action and the crossings of Exponential Moving Averages such as 14 period and 50 period. Just attach it to your chart and it will monitor the asset for potential sell opportunities and if found will paint a red arrow in your chart. Also will try to find buy opportunities and if found will paint a green arrow in your chart. It could be used with any currency but majors are recommended since they will
FREE

This indicator is designed to detect the best of all candlestick reversal patterns: Three Line Strike . According to the bestselling author and candlestick guru Thomas Bullkowski, this pattern has a winning percentage between 65% and 84% . This indicator scans for you up to 30 instruments (forex, indices or commodities) on up to 8 timeframes. You can get alerts via MetaTrader 4 and email if a Three Line Strike pattern occurs. Please note: Higher timeframes bring the most reliable signals. This i
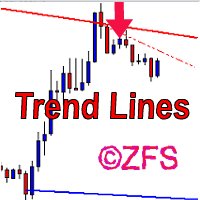
The indicator draws channels. The estimated movement of the price within the channel is shown with a dotted line. The lines of the channel are the support and resistance lines. This allows using them in both rebound and breakout trading. The inclination of the channel allows determining the direction of the current trend, the channel width and angle allow estimating the current volatility. The channels are based on fractal bars, determined using the author's original method, 4 dimensions from th

Extremum Search is designed to search for extremes, places where the price is likely to reverse and the current trend is likely to change to the opposite. With certain settings, the indicator can be used to define the current trend. The indicator works with any symbol provided that you have sufficient history data for a timeframe the indicator is launched at. It is recommended to attach Extremum Search on the timeframes from M1 to D1. Its calculations use 19 methods, which are selected by a cert

Determining the current trend is one of the most important tasks for a trader regardless of their trading style. Trend Scan is able to define a trend with a fairly high accuracy. The indicator applies the proprietary method in its calculations. Trend Scan is suitable for any currency pair and timeframe. It does not change its readings. The indicator takes into account the volume and volatility readings, combines them and displays the result as a histogram. The color of the histogram can be confi
The Bollinger R (Bollinger Reversals) is designed to recognize short term high profitable counter trend patterns from the chart. This system combines both Bollinger Bands and mean reversion to define positions where the market could potentially reverse direction. Description Bollinger Bands are well known in the trading community. General concept with Bollinger method is selling when the price touches the upper band and buying when the price touches the lower band. Even though it works perfectly
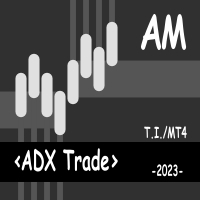
The indicator allows you to simplify the interpretation of signals produced by the classical ADX indicator. The position of the thick bars of the histogram relative to zero and the histogram coloring indicate the direction of price movement determined by the intersection of DI+ / DI-. The position of the thin bars of the histogram relative to zero and the color indicate the strength of the price movement. A buy signal is generated when the price moves above the high of the last fully formed bar
FREE

A must-have tool for any strategy based on divergence detection. 10 different oscillators can be used to detect divergences and can be combined with Double Top/Bottom patterns to confirm reversal signals. SCANNER is included . Now with Scanner you can find trading opportunities and setups easily and faster.
Features Easily detect strong reversal signals. 10 different oscillators are available for divergence detection. Divergence & Top/Bottom detection can operate independently or combined. Get
ADX is one of the indicators most commonly used by traders. This version allows to extract the maximum amount of information without hassle of constantly switching between the timeframes and, thereby, greatly simplifies working with it. This is a standard ADX indicator provided with an info panel displaying the current relative position of -DM and +DM lines on all timeframes. Blue circle - uptrend. Red circle - downtrend. Yellow circle - no trend. Blue arrow - (+DM) > (-DM); Red arrow - (-DM) >

Brabux is a ready-made mechanical trading system. It works on all currency pairs and timeframes automatically adjusting to them. It also selects the most efficient trading parameters for receiving a necessary profit. In the indicator parameters, specify the trading period used for calculations and the least acceptable profit in points. Next, the system automatically selects the necessary trading parameters. Trading data is displayed on the info panel. After setting the indicator on the chart and

The Complex Fibonacci indicator automatically plots Fibonacci levels on all timeframes. When new extremes appear on the chart, Fibonacci lines are automatically updated in real time.
Indicator parameters Period for H1 - specify period for H1; Period for H4 - specify period for H4; Period for D1 - specify period for D1; Period for W1 - specify period for W1; Period for MN - specify period for MN; Lines name - enter the names for the lines here; Lines color - the color of the lines.

This indicator displays the trend movements.
Parameters XRMultiplier1: XR multiplier 1. XRMultiplier2: XR multiplier 2. Line1: line 1 movement (true/false). Line2: line 2 movement (true/false). XRTrend: XR trend displays Line 1 and Line 2 movements (true/false). X: move the trend left and right. Y: move the trend up and down. How to understand the status: If the Line is green, trend is up. If the Line is red, trend is down.
ScalperMulti is a multicurrency indicator for professional traders. The indicator shows the complete market situation for the trader. The main advantage of this indicator is that it simultaneously analyzes six major currency pairs on all timeframes from M1 to MN. The indicator analyzes the trend strength. The indicator generates color-coded signals to visualize the market situation: Green - ascending trend. Red - descending trend. Yellow - trend is not defined. The indicator is excellent for sca
The BinarySignalMt4 indicator has been created for trading short-term binary options. The indicator shows excellent results when trading binary options with a short expiration time. The main advantage of this indicator is the high accuracy of signals. The frequency of the indicator signals depends on the selected timeframe (the signal is generated no more than once a minute on M1, no more than once in five minutes on M5, and so on). The indicator should be attached to a chart of any timeframe an
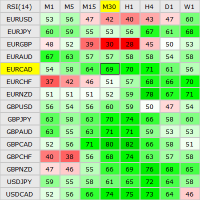
This indicator shows the current RSI values for multiple symbols and multiple timeframes and allows you to switch between timeframes and symbols with one click directly from the matrix. With this indicator, you can analyze large number of symbols across multiple timeframes and detect the strongest trends in just a few seconds.
Features Shows RSI values for multiple symbols and timeframes simultaneously. Colored cells with progressive color intensity depending on the RSI values. Ability to chan

Are you tired of plotting fibonacci retracements or extensions manually? This indicator displays fibonacci retracements or extensions automatically, calculated from two different price points, without human intervention or manual object anchoring. [ Installation Guide | Update Guide | Troubleshooting | FAQ | All Products ] Easy to use Manual anchoring is not needed Perfect for price confluence studies The indicator evaluates if retracements or extensions are needed Once drawn, you can manually
FREE

The BuySellArrows is a seemingly simple and very persistent indicator. All traders had come across indicators that contain numerous input parameters that will change Buy and Sell position when you change those parameters value. Many traders asked what parameter's value will be more accurate. So, I decided to make an universal indicator without any input parameters. In this case you will have very stable indicators without any worries that you put some wrong numbers. This indicator will show Buy

Harrow Band is an indicator based on support and resistance values. This indicator provides six bands that indicate the nearest of support or resistance position. With this indicator, it will be easier to see where entry and exit points of a trade are located.
Pairs and Timeframes This indicator can be used in any pairs and timeframes, but it is recommended to use it in XAUUSD H1.
Parameters NumCandle - number of candles used to calculate the support and resistance position. BandColor - colo
FREE

We-Trend MT4 indicator made by the We-Trading team is designed to study supports, resistances and trend filters. We-Trend is the tool that works also as a trend filter on all major trading strategies. We-Trend write for you horizontal lines (supports or resistances) on all timeframes.
UP Trend, Down and FLAT The We-Trend helps to understand the direction of the trend. Red or Green Horizontal lines show supports and resistances Trend comment show the main trend of the current TimeFrame, and oth

这个指标显示了3条移动平均线之间的交叉,有快速、中速、慢速3条MA线。当快速FastMA向上穿越中速middleMA与中速middleMA向上穿越慢速slowMA,发出多头报警。当快速FastMA向下穿越中速middleMA与中速middleMA向下穿越慢速slowMA,发出空头报警。其中三线交叉包含了三线交叉于一个点的特例;当FastMA(MA1) 向下穿越middleMA(MA2),发出报警提示关闭多单,当FastMA(MA1) 向上穿越middleMA(MA2),发出报警提示关闭空单。
输入参数 快速MA设置 MAPeriod1 = 5 - 快速平均线周期. MAMethod1 = EMA - 移动平均线类型(SMA, EMA, SMMA, LWMA). MAPriceType1 = Close - 价格类型 (Close,Open, Low, High, Median, Typical, Weighted). 中速MA设置 MAPeriod2 = 20 - 中速平均线周期. MAMethod2 = EMA - 移动平均线类型 (SMA, EMA, SMMA, LWMA).
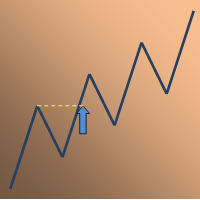
This is a functional extension of the ZigZagLW4 indicator. It detects the beginning of a new trend signaling of a new indicator line shoulder of a specified level. This is a stand-alone indicator, which means you do not need the activated ZigZagLW4 indicator for correct operation.
Algorithm logic To understand the logic of the indicator, let's take a look at the screenshots consistently displaying the conditions for the signals formation. The chart has ZigZagLW4 indicator with the Short_term a

The Supertrend Line indicator shows you the trend using calculation based on the ATR.
How does it work? The Supertrend draws a line following the current trend, this line is the result of calculation made with the ATR. A Line under the candle means a likely bullish trend A Line above the candle means a likely bearish trend
How to trade with CSL indicator Buy when the Supertrend line is below the price, Sell when the Supertrend line is above the price. It is strongly suggested to use this ind
FREE
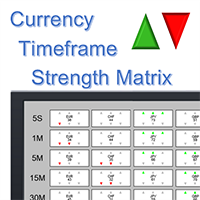
What is it? The Currency TimeFrame Strength Matrix is a simple and comprehensive Forex map that gives a snapshot of what is happening in the Forex market at the very present time. It illustrates the strength and momentum characteristics of each single currency (AUD, CAD, CHF, EUR, GBP, JPY, NZD, USD) with respect to different time frames (5 seconds, 1m, 5m, 15, 30m, 1h, 4h, 1d) independently. The most unique visualization, encompassing multi currency, multi time frame and multi trend analyses al

Biwavelet is an indicator for harmonic forecast of the market based on one-dimensional wavelet transform functions. Wavelet transforms are one of the main tools of digital algorithmic trading. This is due to their ability to analyze and predict processes occurring in two independent basic dimensions - price and time. Wavelets have significant advantages over the Fourier transform, because wavelet transform allows evaluating not only the frequency spectrum of the price signal, but also the time a

The system resembles the Italian flag and is simple for ordinary people to understand. Any trader with any experience will be able to use it. The Italy trading system generates 3 types of market conditions. Green zone - consider only buy trades. Red zone - consider only sell trades. Empty zone - flat, do nothing. Buy signal: Green zone + a blue arrow appears. Close all positions when an opposite signal (arrow) appears. Sell signal: Red zone + a red arrow appears. Close all positions when an oppo

The Percent Pivot indicator is a simple indicator that calculates the main percentage values. The graphical layout makes it very similar to the traditional pivot but its internal computing system is unique and irreplaceable. Every day, the market creates new bullish or bearish rates. This indicator help you to identify possible supports or resistance levels. The main values such as 0.25% and 0.50% are good reference points to use as potential target or reversal levels. This indicator has been de

The indicator builds the ranges of the probable price movement according to the specified timeframe. The range is built starting from the Open level of the specified timeframe and extended to the timeframe's Close, shifting relative to the extremes. The upper boundary is laid from the minimum and moves only downward when the Low is updated. The lower border is laid from the maximum and rises only when the High is updated. When the price approaches the range boundaries, the probability of movemen

HLC Bar indicator is a market analysis tool. Unlike standard bar chart (Open-High-Low-Close), this indicator shows High-Low-Close prices only. Therefore, trader would focus on key elements of price action. It's very easy to use, no complicated setting, apply to any financial instrument, like Forex, CFD etc. Just open symbol chart, load indicator then enjoy.
Yoga is an efficient indicator for binary options trading. It is designed for use in the MetaTrader 4 terminals. The indicator can be used on M5, M15, M30, H1 with the expiration of 1 candlestick. The indicator is not intended for timeframes above H1. If you try to switch to H4 or higher, the indicator will show a message requesting to return to a lower timeframe. The indicator is equipped with an audible and visual alert, and generates entry signals. The indicator also sends email and push noti

The LexusBO indicator is recommended for trading binary options . Signals are generated when the RSI, ADX, CCI indicators cross the customizable levels. The indicator displays signals using "up/down" arrows on the chart. Their values are available in the buffer arrays (buffer with index 0 - "up" arrow, with index 1 - "down" arrow). This makes the indicator easy to use for automated trading through specialized Expert Advisors. The recommended timeframe is M5. The indicator has a built-in counter
FREE
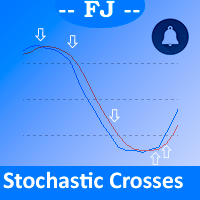
This indicator is intended to solve all kind of lines K and D crosses to generate different alerts when needed, and multicolored K line.
Features You can define an Stochastic as you could do on MetaTrader native Stochastic indicator, all the parameters are copied to get it. You can show all the K and D lines crosses You can select from all the K and D crosses only those that accomplish a minimum angle to filter crosses that aren't made with enough strength You can generate alerts when Oversold

Laguerre SuperTrend Clouds adds an Adaptive Laguerre averaging algorithm and alerts to the widely popular SuperTrend indicator. As the name suggests, Laguerre SuperTrend Clouds (LSC) is a trending indicator which works best in trendy (not choppy) markets. The SuperTrend is an extremely popular indicator for intraday and daily trading, and can be used on any timeframe. Incorporating Laguerre's equation to this can facilitate more robust trend detection and smoother filters. The LSC uses the impro

True Choppiness Direction determines if the market is choppy (trading sideways) or if it is trending, as well as the trend direction and strength (green=up, red=down, grey=no trend) . The underlying algorithm is designed to detect trend movements even in the presence of noisy market data, please see screenshots. Trend strength is indicated by taller or shorter red/green fill. Choppiness index is range-bound between -50 (very trendy) and +50 (very choppy). This is a custom algorithm designed by u
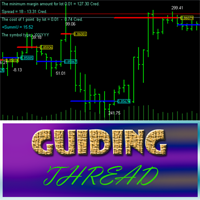
Guiding Thread is based on the standard RSI with a customizable period. The market entry signal is triggered after the indicator crosses a certain level. The event is marked by an appropriate line (blue - going long, red - going short) and the price label having the appropriate color . In other words, if the previous signal was for going short (red line and price label), the next one indicates the upcoming reversal and the necessity to go long (blue line and price label). A trading signal is pre

目前八折优惠!
对任何新手或专家交易者来说都是最好的解决方案!
这个仪表板软件适用于28种货币对。它基于我们的两个主要指标(高级货币强度28和高级货币冲动)。它对整个外汇市场提供了一个伟大的概述。它显示高级货币强度值,货币运动速度和28个外汇对在所有(9)时间段的信号。想象一下,当你可以使用图表上的单一指标观察整个市场,以确定趋势和或剥头皮的机会时,你的交易将得到改善
我们已经在这个指标中建立了一些功能,使你更容易识别强势和弱势货币,同时识别和确认潜在的交易。该指标以图形方式显示货币的强势或弱势是增加还是减少,以及它在所有时间段的表现。
增加的新功能是动态市场斐波那契水平,它适应当前的市场条件变化,这是一个已经在我们的高级货币强度28和高级货币冲动指标中使用的成熟的加分项。
在交易时,总是将弱势货币和强势货币配对,这个新指标将帮助你做到这一点。
用户手册:点击这里 https://www.mql5.com/en/blogs/post/708783
特点 显示每个时间段的ACS28和GAP-speed(冲动)的货币强度值。 列:颜色代码以7种颜色

Scalper Zoom is a new trading system designed to facilitate the process of Forex trading both for beginners and professionals. The Scalper Zoom indicator uses an adaptive method of operation and analyzes the market using multiple trading algorithms, while selecting the most efficient one for the given currency pair and timeframe. Working with this indicator is very simple. When a red vertical line appears, open a sell order. Close it when a blue vertical line appears. Follow the opposite steps f

This is a unique multi-currency trading strategy developed for trading on H1 timeframe, which allows you to determine the global market entry points and obtain the maximum profit for each transaction. The market entry point is calculated using a variety of author equations and algorithms. We recommend using the indicator simultaneously on several trading instruments . A huge advantage of Big Deals System is an information panel in which the user can see the current information on potential entry
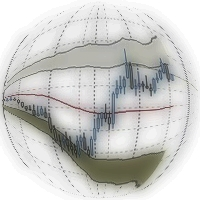
Double Bollinger Bands is a method of following a trend. Two deviation at the time with fill color between them, ideal for traders who like visual style of trading.
Parameters Length - сenter averaging period line length. Deviation 1 - number of standard deviations from the main line 1. Deviation 2 - number of standard deviations from the main line 2. Color - optional.

The Pivot Point indicator automatically calculates and displays the pivot point line and support and resistance levels. Pivot can be calculated according to the Classic, Floor, Fibonacci, Woodie, Camarilla or DeMark formula. It is also possible to select the period for calculating the indicator. A trader can choose from daily, weekly, monthly, or user-defined periods.
Types of pivots Classic Floor Fibonacci Woodie Camarilla DeMark
Main features The indicator shows the current and histor
FREE
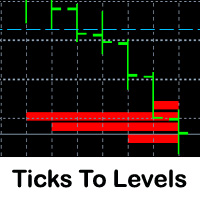
This indicator counts ticks and graphically displays the price levels, on which the greatest number of them was detected. Thus, it sufficiently accurately determines the levels of support and resistance. The indicator will be useful for traders who trade breakout or scalping strategies.
Features Technical analysis provides several ways for finding levels of support and resistance. Ticks to Levels provides another, fairly accurate, way of determining these levels empirically. The criterion for

The Fibonacci indicator automatically displays the Fibonacci retracement levels, representing significant support and resistance. The range for calculating the indicator can be taken from the previous day, week, month, year or user-specified session.
Levels 100 % (High) of the range from the previous session. 0 % (Low) of the range from the previous session. 76,4 % of the range from the previous session. 61,8 % of the range from the previous session. 50 % of the range from the previo
FREE

This is an arrow indicator for binary options. It does not redraw, arrows do not disappear. The indicator implements an optional tester for visual monitoring of the number of signal and win rate. Does not require adjustment or fitting. Works on all pairs and gold. The signal appears at the close of a candle. Entry is made on the next bar. Optional alert. For trading with robots, there is a setting for the number of bars in history. If 0, the entire history is used. The EA operation time: 24/5 Wo

Algo Candle is a very good indicator that permits to see, through the candle color, the strength of the algorithmic study chosen. In input you can choose your favorite algorithmic calculations such as: RSI, Vortex, MACD, Momentum, Stochastic and ATR. The candles are colored based on the levels of the chosen indicator. This indicator eliminates too many oscillators or indicators on your charts and gives you very useful information. Algo Candle is an excellent operating ally, allowing you to get m

MetaTrader 5 version available here: https://www.mql5.com/en/market/product/25794 FFx Pivot SR Suite PRO is a complete suite for support and resistance levels. Support and Resistance are the most used levels in all kinds of trading. Can be used to find reversal trend, to set targets and stop, etc.
The indicator is fully flexible directly from the chart 4 periods to choose for the calculation: 4Hours, Daily, Weekly and Monthly 4 formulas to choose for the calculation: Classic, Camarilla, Fibona

The indicator trades during horizontal channel breakthroughs. It searches for prices exceeding extreme points or bouncing back, monitors night flat and defines targets using customizable Fibo levels with a sound alert, which can be disabled if necessary. The indicator allows you to create a horizontal channel between the necessary extreme points in visual mode quickly and easily. It automatically applies your selected Fibo levels to these extreme points (if the appropriate option is enabled in t

Camarilla Pivots Historical plots the historical data of the camarilla pivot point levels on the chart. The Camarilla Pivot levels was originated in 1989 by Nick Scott. The levels are used as primary support and resistance levels by Intraday traders. The levels are calculated with the following formula: R4 = C + RANGE * 1.1/2 R3 = C + RANGE * 1.1/4 R2 = C + RANGE * 1.1/6 R1 = C + RANGE * 1.1/12 PP = (HIGH + LOW + CLOSE) / 3 S1 = C - RANGE * 1.1/12 S2 = C - RANGE * 1.1/6 S3 = C - RANGE * 1.1/4 S4
FREE
Call/Put Ratio is one of the most well-known indicators of the market sentiment. The indicator has been developed by Martin Zweig. It is based on real volumes of the CBOE option market. As we know, a Call option gives its owner the right to buy the underlying asset at a predetermined price. A Put option gives the right to sell it. Thus, increasing volumes for Call options indicate the increasing demand. The growth of Put option volumes shows that supply starts exceeding demand. If we divide the

One of the biggest problems you will face as trader is finding the right system for myself. AMD Exclusive Two can constitute a complete system for you. Don’t follow the arrows, without thinking twice. Trading using a whole system. What we have? Automatic optimization Overbalance (manual, semi-automatic and automatic) Main and additional signals Fibonacci Pivot Linear Regression Channel Mini Tester Early warning system (yellow cloud on the chart) 3D effect
Button On Chart Button [Start] - Star
MetaTrader市场是 出售自动交易和技术指标的最好地方。
您只需要以一个有吸引力的设计和良好的描述为MetaTrader平台开发应用程序。我们将为您解释如何在市场发布您的产品将它提供给数以百万计的MetaTrader用户。
您错过了交易机会:
- 免费交易应用程序
- 8,000+信号可供复制
- 探索金融市场的经济新闻
注册
登录