适用于MetaTrader 4的新技术指标 - 82
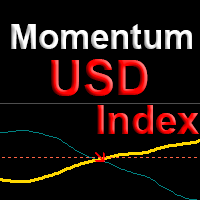
The indicator shows points for the continuation of the trend for currency pairs with the participation of the USD dollar with a probability of more than 80%. The algorithm is based on comparing the momentum of the current currency pair with the momentum of the DX dollar index at the current time. Using the dollar index allows us to evaluate not only the current pair, but the entire picture for all major currencies at once. This approach increases the reliability and reduces the number of false p
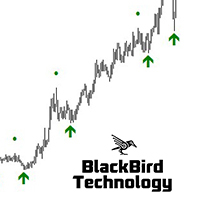
Multi Level Trend Swing is an indicator that identifies the most accurate buy/sell swing points with the highest probability, based on multi-level Zig Zag Swings. The indicator paints arrows at the Higher Highs, Higher Lows, Lower Lows and Higher Lows in the chart, but based on two level Zig Zag Swing. If the fast price swing is in line with the trend of the slow price swing, then the buy/sell arrows are biggest. If the price swing is against the trend, dots are displayed to signal a Higher High

TREND MATE is an useful indicator that will support your decision to trade according to the current trend. It is possible to configure alert and push notification to receive when entering to first candle for bull / bear trend. If you want to use this indicator for a EA, use the function iCustom as follows:
DOWNTREND : iCustom(NULL,0,"Trend_Mate",0,0) . If downtrend result is "1", otherwise is "0".
UPTREND : iCustom(NULL,0,"Trend_Mate",1,0) . If uptrend result is "1", otherwise is "0".
Fo
FREE

Stochastic BR allows you to recognize reversals professionally. The "Stochastic BR" is designed to recognize profitable counter trend patterns from your chart. Stochastic Indicator: This technical indicator was developed by George Lane more than 50 years ago. The reason why this indicator survived for so many years is because it continues to show consistent signals even in these current times. The Stochastic indicator is a momentum indicator that shows you how strong or weak the current trend
Moving Averages Of ATR This indicator shows you Average of Average true Range. You can use this indicator for your own experts with iCustom() ATR is in the buffer ( 0 ) and moving average is in the buffer ( 1 ) there are afew parameters for using this indicator on different currencies and different time frames. you can test it and optimize it . Input Parameters: ATRPeriod: default is 13 SignalMaPeriod : default is 28 SignalMAMode : default is SSMA

Nexxt Indicator This indicator shows you trend and also how strenght it is together. You can use this indicator for your own experts with iCustom() BlueBuffer is in the buffer ( 0 ) and GoldBuffer is in the buffer ( 1 ) there are afew parameters for using this indicator on different currencies and different time frames. Best Results are in M15 , H1 and H4 ( depends on currencies ) you can test it and optimize it . Input Parameters: Nexxt1: default is 7 Nexxt2: default is 14

Nexxt2 Indicator This indicator shows you trend and also how strenght it is together. You can use this indicator for your own experts with iCustom() BlueBuffer is in the buffer ( 0 ) and GoldBuffer is in the buffer ( 1 ) Strategy can be like this; Blue and Gold cross till Blue touch to level 1 or -1. These levels show us must be ready close position. It depends on you. there are afew parameters for using this indicator on different currencies and different time frames. Best Results are in H4 (

This EA is an extension for the free trade indicator Trend Mate . https://www.mql5.com/en/market/product/50082
The main idea is to support your decision to trade according to the current trend. It is possible to configure alert and push notification to receive when entering to first candle for bull / bear trend.
For this extension of the free indicator now it is possible to filter the current trend info with other timeframes. For example show trend for timeframe M5 considering also timefra
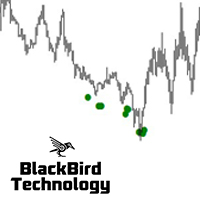
Multi MA Distance Signal Indicator is a no-nonsense, no delay, no repaint indicator ! Moving Average distance together with a trend filter is a 'simple', but very powerful and reliable signal. The current moving average distance for both a slow and a fast moving average is compared with the past MAD values. For two moving averages, all the distances between the Close price and the moving average (MAD) over a selected period of time are compared with the current MAD "Moving Average Distance". If

Fibonacci fast drawing tool with 4 outstanding features 1. Quick action by clicking on the candle 2. Draw the bottom of the selection exactly 3. Include Standard Fibo levels and display prices at levels 4. Draw extended fibo to identify the price zone after break out
Please see video clip below for more details. Free download link of FiboCandleClick indicator inside youtube.

1、能显示货币之间的强弱 0是最弱 7是最强 2、能显示28个货币以及黄金 原油的 涨跌幅度 3、能切换货币对 4、能显示持仓订单的货币对 1、能显示货币之间的强弱 0是最弱 7是最强 2、能显示28个货币以及黄金 原油的 涨跌幅度 3、能切换货币对 4、能显示持仓订单的货币对 5、能利用键盘的的上下键切换货币对,左右键切换周期 1、能显示货币之间的强弱 0是最弱 7是最强 2、能显示28个货币以及黄金 原油的 涨跌幅度 3、能切换货币对 4、能显示持仓订单的货币对 5、能利用键盘的的上下键切换货币对,左右键切换周期 5、能利用键盘的的上下键切换货币对,左右键切换周期 1、能显示货币之间的强弱 0是最弱 7是最强 2、能显示28个货币以及黄金 原油的 涨跌幅度 3、能切换货币对 4、能显示持仓订单的货币对 5、能利用键盘的的上下键切换货币对,左右键切换周期
FREE
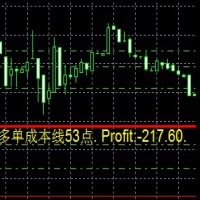
Dies ist ein Indikator
Dies ist ein Indikator, der immer die Auftragskosten und die Rentabilität in Echtzeit widerspiegelt
Besonders wenn es auf die Martin-Strategie angewendet wird, ist es bequemer 这是一个指标
这是一个时时反应订单成本 和实时 盈利值得 指标
尤其应用于 马丁策略的时候 更加方便 This is an indicator
This is an indicator that always reflects the order cost and real-time profitability
Especially when applied to the Martin strategy, it is more convenient
FREE

This is a Multi-Time-Frame Zigzag indicator You can change parameters of Zigzag, include Zigzag Depth, Zigzag Deviation, Zigzag Backstep. You can choose which Time Frame to display Zigzag by turn ShowXXX to true or false (ShowXXX = ShowM1, ShowM5, ShowM15...). Noted: Lower Time Frame Zigzag will not display on Higher Time Frame. Example: Your current Time Frame is H1, you can not see Zigzag of M1 to M30 even you turn them on.
Whatever you are expert class Forex trader or not, you must know how to make correlation analysis between different timeframes of the same symbol, and furthermore between different symbol. Now, open one or several symbols with different timeframes, apply this smart multi-timeframe mapping tool, drag and move the vertical anchor line to the destination bar position. Then you will see the correlation of Forex market clearly. Supports multiple timeframes synchronization and multiple symbols synchro
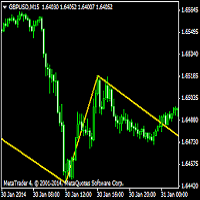
The Zig Zag indicator plots points on the chart whenever prices reverse by a percentage greater than a pre-chosen variable. Straight lines are then drawn, connecting these points. The indicator is used to help identify price trends. It eliminates random price fluctuations and attempts to show trend changes. L'indicateur Zig Zag peut être utilisé pour filtrer les mouvements de prix ... 1 Minute Indicators Used: RSI (30 / 70) Fibonacci (1 - 0.784)

THIS IS DEFINITELY THE BEST INDICATOR ON THE MARKET Please book an appointment on our facebook page (www.facebook.com/wetrainfx)
Fantastic for scalping, swing trading and Intra-day tradering Arrows show direction ! You also get an early warning that a move is about to happen.
Mobile and desktop alerts.
Effective on any traded pair
Effective on any timeframe.
Perfect for new and old traders
THIS IS THE MT4 VERSION.
HOW TO USE 1. Open a few charts in 15min TF. 2.

你缺乏成为专业人士的优势。
按照一步一步的系统,检测最强大的动作!
研究市场模型,让您有机会根据经过验证和测试的策略赚取可观的利润。
利用你的重要优势 您可以访问一个独特的指标,将带您到一个新的水平!
在私人信息中写下所有问题!
你得到的好处 基于价格变动的独特算法。 与任何交易策略完美结合。 自动检测波浪和趋势。 信号是严格在"关闭酒吧"。 它适用于所有符号和时间框架。 与自动交易(EA)完全兼容。 该指标分析了先前价格走势的强度。
基于此,指示器显示一个黄色条以指示入口点。
进入是在第二根柱上做的,这是趋势运动的逆转.
111111111111111111111111111111111111111111111111111
FREE

MACD shì zuì shòu huānyíng de dòngliàng hé qūshì zhǐbiāo zhī yī. Huòbì qiángdù jì yěshì jīyú duō zhǒng huòbì de qūshì zhǐbiāo. MACD huòbì qiángdù jì shì jùyǒu MACD hé huòbì qiángdù jìsuàn fǎ de dān túbiǎo zhǐbiāo. Tā hái jùyǒu yī jiàn shì gōngnéng, qízhōng 28 gè zhǔyào hé cì yào duì xiǎnshì zài nín de yíbiǎo bǎn shàng, tōngguò dān jī mǒu gè duì, nín de túbiǎo jiāng zìdòng gēnggǎi wèi nín xuǎnzé de túbiǎo. Chǎnpǐn yōushì lùzhì de guānyú rúhé shǐyòng zhǐbiāo dì wǎngluò yántǎo huì wánzhěng de zījī

注意:外 汇交易员 “ 获得一个图表指标,它将使您在市场上交易时赚更多的钱 …… 。 ” 是 ! 我已 经准备好赚更多的钱,简化交易,并且对实时的市场状况有一个轻松的了解! 面 对现实吧,在外汇交易平台上交易似乎很复杂,压力很大,很困惑!如果没有正确的系统和指标指 南, 图表可能会变得压倒性和混乱。当您想知道是否会因为市场分析不正确而再次被市场灼伤时,消除您的胃部结痛感。 那 “ 交易者区 ” 呢?每个交易者都可以 轻易陷入的一个陷阱,就是在大赢或大输之后,令人恐惧的 “ 交易者区 ” 。您将能 够在大获胜之后复制同样的成功,或者在大亏损之后陷入另一个财务陷阱?出色的钓鱼指示器指南可帮助避免此问题,并减轻压力和焦虑。 “ 呈 现最终的外汇直观技术指标 ” 简单易用的颜色指示器!市场上的其他指标因 BIG“ 学 习曲线 ” 而 变得复杂,难以使用和理解。我们的指标使用简单,带有清晰的颜色指标,可帮助您快 速有效地了解市 场状况。我们计划的关键是简单性和有效性。 钓鱼指标开始使用颜色编码的指标来计算市场方向的波动。它学习并分析市场趋势,并显示运动之间的距离和距离

这个多时间框架和多品种指标识别分形模式。作为奖励,它还可以扫描抛物线 SAR (pSAR) 趋势变化。结合您自己的规则和技术,该指标将允许您创建(或增强)您自己的强大系统。 特征
可以同时监控您的市场报价窗口中可见的所有交易品种。仅将指标应用于一张图表并立即监控整个市场。 可以监控从 M1 到 MN 的每个时间范围,并在识别出模式或趋势变化时向您发送实时警报。支持所有 Metatrader 原生警报类型。 可以使用 RSI 和/或移动平均线作为趋势过滤器来正确识别潜在的逆转。 该指示器包括一个交互式面板。当单击一个项目时,将打开一个带有相关代码和时间范围的新图表。 该指标将信号写入一个文本文件,智能交易系统 (EA) 可以使用该文件进行自动交易。比如 这个产品 。 您可以在博客中 找到有关文本文件的内容和位置的更多信息。
输入参数
输入参数的描述和解释可以在 这里 找到。 重要的
请注意,由于具有多功能性,既不会在安装指标的图表上绘制买卖建议,也不会绘制线条和箭头。图表上将绘制一个显示分形图案的箭头,点击面板中的信号即可打开图表。 我建议您将指标放在干净(空)图表上,不
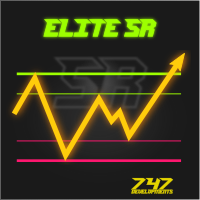
Elite SR - Advanced Level Indicator for automatic detection of support and resistance levels with different degree of credibility should become a part of your trading arsenal. This indicator is accessible via iCustom function and provides level values as well as their degree of credibility. Elite SR is fully adjustable and can work on any time-frame with any trading instrument!
Important information For all detailed information about this indicator you can visit 747Developments website.
Feat

TWO SYMBOLS CORRELATION line indicator It compares the power/strength lines of two user input symbols and create a SMOOTHED line that indicates the degree of deviation of the 2 symbols Strategy#1- FOLLOW THE INDICATOR THICK LINE when CROSSING O LEVEL DOWN --- TRADE ON INDICATOR THICK LINE (TREND FRIENDLY) !! Strategy#2- TRADE INDICATOR PEAKS (Follow indicator Reversal PEAKS Levels)!! you input - the index of calculation ( 10/20/30....) - the indicator Drawing start point (ind

This indicator is only working in M1 period.it is predicting end of horizantal trend by using envolepes indicator. After takeprofit predicted, this indicator will open 4 orders as buy and sell. One of the order is market type, others are limit type. There are 25.5 and 70 pips range between these limit type orders. After market type order reach its target other limit orders will be deleted automatically. Note that this system is not martingale, this system is creating limit order. T

El MACD ponderado, tiene las mismas caraterísticas del MACD simple, sólo que la diferencia es que se usan medias móviles ponderadas (LWMA) en lugar de simples (SMA) o exponenciales (EMA). Dibuja histograma. Dibuja una línea principal. Es especialmente útil para detectar divergencias alcistas y divergencias bajistas. También es muy útil para detectar divergencias alcistas y divergencias bajistas ocultas.
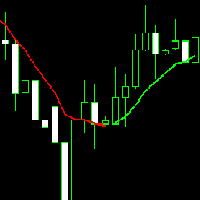
Linear Weighted Moving Average o Media Móvil Ponderada Lineal, es una media móvil que calcula los promedios de manera ponderada. Esta versión, además de las características regulares que poseen las demás Linear Weighted Moving Average o Medias Móviles Ponderadas Lineales, tiene también la propiedad de cambiar de color según las preferencias del usuario; puedes elegir un color para cuando la media móvil sea alcista y otro color cuando la media móvil sea bajista, o de lo contrario se puede elegir
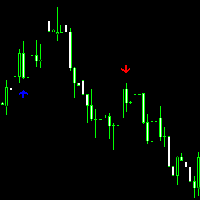
Este es un indicador que te avisa mediante flechas, cuando las medias móviles ponderadas (LWMA) de los periodos que hayas elegido, se crucen entre sí. Puedes elegir el color que quieras para cada una de las flechas, incluso puedes elegir un sólo color para las dos flechas. Cuando hay un cruce de medias alcista, sale una flecha hacia arriba, y cuando hay un cruce de medias bajista, sale una flecha hacia abajo. Como comenté al inicio, también puedes elegir el periodo de cada media móvil ponderada

Symbols Strength meter Graph :::: It is programmed to work on any M5 Chat windows !! Used to determine the Strongest currency pairs and the Weakest pairs also detect the peak of deviation of currencies strength IT CAN BE USED FOR INDICES AND STOCKS TOO !! Strategy one : It can be used in to BUY Strongest pair and SELL Weakest one Strategy two: It can be used on Daily basis to Hedge BUY Strongest pair with high % (ex: +1%) and BUY Weakest one with % lower(ex: -0.7%) the same with SELL Strateg

The Trend Change indicator allows you to use the moving average to indicate to the trader a change in the direction of the trend movement. This is a modified indicator, the advantage of which is the ability to keep up with rapid changes in price dynamics in the presence of excellent SMA smoothing over the period. I recommend the standard indicator settings. Apply on a timeframe not lower than M30
Average Directional Movement Index Technical Indicator (ADX) helps to determine if there is a price trend. It was developed and described in detail by Welles Wilder in his book "New concepts in technical trading systems". This ADX Signal Scanner will search in Market Watch for a good Entry Point on the chart on every Time frame interval. You can set it to view back shifted signals with custom ADX period, levels and more.

Often when we trade we want to look at our previous historical trades so we can analyze the situation and think about how can we proceed in the future. With this instrument we can visualize our previous buy and sell trades. After we load the indicator on our favourite chart we can go to the “Account History” section, right click and choose the whole history to take all the transactions from the server. Then we can select the things that we need to navigate through the chart.
The relative strength index (RSI) is a momentum indicator used in technical analysis that measures the magnitude of a recent price changes to evaluate overbought or oversold conditions in the price of a stock or other asset. This instrument will scan every major and minor currency pairs on every timeframe to see if they’re overbought or oversold. After the information is displayed on the list simply select the signal and navigate it to the chart by pressing the “GO” button.The RSI Signal Scanner

PROMOÇÃO LIMITADA, NA COMPRA DE 1 INDICADOR VOCÊ LEVA CLUBINARIAS 6.0 , 5.1 e DonForex DE BRINDE!! ATÉ FINAL DO MÊS!
-NA HORA DA COMPRA SELECIONAR COMBINAR COM O VENDEDOR OU BUSCAR PESSOALMENTE, A ENTREGA É DIGITAL EM POUCOS SEGUNDOS
==> VEJA O VIDEO PARA TIRAR AS SUAS DUVIDAS <==
==> VÍDEO OPERANDO NO YOUTUBE
ROBÔ FEITO COM MUITO ESFORÇO E CARINHO E QUE ESTA TRAZENDO
ÓTIMOS LUCROS
APESAR DE EXISTIREM PESSOAS QUE APENAS VENDEM ROBÔS FAKES DE OPERAÇÕES , ACREDITO QUE SERIA M

The ' Average Bar Chart ' indicator was created to showcase the traditional Heiken Ashi calculation as an exotic charting style. This indicator is known for reducing chart noise for a smoother price action. A dditional indicators are recommended
Key Features Candlesticks for OHLC are removed from the chart. Average bars may be shown as complete bars without tails. All functionality and features of this exotic chart are inputs.
Input Parameters Chart Timeframe = PERIOD_CURRENT; - period to s
FREE

This system never paints. This system created by using Envolpes bands and reverse bar count. This indicator is only working in M5 period. This system is for long term and profitable. Signals are shown as arrows. as an optional limit orders. You can set a voice alarm or email notification. You can fins our other products from link : https://www.mql5.com/en/users/drbastem/seller Also, you can ask all your questins from email : haskayafx@gmail.com or mobile : +90 530 867 5076 or @Meh
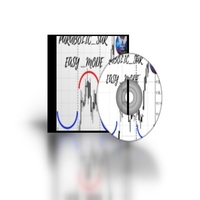
Parabolic Sar easy mode, remake the original p.sar indicator making it more easy to read for novicians traders and experimented traders looking to reduce the time analizing the charts, you can make your own strategy modificating the periods and fusioning it with others indicators like RSI ,stochastic or what you want,its one indicator runs better on high time charts like H4 or D1.
FREE

SYMBOL POWER based on inputted 5 time frames and Compared to 20 Other Symbols !! Great Indicator YOU DON'T HAVE TO SHIFT ON ALL TIME FRAMES FOR EACH CURRENCY PAIR TO CONCLUDE ITS TREND AND ITS POWER YOU HAVE IT ALL IN ONE TABLE , 20 CURRENCY PAIR WITH 5 TIME FRAMES ALSO , COMPARE BETWEEN CURRENCIES STRENGTH AND ALERTS THE STRONGER /WEAKER PAIR BASED ON 5 TIMEFRAMES CALCULATIONS ALEERTS enable /disable using 5 time frames M5 M30 H1 H4 and D1 ( latest version You SELECT you own 5 timeframes fr

ADX revolution its an revolutionary indicator, this one simplificate all the signals of convencional ADX indicator, analyzing the market more quickly and giving more colour to the entry signals, to gift you more time for trade and dont waste time analizing. Nice to meet you trader!, im from Argentina if you have any question please contact me by my email: despiertatutrader@gmail.com

Stochastic easy cross, its a simplificated version of original Stochastic indicator, its one its based on the cross of the main line and the signal line of the indicator,and when a cross ocurrs , a cross or a flower will be drawn , if a blue cross appear its one give us a buy signal, and if then is drawn a red cross its talk us about a sell signal, well this is all its really easy to use, any question please ask me to mi email see you! email: despiertatutrader@gmail.com

RSI orbes its an remake of the classic RSI indicator, it have the same but show it by a different way, if lvl 30 or lvl70 are crossed the RSI orbs will draw red orbs or blue green orbes,you can create your own strategy configuring the periods, also for sell when the red orbs appear or to buy when the green orbs its drawn, you can use it by your way, any question please ask to me to my email , good luck see you! email: despiertatutrader@gmail.com

Open time indicator 4 Major sessions. 1. Sydney is open 0h - 9h (GMT + 3) 4h - 13h (VN - GMT + 7) 2. Tokyo is open 3h - 12h (GMT + 3) 7h - 16h (VN - GMT + 7) 3. Lodon is open 10h - 19h (GMT + 3) 14h - 23h (VN - GMT + 7) 4. Newyork is open 15h - 24h (GMT + 3) 19h - 4h (VN - GMT + 7) Link download indicator KIDsEA Session Please come to my youtube for free download, please feel free for like and subscribe for my channel.

MACD Cross with additional features which conditions must met if there was set on 1. Stochastic Limit : Buy Above, Buy Below, Sell Above & Sell Below 2. RSI Limit: Buy Above, Buy Below, Sell Above & Sell Below 3. EMA Limit : Buy if EMA1 & EMA2 above EMA3, Sell if EMA1 & EMA2 below EMA3 It also can set whether show arrow and sound alert. MACD, RSI, Stohastic and EMA values can be changed according each user

Morning Stars points price reversals with high degree of accuracy and it is great for scalping on the 15 min time frame. Buy and sell arrows are shown on the chart as for entry signals. They do not repaint but confirmation entries .
*Non-Repainting *For Desktop MT4 Only *Great For Scalping *Great For Swing Trading *Arrow Entry Alerts *Arrow Signals alert Strictly On The "Close Of The Candle" *Works On 15Min Timeframe *Works On Any Mt4 Pair *Perfect For New Traders And Expert Traders

该指标建立了趋势线的扇形(在单击某个蜡烛之后),类似于经典的江恩角。该指标的特点是它不仅在固定比例上构建角度,而且还使用一定数量柱线的平均价格(可选)。
有两种方法可以计算指标中角度的平均价格(可选):
1) 计算从高到低的平均价格变动(对于一定数量的柱);
2) 计算从开盘到收盘的平均价格变动;
选项:
1.Method——构造角的方法;
2. FixedScale - 固定比例(如果在Method中选择了Fixed_Scale);
3. SecondaryAngles - 控制绘制次角的权限;
4. RayRight - 为趋势线设置射线;
5. DrawBackground - 画线作为背景;
6. AnglesQuantity——角度数;
7. Bars_To_Process - 周期,柱的数量,在此基础上确定平均价格,角度的“速度”。如果为零或更低,则根据所有历史数据计算;
8. RisingMainAnglesClr、RisingSecondaryAnglesClr、FallingMainAngle

The indicator draws support and resistance lines on an important part of the chart for making decisions. After the trend line appears, you can trade for a breakout or rebound from it, as well as place orders near it. Outdated trend lines are deleted automatically. Thus, we always deal with the most up-to-date lines. The indicator is not redrawn .
Settings:
Size_History - the size of the calculated history. Num_Candles_extremum - the number of candles on each side of the extremum. Type_Ar
Binary Trend System is a professional scalping indicator designed for trading binary options and Forex instruments. The indicator is based on Price Action patterns that are able to predict future price movement with a high probability. The alert system (alerts, email and push notifications) will help you to simultaneously monitor multiple trading instruments. Attach the indicator to a chart, and the alert will trigger once a signal emerges. With our alerting system, you will never miss a singl

Multi Strategies Combined Signal All in One Multi Strategies Single Combined Select from up to 6 Strategies solo or Combine different strategies for signal generation (Combining more than 2 strategies may LIMIT a lot the number of signals)! ALL inputs and Strategies selection From Chart !!! Also Inputs editing from Chart !!! Push your strategy bottom (one strategy) OR Combine signal from as may strategies (up to 6) : Selected and enabled strategies will be in GREEN !!! 1- BUY SELL areas 2-

The Professional Signal that A Swing / Daily / Scalping / Binary Options trader MUST HAVE ! Suitable For ALL kind of Financial Instruments (FX Currencies, Commodities, Indices, Stock CFDs and Crytocurrencies) For the last 12 years, Our team has studied on the price action of currency pairs and created an innovation of signal indicator based on the AI technology. Based on know-how of the professionals, we have designed a AI deep-learning model and tuned the model by learning fro

A signal indicator consisting of several well-known indicators that process data sequentially. 2 options - for schedule and basement. In the settings it is possible to enable alerts about the change of trend (alerts) sound, by e-mail and push. It is possible to change the colors and thickness of the lines, the colors and codes of the arrows, the number of calculation bars and separately configure the parameters included in the indicators.
FREE
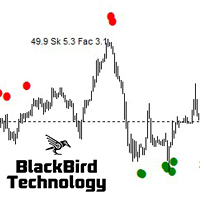
Dear Trader, this is one of the most powerful signals you will find in the market place. I worked many months to improve the accuracy. Check for yourself with the demo version. Parameters are set for EURUSD. I can assist you to configure it for any other symbol or TF. It can be configured to generate more of less in-trend or contra-trend signals. Extreme Swing Indicator is a no-nonsense, no delay, no repaint indicator ! It selects buy/sell entry signals based on a number of swing calculations a

P R I C E F O R C E A N A L Y Z E R This is a complex indicator that calculates the force of the price direction.
V E R Y I M P O R T A N T This is not a stand alone indicator. Use it together with your own strategy. This indicator only confirms your possible position. You can run it in any charts and timeframes but H1 is recommended. Make sure that the pair is volatile at the time of trading. If you don't have a solid volatility-based strategy ye
FREE

Indicator designed for binary options trading buy signals come along with hiding a new candle blue arrow on histogram buy signal red arrow on histogram sell signal buy worth 1 or 2 candles the signal appears with the opening of a new candle but may appear during its formation it’s worth entering the deal only when the signal has arrived at the opening, the signals do not disappear Recommended currency pairs: Any Timeframe: up to H1 You can customize the PERIOD parameter to your trading style Rec

FEATURES OF THE HELPTRADER TO ENTER THE MARKET INDICATOR ! four types of moving averages for building a channel; ! ability to select the width of the flat (Central MA) and the margin for the channel borders; ! four options for the display channel; ! three settings for the appearance of the arrow signal; !customizable notification system. The arrow channel indicator HelpTrader to Enter the Market, due to its variability, can become a fairly effective tool for trading in combination with other in

Reflector is an auxiliary tool for technical analysis, which helps to determine the direction of the trend: either upward or downward price movement on the selected trading instrument. The indicator is an indicator of a trend type; it smooths out price fluctuations during signal formation by averaging data. The indicator uses calculations designed to smooth out sharp fluctuations that do not affect the overall picture of price movement.
A trend can be increasing (bullish trend) and decreasing

Icebreaker trend indicator provides an opportunity to classify the direction of price movement, determining its strength. The solution to this problem helps to enter the market on time. You can not only see the direction of the trend but also the levels by which you can work.
The indicator determines the prevailing trend in the price chart. But not only, but also analyzes the price movement, and indicate the points of possible reversals. This contributes to the quick and optimal opening of bu

Term "shark" in the business world denotes a high volume investor who just made a good investment in a highly Potential business deal.So, sharks are the ones who make the market move. In our case, if an American shark bought a Japanese company, he/she has to convert American dollars into Japanese yen to make the deal. So, the demand for the Japanese yen will increase sharply. Thus USD/JPY will go short rapidly if the deal was from the shark. Another example, In the case of forex, if fed increa
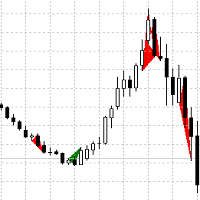
A trend indicator based on the definition of several types of candle combinations, the triangle formed is colored with the corresponding color, the red trend is down, the green one is up. Candlestick combinations of standard and non-standard types with additional conditions for their definition. The recommended timeframe is M30,H1,H4, D1. When combined with other trend indicators, it will provide more accurate points of entry and exit from the market (buying and selling).

A trading range takes place when a financial instrument (stocks, indices, bonds, commodities, Forex currencies or cryptocurrencies) oscillates between two upwards and downwards boundaries for a period of time. This Indicator tool help us to view range on the chart bar per bars, also set range in percent and get clean posicion. Range trading works best in the absence of a trend. When the markets lack a clear direction, that’s when these consolidation periods settle in. Alternatively, more exper

Liquidity Buy Sell Signal Indicator is a no-nonsense, no delay, no repaint indicator ! Liquidity pools together with a trend filter is the most powerful and reliable signal according to me (with the correct parameters depending on the timeframe used) It selects buy/sell entry signals based on liquidity in the market. The time range to scan for liquidity can be set in the parameters. Liquidity is an important aspect in the market, especially for institutional investors, as they need lots of liqu

Smart Psar its an strategy indicator, based on the strategy of parabolic sar and exponencial moving average of 30 periods, when them aim to a long trend, then a white arrow will spawn in the high of the candle and it will a draw a line to follow the trade near the candles , before a time when the conditions are gived ,then a close position signal will be appear like a white check,but also if them aim to a shoty trend, then the arrow will be turn yellow spawning in the low of the candle and it wi

This scanner shows the trend values of the indicator BillionaireTrend for up to 20 instruments and H4,H1,M15,M5 and M1 time frames. The scanner collects the trend signals of every timeframes (H4,H1,M15,M5,M1) from T rendBandMT4 indicator and also, generates daily signal under the considerations of like correlations of each timeframes,ATM rule and Fibonacci levels. Installation Note Before opening this indicator, the T rendBandMT4 indicator (upto version 2.8) should be installed and invoked on
FREE
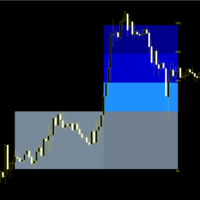
NO REPAINT The system combines several analytical techniques and presents BUY/SELL signals in an easy-to-read form. You don’t have to be a professional to use it. Conservative TP SL can make amazingly accurate market predictions by constantly auto-analyzing every price movement, trading patterns and with the help of complex trading algorithms. This indicator main task is to look for gravity zones and generate buy/sell signal with exact SL and TPs location. When specified conditions are fulf
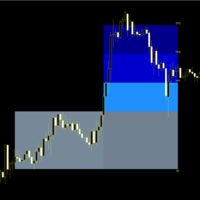
NO REPAINT The system combines several analytical techniques and presents BUY/SELL signals in an easy-to-read form. You don’t have to be a professional to use it. Aggressive TP SL can make amazingly accurate market predictions by constantly auto-analyzing every price movement, trading patterns and with the help of complex trading algorithms.
This indicator main task is to look for gravity zones and generate buy/sell signal with exact SL and TPs location. When specified conditions are ful

---> Check all the other products <---
The Multi Time Frame Chandelier Channel is a good synthesis of the chandelier trailing stop and let you analyze the trend.
Enter when the price breaks one of the two lines, then trail using the opposite line. Ideal for scalping, entering after the dot appears.
Plenty of customization: Choose the lookback period, the longer, the slower Choose the Time Frame to use (must be greater or equal your chart TF Play around with the options to get the
FREE

My Account Brokers Details This indicator displays the account data and broker terms regarding its operation. For example, broker name, account number, financial leverage, account currency, automatic trading approval, minimum lot, lot step, maximum number of lot, margin call, stop out and many other important data. It is easier to display such data on the chart in one moment with a click of the mouse, than to look for it in the contract or call the broker.
FREE

The Stock Exchange One Sessions Hours version 2.00
This indicator facilitates observing the currency pair's quotations during subsequent parts of the stock exchange session live. Before the session starts, a rectangle is drawn on the chart but not filled in with color. It means the extent of the session duration. Before the first bar enters the rectangle of the session, a sound signal or pop-up window will notify us that the session will just start. When the price graph crosses the edge of th
FREE

Standart MACD indicator but All parameters can be changed for users. Extern Inputs: FastMA method : Simple, Exponential, Smoothed and Linear Weighted FastMA Price : Close, Open, Low, High, Median, Typical and Weighted FastMA count : Default is 12 SlowMA Method : Simple, Exponential, Smoothed and Linear Weighted SlowMA Price : Close, Open, Low, High, Median, Typical and Weighted SlowMA Count : Default is 26 Draw Mode : Line or Histogram SignalMA Method : Simple, Exponential,

Email and push notification Alert This is very powerful tool to get Detailed view of all of your trading on same spot. it can send 2 types of alerts, Email Alerts Push Notification
1: Email Alert email alerts are consist of 4 sections Section 1 includes Account number and name details Section 2 includes Account Balance Equity and Floating Profit/Loss details. Section 3 includes Pair wise Profit and loss Section 4 includes Pair wise+Order wise Detailed view of all trades. its includes numbers
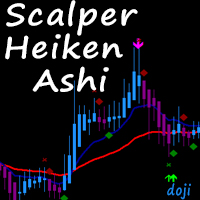
There are several types of Patterns, We choose Doji that is used for continuation and trend reversals.
Signal types : #1 Premium Signal- ---------------- Doji should have the colour of the expected direction change along with normal candle colour matching direction.
#2 Secondary Signal ---------------- Doji has the perfect formation however the bar maybe in the same colour as the previous bar but the candle colour has new direction colour.
Stochastics-Filter: ---------------- The Stoc

---> Check all the other products <---
The Multi Time Frame Chandelier Channel is a good synthesis of the chandelier trailing stop and let you analyze the trend.
Enter when the price breaks one of the two lines, then trail using the opposite line. Ideal for scalping, entering after the dot appears.
Plenty of customization: Choose the lookback period, the longer, the slower Choose the Time Frame to use (must be greater or equal your chart TF Play around with the options to get the

Moving Average of Momentum This indicator shows you trend and also how strenght it is together. You can use this indicator for your own experts with iCustom() Momentum is in the buffer ( 0 ) and moving average is in the buffer ( 1 ) there are afew parameters for using this indicator on different currencies and different time frames. you can test it and optimize it . Input Parameters: MomentumPeriod: default is 40 SignalMaPeriod : default is 28 SignalMAMode : default is SSMA
您知道为什么MetaTrader市场是出售交易策略和技术指标的最佳场所吗?不需要广告或软件保护,没有支付的麻烦。一切都在MetaTrader市场提供。
您错过了交易机会:
- 免费交易应用程序
- 8,000+信号可供复制
- 探索金融市场的经济新闻
注册
登录