 MetaTrader 5
 专家
专家
 指标
指标
 程序库
程序库
 实用工具
实用工具
 窗口小部件
窗口小部件
 规则
规则
适用于MetaTrader 4的新技术指标 - 163
 下面列出的技术指标信号对MetaTrader 4平台的开仓交易和平仓交易起着至关重要的作用。
指标的本质就是一种交易品种的数学转换,旨在预测价格变化。
下面列出的技术指标信号对MetaTrader 4平台的开仓交易和平仓交易起着至关重要的作用。
指标的本质就是一种交易品种的数学转换,旨在预测价格变化。 
The CCI FIBO trend indicator displays the real sentiment of the market. Does not redraw. The CCI FIBO indicator is based on the processed values of the standard CCI indicator. The indicator is able to display the slowing\reversal of the price during the trend movement (for exiting the position, and with some experience to display the opening in the opposite direction, for example, to use in scalping). It shows spikes in a flat. The idea of the indicator was that there are indicators that are goo
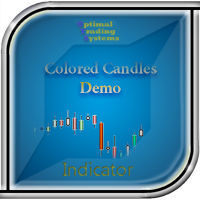
The demo version of the Colored Candles indicator - calculates the parameters of each candle, as well as its volume. After that, it paints the candles depending on their strength and direction. Bullish candles are colored green and bearish candles - red. The greater the power of the bulls or the bears, the brighter the color. You can change the colors if you want. The indicator helps to analyze the price movement, as well as market entry points. The more accurate signals are formed on the higher
FREE

Elliott Wave Trend was designed for the scientific wave counting. This tool focuses to get rid of the vagueness of the classic Elliott Wave Counting using the guideline from the template and pattern approach. In doing so, firstly Elliott Wave Trend offers the template for your wave counting. Secondly, it offers Wave Structural Score to assist to identify accurate wave formation. It offers both impulse wave Structural Score and corrective wave Structure Score. Structural Score is the rating to sh

The Z-Compass is part of a suite of four indicators called the Z-Tools Black you can buy separately in the MetaTrader Market. The Z-Compass is one of the most important indicators, because it serves as a compass in the market and is composed of the following elements A histogram and zero line. The histogram is plotted with each candle and changes depending on the selected time frame. When the histogram is above the zero line, we say the trend or momentum is bullish and when it is below the zero

The Z-Beat Zone is part of a suite of four indicators called the Z-Tools Black you can buy separately in the MetaTrader Market. The Z-Beat Zone is displayed as two lines. The main line is called SlowK. The second line, called SlowD. The SlowK line is a solid gross line and the SlowD line is a solid slim line. There are several ways to interpret a Z-Beat Zone. Three popular methods include: Buy when the Z-Beta Zone (The SlowK line) falls below of the level (e.g., -40) and then rises above that le

The Z-Zone is part of a suite of four indicators called the Z-Tools Black you can buy separately in the MetaTrader Market. The Z-Zone is based on the Market Profile and includes three dynamic lines: At the top is the resistance of zone (that we´ll identify as RoZ ) In the center we find the average distribution of the area (that we´ll identify as PoC ) At the bottom is the support of zone (that we´ll identify as SoZ ) Together they make up what we call the value zone, meaning that the market mo

Two Dragon is an advanced indicator for identifying trends, which uses complex mathematical algorithms. It works in any timeframe and symbol. Indicator is designed with the possibility to customize all the parameters according to your requirements. Any feature can be enabled or disabled. When a Buy / Sell trend changes the indicator will notify using notification: Alert, Sound signal, Email, Push. МetaТrader 5 version: https://www.mql5.com/en/market/product/14906 Parameters Max_Bars_History —
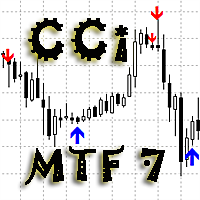
As the proper trading using CCI indicators requires the trader to monitor multiple timeframes and CCI indicators with different periods. For example - monitor the trend using CCI with the period of 100 or 200 ( slow CCI period ) on the H4 timeframe, and make entries based on the CCI with the period of 13 ( fast CCI period ) on the H1 timeframe. To facilitate this task, the Delta CCi MTF7 indicator was created, which implements monitoring the changes of the price movement trends as well as marks
CIS is designed for trading a basket of correlating currencies, as well as single instruments: indicators
VSA indicator which draws arrows (does not redraw). Its signals indicate the price reversal on a calm market or decrease of the rise or fall rate during strong movements. Works fine in the flats. As the indicator uses volumes in its calculations, be careful during evenings and night times, when there are very small volumes. It is recommended to be used only on multiple currencies or at lea
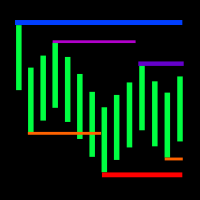
The indicator displays the fractal levels of one,two or three different higher timeframes starting with the current one. When a new fractal appears, a new level is plotted. The indicator can be used for visual analysis of the current chart and applied in an EA. If more levels are needed, start a new instance of the indicator.
Features Timeframes to choose from. For example: M1, M2, M3, M20, H2, H3, H12. If a timeframe smaller than the current one is selected in the settings, the level of the cu
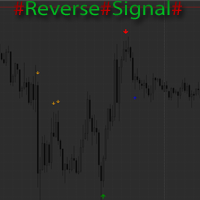
The indicator marks the estimated market reversals in the form of arrows. The indicator is able to detect 3 types of reversals. The primary reversal signal. It is a stronger and more important reversal. Denoted by the largest arrow. Alternative signal - additional signal without additional filters in contrast to the primary. Suitable for scalping on small timeframes. A mixture of the primary and alternate reversals, but with the addition of the trend filter. Also shows good results on small time

Bermaui Bands (BB) 是一种技术分析工具,有助于在价格波动和趋势价格变动之间进行过滤。这个指标背后的想法可以在接下来的步骤中解释: 将标准偏差计算为一个在 0 到 100 之间移动的振荡器。我将其命名为 Bermaui Deviation 百分比 (BD %)。 如果“BD %”接近于零,则波动率处于极端状态。此外,如果“BD %”接近 100,则波动性非常低。 高波动性意味着趋势市场的可能性很大,而低波动性意味着横向或区间市场。 中线是简单移动平均线 (SMA),因为标准偏差是根据 SMA 计算的。 将“BD %”添加到计算中具有相同条数的简单移动平均线,以获得上伯毛伊乐队。 从计算中具有相同条数的简单移动平均线中减去“BD %”以获得下伯毛伊乐队。 重要信息
Bermaui Bands 用户手册: https://www.mql5.com/en/blogs/post/718688 Bermaui Bands Expert Advisor 示例 : https://www.mql5.com/en/blogs/post/731143
如何使用它 使用 Bermaui
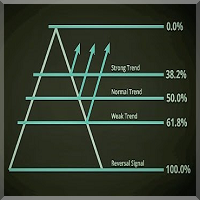
介紹 斐波那契水平專業指標是日常交易的絕佳工具,可作為其他指標的補充,以更好地確認交易設置和市場走向。該指標易於設置,適用於所有貨幣對和時間範圍,推薦使用 M15-W1。
該指標的目的是在圖表上顯示斐波那契水平、日線、上線和下線。作為附加功能,該指標還會在您的圖表上繪製回撤線和擴展線,並告訴您當天的高點、低點、範圍和點差。 Fibonacci Levels Pro 指標使用前一天的高點和低點為您繪製計算線。這是每個交易者必備的工具! 特徵 易於設置,無需複雜的設置 乾淨流暢的圖表線條,易於閱讀 適用於所有貨幣對和時間範圍 斐波那契線的可調顏色設置 可調節儀表板顏色 包含帳戶信息的儀表板 指標參數 UpperFiboColor - 在 123.6 到 400.0 之間設置您想要的上斐波那契水平的顏色 MainFiboColor - 為每日斐波那契水平從高 100.0 到低 0.0 設置所需的顏色 LowerFiboColor - 從 -23.6 到 -500.0 為較低的斐波那契水平設置所需的顏色 主要斐波那契線 - 真/假。在圖表上顯示從高 100.0 到低 0.0 的每日水平 儀
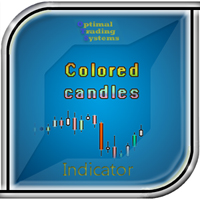
Some candles have a strong tendency to continue the movement or to revert it. With the help of the Colored candles indicator such movements are clearly visible. This indicator calculates the parameters of each candle, as well as its volume, and after that it paints the candles depending on its strength and direction. Bullish candles are colored green and bearish candles - red. The greater the power of the bulls or the bears, the brighter the color. You can change the colors if you want. The indi

Advanced and affordable momentum indicator that fade the fake move of market. It is smoothed because of special sophisticated exponential averaging calculation. It is also similar to special type of CCI with more tolerance to overbought or oversold conditions with built-in momentum indication. This indicator is able to empower your trading as a trend detector, CCI and market momentum scale measurement.
Features Smoothed to filter uncomfortable noises. Non-Lagging Exponential averaging. Line or
This innovative technical indicator was created to detect quiet market period before the beginning of the high volatile market. Like many good technical indicators, this Market Activity Index is very stable and it is widely applicable to many financial and non financial instruments without too much restriction. The Market Activity Index can be used best to visualize the alternating form of low and high volatile market. It is very useful tool to pick up the quiet market but ironically this is the
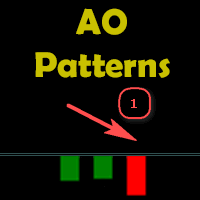
The indicator displays a formed pattern of the AO (Awesome Oscillator) indicator at the signal bar according to the "Profitunity" strategy by Bill Williams. The patterns differ in colors, location and number. The indicator can notify the user about the appearance of a new pattern. It is important to remember that you must not use the signals of the "АО" indicator until the appearance of the first buy/sell fractal outside the alligator mouth.
Types and designation of the patterns Buy 1 - "Saucer
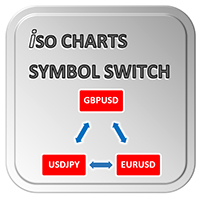
With Symbol Switch you can easily change the symbol of all open charts without losing your analysis or template. Easily monitor many symbols with only one monitor. Auto save\load analysis separately for each symbol (including all graphical analysis and attached indicators). The indicator shows the symbols which are visible in your MT4 "Market Watch" window. To add\remove a symbol just add\remove it from MT4 "Market Watch" window. Monitoring all symbols profit with the panel. Works with all broke

Delta Pairs is an indicator for pair trading, it displays the divergence of two currency pairs. Does not redraw. A useful tool for the analysis of the behavior of two currency pairs relative to each other.
Purpose The Delta Pairs indicator is designed for determining the divergences in the movements of two currency pairs. This indicator is displayed as two line charts and the difference (delta) between these charts in the form of a histogram. The Delta Pairs indicator will be useful for those w
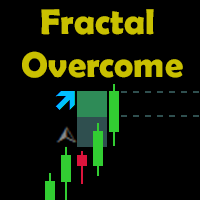
Indicator Description The indicator shows the breakout of the last fractal in real time. It considers the buy fractals above the balance line and sell fractals below the balance line (according to the Bill Williams' strategy), and also the fractals that are independent of the balance line. The direction and the distance of the fractal level breakout are displayed in real time. When a candle closes outside the suitable fractal, the levels of the specified offset, the distance to the candle closur

DS Arrow is a simple indicator for buying/selling in MetaTrader 4, This straightforward indicator shows the market entry points. Perfect for both beginners and professionals. Designed for working only with the H1 timeframe, the indicator will not be displayed on other timeframes. Recommended currency pairs: GBP-USD, EUR-USD, USD-CAD, AUD-USD, USD-JPY, NZD-USD. Works with both4-digit and 5-digit quotes. This indicator does not redraw its signals.
Features The entry is made when the hourly candle
Volume Levels is a very important indicator for exchange trading. Most of the trades were performed on those levels. This indicator displays the price level that had the most trade volumes over a certain period of time. Often, the price bounces from those levels in the future, and it can be successfully used in trading. It works on any currency pair.
Parameters HistoryBars - the number of bars to determine the near volume levels; Range - the maximum distance above and below the current price to
Good News ! Advanced Currency Meter is more awesome now ! If you have been a fan of the free version of Advanced Currency Meter then I will implore you not to be discourage because you will soon find that the new paid version is worth every dime. Unlike the free version the new paid version of Advanced Currency Meter now has a newly added panel called the “% Daily Range” . Why A Paid Version Now? We believe you like good things and many who has used Advanced Currency Meter over the years will te
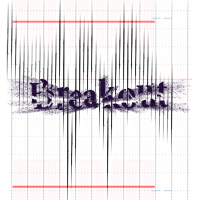
The indicator draws lines the the price highs and lows. Break through the high or low usually indicates trend change (or continuation). Once the price moves through a line, and the candlestick closes, the indicator draws an appropriate arrow (also, you can enable alerts). A deal should be conducted in the breakthrough direction immediately or after a slight rollback. It is best to trade following the trend on a larger timeframe. This indicator is easy to use, but nevertheless, there are many tra
FREE

Was: $99 Now: $49
Blahtech Daily Range indicator displays the average daily range alongside the individual session ranges. Using the daily open price as a reference the indicator shows fixed range and dynamic range targets as lines on the charts. These lines clearly show when the average range has been exhausted. Daily and session ranges can be useful for confirming entries or setting targets and is an excellent odds enhancer for many trading systems. Links [ Documentation | Install

The indicator detects and displays the AB=CD harmonic pattern on the chart according to the scheme provided in the screenshot. The pattern is plotted by the extreme values of the ZigZag indicator (included in the resources, does not require additional installation). After detecting the pattern, the indicator notifies of that by the pop-up window, a mobile notification and an email. The indicator highlights not only the complete figure, but also the time of its formation. During the formation the
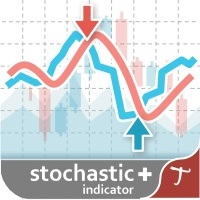
Tipu Stochastic is the modified version of the original Stochastic Oscillator published by MetaQuotes here .
Features Choose three types of signals (Reversals, Main Signal Cross, and Overbought/Oversold Cross). Customizable Buy/Sell alerts, push alerts, email alerts, and visual on-screen alerts. Marked overbought and oversold levels. Add Tipu Panel (found here ) and unlock the following additional features: An easy to use Panel that shows the trend + signal of the selected time frames. Show Sto
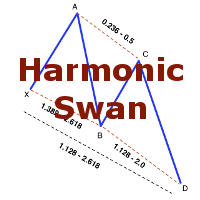
The indicator detects and displays the White Swan and Black Swan harmonic pattern on the chart according to the scheme provided in the screenshot. The pattern is plotted by the extreme values of the ZigZag indicator (included in the resources, does not require additional installation). After detecting the pattern, the indicator notifies of that by the pop-up window, a mobile notification and an email. The indicator highlights not only the complete figure, but also the time of its formation. Duri

The indicator detects and displays Shark harmonic pattern (see the screenshot). The pattern is plotted by the extreme values of the ZigZag indicator (included in the resources, no need to install). After detecting the pattern, the indicator notifies of that by a pop-up window, a mobile notification and an email. The indicator highlights the process of the pattern formation and not just the complete pattern. In the former case, it is displayed in the contour triangles. After the pattern is comple

The indicator detects and displays 3 Drives harmonic pattern (see the screenshot). The pattern is plotted by the extreme values of the ZigZag indicator (included in the resources, no need to install). After detecting the pattern, the indicator notifies of that by a pop-up window, a mobile notification and an email. The indicator highlights the process of the pattern formation and not just the complete pattern. In the former case, it is displayed in the contour triangles. After the pattern is com
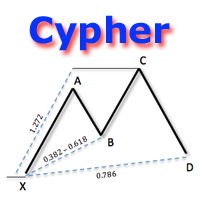
The indicator detects and displays Cypher harmonic pattern also known as Anti-Butterfly (see the screenshot). The pattern is plotted by the extreme values of the ZigZag indicator (included in the resources, no need to install). After detecting the pattern, the indicator notifies of that by a pop-up window, a mobile notification and an email. The indicator highlights the process of the pattern formation and not just the complete pattern. In the former case, it is displayed in the contour triangle
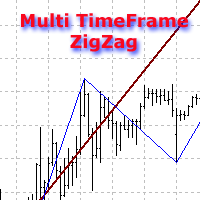
The indicator displays ZigZag lines from a higher timeframe (see the example in the screenshot). The red thin line is the current timeframe's ZigZag, while a thicker yellow line is the higher timeframe's one. The indicator is repainted as the data is updated.
Parameters
Depth, Dev, Back - ZigZag parameters; BarsCount - amount of processed bars (reduces the initial download time and decreases the load when using in an EA); TimeFrame - indicator timeframe (cannot be lower than the current one).
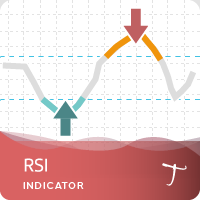
Tipu RSI Features 28 symbols, multi-time frame powerful Dashboard for the full market view Customizable Buy/Sell alerts, push alerts, email alerts, and visual on-screen alerts. Marked overbought and oversold levels. Three colors RSI that marks the normal, oversold and overbought levels. The relative strength index (RSI) is an oscillator devised by J. Welles Wilder in his famous book New Concepts in Technical Trading Systems in 1978.1 He also introduced Parabolic SAR (see Tipu Parabollic SAR Pane
FREE

The indicator detects and displays the 5-0 harmonic pattern on the chart according to the scheme provided in the screenshot. The pattern is plotted by the extreme values of the ZigZag indicator (included in the resources, does not require additional installation). After detecting the pattern, the indicator notifies of that by the pop-up window, a mobile notification and an email. The indicator highlights not only the complete figure, but also the time of its formation. During the formation the f
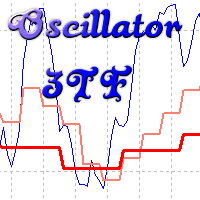
Oscillyator 3TF displays data on standard oscillators (RSI, MFI, STOCH, CCI, DeM, Momentum) on the current and two following timeframes. The modified version of Price Reversal oscillator is also added. The indicator allows you to track the situation on higher timeframes and select suitable entry points when oscillator lines are in oversold/overbought zones. The indicator may notify of all three lines located in specified zones via alerts, emails, and push notifications.
Parameters
Period – indi
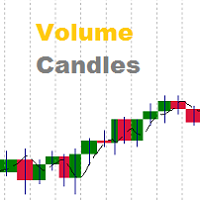
Volumes are one of the most important factors of trading, as it is the high volumes that move the market in either direction. But there are very few standard indicators for volumes in MetaTrader 4. The Volume Candles analyses the volumes of the trades and displays candles depending on these volumes. The candle appears once the required number of volumes has passed during trading (the VolumeCandle parameter). If the candles close frequently and are thin, then the volumes on the market are current
The indicator calculation is based on the analysis of the price characteristics of bars and is adjusted by the ATR value. The degree of the ATR influence is determined by the ratio. The color scheme of the indicator depends on the direction of the current trend. A change in the trend is displayed by an arrow and a corresponding message. Depending on the strategy chosen by the trader, this indicator can be used to generate market entry signals, to place stop loss or close trades, and can also be

Be notified of every color change of Heiken Ashi (HA) candles. The indicator will trigger past and new signals every time that HA candles change their colors. Note : this tool is based on the code of Heiken Ashi indicator developed by MetaQuotes Software Corp.
Features The signals are triggered at closing of last bar/opening of a new bar; Any kind of alerts can be enabled: Dialog Box, Email message, SMS notifications for smartphones and tablets, and Sound alerts; By default, up arrows are plott

This indicator displays signals on the price chart based on the classic indicator, the Money Flow Index (MFI). Volume is taken into account when calculating MFI values. The MFI can be used to identify overbought and oversold zones in the market. This indicator allows you to display several types of signals on the price chart: MFI crossing the midpoint between the overbought and oversold zones; MFI exiting the overbought or oversold zone; MFI entering the overbought or oversold zone; fast MFI and

或“MAC”。 这是一个旨在帮助您捕捉和交易趋势的指标。这个指标背后的想法可以在接下来的步骤中解释:
画一个快速移动的平均信封。 画一个缓慢移动的平均信封。 MAC Upper Band 是两个包络的高值之间的最高值。 MAC 下频带是两个包络的低值之间的最低值。 MAC 直方图云填充两个波段之间的距离,以显示方向的变化。 蓝云表示上升趋势,而红云表示下降趋势。 阅读下一篇博客,了解如何使用 MAC 缓冲区构建您自己的 EA 或扫描仪:
https://www.mql5.com/en/blogs/post/734293
如何使用 MAC
使用 MAC 云作为过滤器来帮助您识别趋势方向。 使用您常用的交易工具在 MAC Clouds 的方向上进行交易,只是为了尽可能地消除错误信号。 使用建议的进入箭头可帮助您找到强大的趋势点作为起点。 MAC 功能 MAC 不会重新绘制或重新计算其结果。 它适用于加密货币、股票、指数、石油、黄金和所有时间范围。 声音、电子邮件警报和移动通知。 买入、卖出箭头有助于识别趋势信号。 精心设计的参数可帮助用户轻松地在它们之间导航。 建立自己的专家顾
Volume Volatility is an indicator which analyzes currency pairs, indices, commodities etc. in terms of extremely high and extremely low accumulation to distribution ratio in comparison to values from past. The most important parameter is "Volume Volatility Factor" - this parameter, in big simplification, determines how far distance in the past is analyzed. The lower value of the parameter, the indicator analyzes less data from the past. I recommend you to set and test e.g. 3, 5, 15, 35, and 48 w
Universal adaptable indicator. It determines the estimated trading range for the current day based on the available history a real data, and displays the area of the probable price rollback on the chart. All this thanks to the built-in algorithm that automatically adapts to any behavior models of the market quotes. With the parameters adjusted, the indicator shows its effectiveness on most of the currency pairs, that have a rollback from the reached extremums during the current or the next tradi
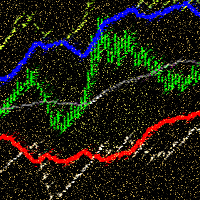
ADX Channel is an indicator that plots the channel depending on the values of the ADX (Average Directional Movement Index) indicator. The resulting channel is a little similar to the Envelopes, but its lines depend on the market volatility. The sell trade is usually executed fast when the price touches and bounces from the upper line of the channel, buy - from the lower. It is recommended to trade when there is no significant news. The recommended timeframes: M5 - H1. The indicator is not design
FREE

The FxSProMT indicator shows the current market trend and trend change.
Indicator Parameters Ind_Period - the number of previous bars used to calculate actual values. Number_Bars - the number of bars to display the indicator.. Too many bars may significantly slow down the operation of the trading terminal. Signal_Sound - sound alert to notify of trend change. The sound can be played multiple times until the signal is confirmed (the bar closes). Default is disabled. Signal_Alert - an alert to no
FREE
The FxSProWPR oscillator generates signals for trend confirmation, which can also nbe used to confirm the emergence of new trends.
Indicator Parameters NumberBars - the number of bars to display the indicator. Too many bars may significantly slow down the operation of the trading terminal. SignalAlert - an Alert notifying of a trend. SignalSound - sound alert to notify of a trend. The sound will be played once the histogram exceeds the level of 15.
Rules to confirm position entry Green histogr
FREE
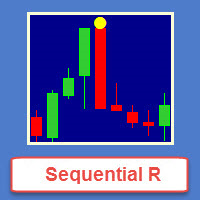
Sequential R is a powerful indicator from the set of professional trader. In today’s market, an objective counter trend technique might be a trader’s most valuable asset.
Most of the traders in the stock market must be familiar with the name "TD Sequential" and "Range Exhaustion". The Sequential R is a Counter-Trend Trading with Simple Range Exhaustion System. TD Sequential is designed to identify trend exhaustion points and keep you one step ahead of the trend-following crowd. The "Sequential

The indicator takes screenshots of the active terminal chart. Available image saving options: At the opening of a new bar (candlestick) depending on the currently selected timeframe; After a certain time interval, e.g. every 10 minutes after indicator launch on a chart; When trade orders are opened/closed both by an Expert Advisor and manually; Each time when a user clicks the "Screeshot" button.
Indicator Parameters Settings Screenshot time Start Time (hh:mm) - sets the start time of indicator

The Supply and Demand Zones indicator is one of the best tools we have ever made. This great tool automatically draws supply and demand zones, the best places for opening and closing positions. It has many advanced features such as multi timeframe zones support, displaying the width of zones, alert notifications for retouched zones, and much more. Because of market fractality, this indicator can be used for any kind of trading. Whether you are a positional, swing, or intraday trader does not ma
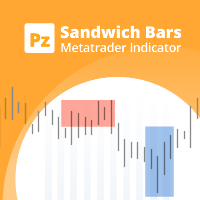
Spot high-probability trades: sandwich bar breakouts at your fingertips This indicator detects Sandwich Bars of several ranges, an extremely reliable breakout pattern. A sandwich setup consists on a single bar that engulfs several past bars, breaking and rejecting the complete price range. [ Installation Guide | Update Guide | Troubleshooting | FAQ | All Products | Get Help ] Easy and effective usage Customizable bar ranges Customizable color selections The indicator implements visual/mail/
FREE
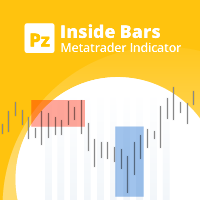
Enhance your price action strategy: inside bar breakouts at your fingertips
This indicator detects inside bars of several ranges, making it very easy for price action traders to spot and act on inside bar breakouts. [ Installation Guide | Update Guide | Troubleshooting | FAQ | All Products | Get Help ] Easy to use and understand Customizable color selections The indicator implements visual/mail/push/sound alerts The indicator does not repaint or backpaint An inside bar is a bar or series of
FREE

Description:
This indicator is a collection of three indicators , it is 3 in 1: PipsFactoryDaily Click Here PipsFactoryWeekly Click Here PipsFactoryMonthly Click Here If you are interesting in all of them, you can save money - this collection indicator is cheaper.
This indicator depends on High and Low price of currency in the (Last day / Last week / Last Month) depends on user input, and then I made some secret equations to draw 10 lines.
Features:
You will know what exactly price you should
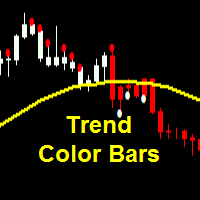
Parameters SoundAlerts = true – play sound alerts, true or false (yes or not) UseAlerts = true – use alerts, true or false (yes or not) eMailAlerts = false – use alerts via email, true or false (yes or not) PushNotifications = false – use push notifications, true or false (yes or not) SoundAlertFile = "alert.wav" – name of alerts sound file ColorBarsDown = clrRed – color body of bearish candlesticks (default – red) ColorBarsUps = clrBlue – color body of bullish candlesticks (default – blue) Colo
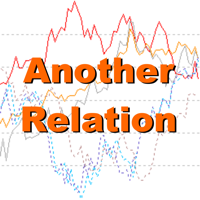
Another Relation displays the relative movement of the other symbols (up to 5) in a separate chart window. The indicator works currency pairs, indices and other quotes. Another Relation allows to visually estimate the symbol correlation and their relative amplitude. Thus, the trader is able to compare the movement of the current instrument to others, identify correlations, delays and make decisions based on their general movement.
Indicator usage
The window displays the data on all the symbols
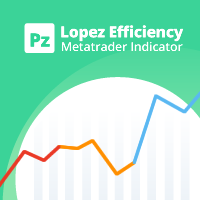
该指标基于一定数量的柱线的真实高/低比率来分析当前市场波动的效率。 [ 安装指南 | 更新指南 | 故障排除 | 常见问题 | 所有产品 ] 比率是市场运动的有效性 比率低于1意味着市场无处可去 比率大于1意味着市场开始显示方向性 比率大于2表示市场正在显示有效的波动 高于3的比率表示市场移动太多:它将停止或回调 它具有直接的交易含义。 当线是红色时寻找位置机会 当比率为橙色时寻找区间交易机会 当比率为蓝色时寻找趋势交易机会
指标如何计算? 指标显示在期望的柱数期间市场移动了多少典型真实区间。典型的真实范围是从最后一根柱线开始的平均真实高-低范围,然后将其与同一时间段内的绝对市场走势进行比较。指标比率可以衡量范围和市场走势之间的比率,从而衡量市场效率。零表示市场效率低下,无处可去。
设置 该指标只有一个参数:指标周期,这是要回算的柱线数量。
作者 ArturoLópezPérez,私人投资者和投机者,软件工程师和Point Zero Trading Solutions的创始人。
FREE

MFI Pointer is an indicator based on Money Flow Index indicator that uses both price and volume to measure buying and selling pressure. Money Flow Index is also known as volume-weighted RSI . MFI Pointer simply draws arrows on chart window when value of Money Flow Index (from parameter MFI_Period) is below MFI_Level (green upward pointing arrow) or above 100-MFI_Level (red downward pointing arrow). Indicator works on all timeframes and all currency pairs, commodities, indices, stocks etc. MFI Po

Spread Display is a simple but very helpful indicator allowing live monitoring of spread in chart window. Using this indicator, there's no need to distract attention never again, seeking current spread value somewhere else. From now on, everything is clear and at the height of your eyes, in chart window of selected currency pair. Indicator has many settings. We can choose any font we want and we can set 3 spread levels ( Spread_Level_1 , Spread_Level_2 and Spread_Level_3 ) between which will cha

In the stock market technical analysis, support and resistance is a concept that the movement of the price of a security will tend to stop and reverse at certain predetermined price levels. Support and resistance levels can be identified on any timeframe. However, the most significant ones are found on the higher time frames, such as daily, weekly, and monthly. This indicator using the weekly OHLC data to identify the relevant levels. This is a support and resistance indicator and providing majo
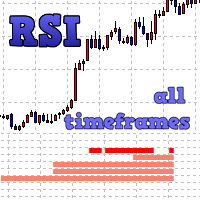
The indicator displays entry signals based on RSI location in overbought/oversold zones on all the timeframes beginning from the current one up to the highest (MN). If RSI is less than Zone but more than (100-Zone), the appropriate indicator value is filled for the timeframe: M1 - from 0 to 10 (sell) or from 0 to -10 (buy); M5 - from 10 to 20 (sell) or from -10 to -20 (buy); M15 - from 20 to 30 (sell) or from -20 to -30 (buy); M30 - from 30 to 40 (sell) or from -30 to -40 (buy); H1 - from 40 to
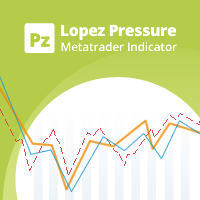
该指标预测价格反转,分析市场的看涨和看跌压力。购买压力是一定天数内所有累积柱的总和乘以交易量。卖压是相同数量条上所有分配的总和乘以交易量。 [ 安装指南 | 更新指南 | 故障排除 | 常见问题 | 所有产品 ] 指标比率使您可以衡量购买压力占总交易量的百分比,该值应在0到100之间波动。它执行两个移动平均值(快和慢),以识别压力趋势的变化并相应地寻找交易。 比率50表示市场均衡 比率超过70表示市场超买 比率低于30意味着市场超卖 红色虚线是当前比率 蓝线是信号线 橙色线是主线 它具有直接的交易含义。
市场超卖时寻找购买机会 市场超买时寻找销售机会 如果信号线高于主线,则压力看涨 如果信号线低于主线,则压力看跌
输入参数 周期:研究计算压力的条数 快速MA:直方图的快速平均周期 慢的MA:直方图的平均周期慢
作者
ArturoLópezPérez,私人投资者和投机者,软件工程师和Point Zero Trading Solutions的创始人。
FREE

Friends, join us!
Ask questions and connect with like-minded traders: MetaCOT Public Group
MetaCOT Information Channel: news, CFTC reports, and signals: MetaCOT Channel
Here’s to successful trading and new profitable signals for us all! Attention! Recently, certain countries have been blocking access to the cftc.gov website. As a result, users in these countries are giving the product low ratings. MetaCOT has always adhered to the highest quality standards and is in no way associated with th
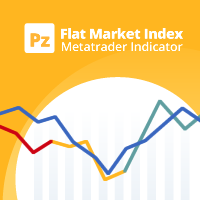
该指标计算代号相对移动了多少才能找到趋势或平淡的市场。它显示最新价格范围的定向百分比。 [ 安装指南 | 更新指南 | 故障排除 | 常见问题 | 所有产品 ] 零值表示市场绝对平稳 值100表示市场完全处于趋势 蓝线表示价格区间健康 红线表示价格范围窄 移动平均线是平坦市场指数(FMI) 它具有直接的交易含义。 当线条为蓝色且在FMI上方时,使用趋势交易策略 当线条为红色且低于FMI时,请使用范围交易策略 根据FMI执行仪器选择 该指标对于避免EA交易平淡交易特别有用。
输入参数 最大历史记录条数:加载时回顾过去的条数。 回顾:研究平盘市场指数的柱线数量。 周期:计算索引的平均周期。 ATR周期:指标中用于计算移动单位的ATR周期。
ATR乘数:ATR的乘数,用于计算索引的移动单位。
作者 ArturoLópezPérez,私人投资者和投机者,软件工程师和Point Zero Trading Solutions的创始人。
FREE

Introduction to Support Resistance Indicator Support and Resistance are the important price levels to watch out during intraday market. These price levels are often tested before development of new trend or often stop the existing trend causing trend reversal at this point. Highly precise support and resistance are indispensable for experienced traders. Many typical trading strategies like breakout or trend reversal can be played well around these support and resistance levels. The Precision Sup

This indicator finds Three Drives patterns. The Three Drives pattern is a 6-point reversal pattern characterised by a series of higher highs or lower lows that complete at a 127% or 161.8% Fibonacci extension. It signals that the market is exhausted and a reversal can happen. [ Installation Guide | Update Guide | Troubleshooting | FAQ | All Products | Get Help ] Customizable pattern sizes
Customizable colors and sizes
Customizable breakout periods Customizable 1-2-3 and 0-A-B ratios
It impl
FREE
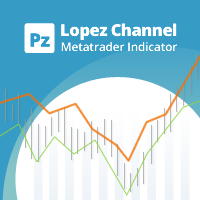
This multi-timeframe indicator identifies the market's tendency to trade within a narrow price band. [ Installation Guide | Update Guide | Troubleshooting | FAQ | All Products | Get Help ] It is easy to understand Finds overbought and oversold situations Draws at bar closing and does not backpaint The calculation timeframe is customizable The red line is the overbought price The green line is the oversold price It has straightforward trading implications. Look for buying opportunities when t
FREE
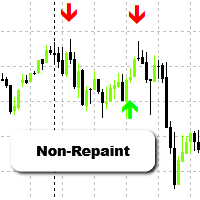
Spartan Arrows – Non-Repainting Buy/Sell Signals Spartan Arrows is a powerful MT4 indicator that delivers accurate buy and sell arrows directly on your chart. Built for traders who want clarity and precision, it filters out market noise and provides only high-probability signals. Once an arrow appears, it does not repaint – giving you the confidence to trade without second-guessing your entries and exits. Key Features Clear buy/sell arrows for instant decisions Non-repainting and non-lagging si
This indicator is Demo version of FiboRec and works only on EURUSD This indicator depends on Fibonacci lines but there are secret lines I used. By using FiboRec indicator you will be able to know a lot of important information in the market such as:
Features You can avoid entry during market turbulence. You can enter orders in general trend only. You will know if the trend is strong or weak.
Signal Types and Frame used You can use this indicator just on H1 frame. Enter buy order in case Candle
FREE

This indicator helps you to scan all symbols which are in the Market Watch window and filter out a trend with alerts. It works on five most effective indicators which are used by most of traders for trading: Moving Average Average Directional Moment (ADX) Relative Strength Index (RSI) Parabolic SAR MACD It calculates two bars for scanning. When box colour changes to coral or royal blue colour, it indicates you for trend change for long and short entry. And also you will get alert on screen. When
FREE

Part of the Shved Market Analytics System (SMAS). ShvedSupDem Pro Zone(Chart Pro) is one of the core modules of the SMAS ecosystem—a professional market analysis system built around supply and demand, market structure, and multi-timeframe confirmation. ShvedSupDem Pro Zone(Chart Pro) is a professional indicator for automated drawing of Supply and Demand zones directly on the chart of the MetaTrader 4 terminal. The indicator automatically identifies and plots key market imbalance areas where

A very powerful tool that analyzes the direction and the strength of the 8 major currencies: EUR, GBP, AUD, NZD, CAD, CHF, JPY, USD – both in real time, and on historical data. The indicator generates a sound signal and a message when a trend changes. Never repaints signal. The strength of the signal is calculated for all pairs which include these currencies (28 pairs total), can have value from 0 to 6 on a bullish trend, and from 0 to -6 on a bearish trend. Thus, you will never miss a good move
This is Demo Version of PipsFactoryMonthly This indicator depends on High and Low price of Currency in last Month and then i made some secret equations to draw 10 lines.
Features You will know what exactly price you should enter the market. You will know when to be out of market. You will know you what should you do in market: Buy Sell Take profit and there are 3 levels to take your profit Support Resistance Risk to buy Risk to Sell
Signal Types and Timeframe Used You can use this indicator ju
FREE
MetaTrader市场是您可以下载免费模拟自动交易,用历史数据进行测试和优化的唯一商店。
阅读应用程序的概述和其他客户的评论,直接下载程序到您的程序端并且在购买之前测试一个自动交易。只有在MetaTrader市场可以完全免费测试应用程序。
