适用于MetaTrader 4的新技术指标 - 79
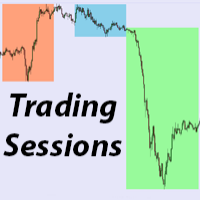
Trading Sessions 3
Description
Display the intra-day trading sessions from ASIA , LONDON and NEW YORK ASIA Session : Most volatile currencies AUD , NZD , JPY LONDON Session : Most volatile currencies GBP , EUR NEW YORK Session : Most volatile currency USD Inputs
Modifiable trading hours as HH:MM format
Custom days to display sessions
Note : GMT+3 = Helsinki Timezone
FREE
此多品种指标旨在自动识别价格何时达到主要心理水平。也称为整数、整数或关键级别。作为奖励,它还可以在一个选定的时间范围内扫描枢轴点水平。结合您自己的规则和技术,该指标将允许您创建(或增强)您自己的强大系统。 特征 可以将信号写入文件,智能交易系统可以使用该文件进行自动交易。
可以同时监控您的市场报价窗口中可见的所有交易品种。将该指标仅应用于一张图表,并立即监控整个市场。 当价格达到整数水平时向您发送实时警报。支持所有 Metatrader 原生警报类型。 该指标包括一个用于存储信号的图表面板。 输入参数
请在此处 找到输入参数的说明和解释。 重要的
请注意,由于具有多功能性,既不会在安装指标的图表上绘制买入/卖出建议,也不会绘制线条和箭头。圆形水平线将绘制在图表上,当单击面板中的信号时将打开该水平线。强烈建议将指标放在干净的图表上,不要在其上放置任何其他可能干扰扫描仪的指标或智能交易系统。

Indicator for binary options arrow is easy to use and does not require configuration works on all currency pairs, cryptocurrencies buy signal blue up arrow sell signal red down arrow tips do not trade during news and 15-30 minutes before their release, as the market is too volatile and there is a lot of noise it is worth entering trades one or two candles from the current period (recommended for 1 candle) timeframe up to m 15 recommended money management fixed lot or fixed percentage of the depo
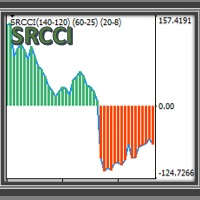
SRCCI An indicator based on RCCI , is a combination of the RSI and CCI indicators, adapted into three levels categorized into A, B and C. Taking advantage of their combination to maintain a controlled filter and applicable to different strategies. The RSI (Relative Strength Index) is one of the most popular and used oscillators to operate in the markets. It is a valuable tool to measure both the speed of price changes and the possible levels of overbought or overbought. The CCI (Commodity Channe

You’ll love how you can receive alerts to your email and SMS when the candles turn green or red signifying the best buy and sell times in correlation to confirmed uptrends and downtrends. TO USE 1. Buy when green candles appear - this represents an uptrend. 2. Sell when red candles appear - this represents a downtrend. EXTRA FEATURE This indicator NEVER repaints so when a candle closes, that color is final. Also, the blue trend lines in the photos are not included, this is to demonstrate the pri

This tool was developed and designed for binary options trading It has been noticed that it can also be used in stock markets and forex. There are 2 options for trading binary options using this indicator Option 1 We open a deal on the next candle after a signal for one cut of the current period Buy or Sell depending on the signal The blue up arrow is Buy The red down arrow is Sell / We enter only on the first signal on the next candle and ignore the rest / Option 2 We enter on a signal for the
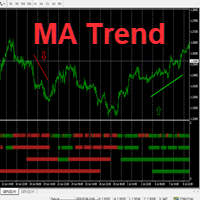
Hello This Indicator will draw Green (Up) and Red (Down) small arrows from Multi TimeFrames based in ( Moving Average) to help you to take decision to buy or sell or waiting If there 4 green arrows in same vertical line that's mean (Up) and If there 4 Red arrows in same vertical line that's mean (Down) and the options contain (Alert and Mobile , Mail Notifications). Please watch our video for more details https://youtu.be/MVzDbFYPw1M and these is EA for it https://www.mql5.com/en/market/produc

The Elephant Candle is an indicator for MT4. It draws arrows when strong bullish or bearish candles appear. Strong candles frequently initiate a new trend. The arrows can be used in expert advisors. This indicator can improve already existing trading strategies. The indicator is very fast and doesn't repaint.
Inputs Period Candle Multiplier Candle Niceness [%] Arrow Size Enable Alert Enable Push Notification Enable Email
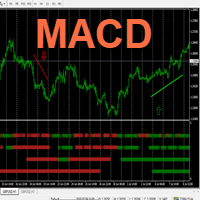
Hello This Indicator will draw Green (Up) and Red (Down) small arrows from Multi TimeFrames based in ( MACD ) to help you to take decision to buy or sell or waiting If there 4 green arrows in same vertical line that's mean (Up) and If there 4 Red arrows in same vertical line that's mean (Down) and the options contain (Alert , Mobile and Mail Notifications). Please watch our video for more details https://youtu.be/MVzDbFYPw1M and these is EA for it https://www.mql5.com/en/market/product/53352
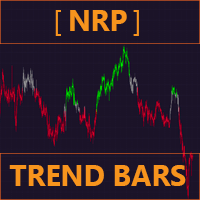
NRP Trend Bars
Your all-in-one Trend direction indicator, with Presets and Customisable options ! Get the most of Trends with NRP (No-repaint indicator) Trend Bars , designed to get the best of Trend Entries , Continuations and Reversals
One of it's function is the detection of the new trend starting , consolidation and possible trend change . It gives you the opportunity either to get in-&-out of the market in time
PRESETS (Sensibility)
LOW : Used for trend entries and confir

This indicator is SO SIMPLE… when the green Rise Coming arrow appears, a price drop may be on the way! Plain and easy profits! As you receive more than one 'Rise Coming' text signal in a downtrend, it means momentum is building larger for a bull run. HOW TO USE 1. When the green "Rise Coming" text appears, a price jump may be on the way! This indicator Never Repaints! To get the best setting it's a matter of tweaking the indicator until it gives you the best results. Our recommendation, and what
Profits are on the way! This indicator is SO SIMPLE… when the red Drop Coming arrow appears, a price drop may be on the way! When more than one "Drop Coming" signal appears on a bull run, that means the drop is getting closer. HOW TO USE 1. When the red "Drop Coming" arrow appears, a price drop may be on the way! To get the best setting it's a matter of tweaking the indicator until it gives you the best results. Our recommendation, and what our traders do is open their chart and move the input n
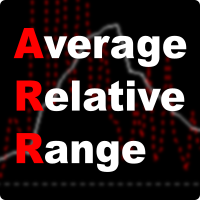
ARR indicator is similar to ATR but it returns percent range in relation to open price of given bar. It is mostly useful for cryptocurrency symbols where ATR ranges from years ago can't be directly compare with current values. First buffer (red dotted line) represents percent range of single bar and second buffer (white solid line) represents simple average of defined number of last bars. Only one input, PERIOD relates to number of bars used for average calculation (in default equals to 14).
FREE
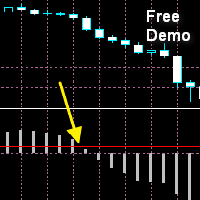
MACD Cross Prediction Indicator MT4 The moment when the MACD line crosses the signal line often leads to a significant price movement and trend changes. MACD Cross Prediction is an indicator that uses OSMA(MACD oscillator) and a red line. You can change the level of the red line on the indicator setting popup(and the red line moves up and down). The alerts(email, mobile push, sound, Alert Box) will be sent when the MACD histogram touches the red line, which means the alerts can be sent just befo
FREE
Wouldn’t you love a heads up alert when the market is switching from bullish to bearish momentum? When the background turns green, there is your signal to place a long trade to increase your profitability. Also, when the background turns red, guess what? It’s time to go short for profits. HOW TO USE 1. When the background turns green, this is the best place to take long trades. This also represents a bull market. 2. When the background turns red, this is the best place to take short trades. This

You’re going to love this! We have coded in the ability for you to be alerted by email or SMS when the Green Buy Line crosses below the Red Stop-loss line signaling a sell. And to take it one step further to increase your profits, we coded in the ability for you to be notified with the Price crosses down below the Green Buy Line or below the Red Stop-loss Line to give you earlier exit opportunities. HOW TO USE 1. Buy when the green buy line crosses above the blue trend line. You can also buy whe
特徴: MTF Moving Averageを8本一気に表示してくれるインジケータになります。 8本も必要ない場合にももちろん非表示にできます。
どの通貨でも使用可能になります。 それぞれのMTF Moving Averageの色や太さを変更できます。 各パラメータの説明: Method:MAの種類設定をします。 Applied price:MAで使用する価格を設定をします。 TimeFrame M5:使用するMAの時間足を設定します。 Period M5:使用するMAの期間を設定します。 ※ラベルに関係なく8本のMTF MAはどの時間足でも期間設定可能になります。
Update Frequency(seconds):MTF Moving Averageの再作成更新頻度を入力します。

Zig-Zag indicator with additional signals for inputs.
Visually easy to use:
The red zig-zag line is an uptrend. The blue zig-zag line is a downward trend. Arrows in the form of additional signals.
Works on any trading pairs. On any timeframe.
Not redrawn.
Input parameters
Zig-Zag Period - Zig-zag period (from 5) Signal Period - period of signal arrows (from 3) Alerts for signals
Play sound - Sound alert Display pop-up message - Notification by message on the screen Send push not

Currency Strength Meters are a great way to identify strong and weak currencies. With this CSM indicator attached to your chart, you will get a clear overlook over the 8 major currencies: USD, EUR, JPY, CAD, CHF, GBP, AUD, and NZD.
Suggested timeframes to scan is: M15 - H1 - H4 - Daily You can however just change timeframe to check in the settings. Bear in mind that scanning very low timeframes such as M1 will require a lot of resources and might make your mt4 terminal slow.
The strength s

Winner Overbought Oversold
Winner Overbought Oversold indicators are best suited for overbought/oversold analysis. Basically, there are two types of momentum oscillators: bound and unbound. Bound oscillators, such as this, fluctuate within a specific range. The most popular indicators used to identify overbought and oversold conditions are the relative strength index (RSI) and the stochastic oscillator . But you need a second conformation for entry and exit position from forex market.

介绍ProEngulfing - 您的专业MT4 Engulf模式指标 解锁精准力量,使用ProEngulfing,一款先进的指标,旨在识别和突出外汇市场上的合格的吞没模式。为MetaTrader 4开发,ProEngulfing提供了一种细致入微的吞没模式识别方法,确保您只收到最可靠的交易决策信号。 ProEngulfing的工作原理: ProEngulfing采用先进的算法分析吞没模式,不仅仅是简单地识别模式,还确保这些模式确实是合格的。以下是它的工作原理: 资格标准:该指标评估实体百分比与整个蜡烛大小的关系,并考虑影子百分比与蜡烛大小的比较。这种细致入微的评估确保只有高概率的吞没模式引起您的注意。 连续确认:ProEngulfing在吞没模式之前寻找足够数量的连续反向条,提供对模式可靠性的额外确认。 双向信号:ProEngulfing提供两种不同的信号模式 - 在方向和反向方向。用户可以通过图表上的按钮轻松切换这些模式。 在方向模式中:在触及或回溯移动平均线时显示吞没模式。 反向方向模式:显示在移动平均线上方一定距离处发生的熊市合格吞没模式,表明市场可能发生逆转。 回测功能:P
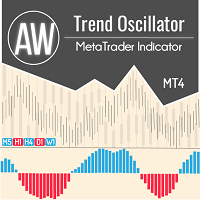
具有高级过滤系统的趋势振荡器。它决定了趋势,它的减弱和增强。有一个内置的多时间框架面板。 AW 趋势振荡器适用于任何时间框架和任何符号(货币、指数、石油、金属、股票)。 MT5 version -> HERE / Problem solving -> HERE 特点和优点:
高级趋势过滤 一键更改指标的灵敏度 易于设置 多时间框架面板 能够移动和最小化面板 适用于任何符号和任何时间范围。 各种通知 输入设置: 指标周期 - 指标周期,数值越大,指标信号的敏感度越低,
发送推送通知 - 使用移动版交易者终端的新信号通知,
发送弹出警报 - 在警报时使用声音通知,
发送电子邮件 - 使用向交易者的电子邮件发送有关信号外观的电子邮件,
显示多时间帧面板 - 启用面板显示,
多时间框架仪表板 - 面板视图,最小化或完整,
面板中的字体大小 - 指示器面板上的文本大小,
Up color main - 上涨趋势加强时的颜色,
Up color second - 上升趋势减速时的颜色,
Down color main - 下跌趋势加强时的颜色,
Down col
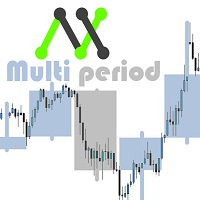
With this customizable indicator you will be able to observe other timeframes besides the usual one. This way you will get to know better the general environment in which the price moves and probably will be better your effectiveness. *It is important that the timeframe in the indicator is greater than that set in Metatrader. I'll share more indicators for free soon. If you have any specific ideas of an indicator that you want to have you can write me a private message directly. Opinions, review
FREE
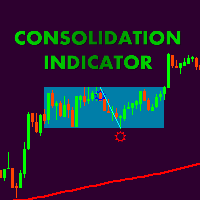
Сonsolidation box indicator with possibility of flexible settings according to the traiders requipments. Also, it is possible to embed indicatior in EA. Thank Alexey Mavrin for realization of technical task. According to the classic technical analysis the price is in motion without a clear direction for almost 70% of the market time and methods of getting profit from flat should be in the arsenal of any trader. Price consolidation- are periods of market equilibrium when supply and demand are app
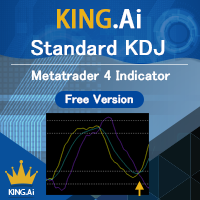
The standard KDJ indicator is presented by KING.Ai. This indicator were built base on the the theory of KDJ . KDJ is a very effective and useful strategy to trade especially in swing trading. Method to apply (please also refer to the graphic): 80/20 rule: Price from bottom to top 20 to 80. And price from top to bottom 80 to 20. Both is enter market signal. Indicator period: The indicator is made by period 9,3,3 KING.Ai Forex trader believe that such strategy must complement with other indicato
FREE

Fact shows favorable moments for entering the market. The indicator can work both for entry points, and as the filter. Uses two settings.
This is a hybrid trend indicator, as it is based on the signals of elementary indicators and a special algorithm for analysis. The intelligent indicator algorithm accurately detects the trend, filters market noise and generates input signals.
The indicator uses a color alarm: blue - when changing from descending to ascending, and red - on the contrary, to

SETI is a Break indicator multipair searching SETI is a powerful indicator of for any par and any timeframe. It doesn't requires any additional indicators for the trading setup.The indicator gives clear signals about opening and closing trades. This Indicator is a unique, high quality and affordable trading tool. Can be used in combination with other indicators Perfect For New Traders And Expert Traders Low risk entries. Never repaints signal. Never backpaints signal. Never recalculates
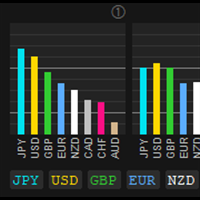
CS Info [Currency Strength Information] CS Info is the real-time MTF calculation of 28/34 symbols for the strength of 8 currencies/XAU - AUD, CAD, CHF, EUR, GBP, JPY, NZD, USD and XAU. It analyses the trend or momentum/strength of all 8 currencies and XAU to determine high probability currency combinations and trading opportunities.
Key Features Floating position - with click on Control to select and move
Mode A/Mode B for presentation of CS Calculation FX or FX/XAU to change FX or FX/XAU
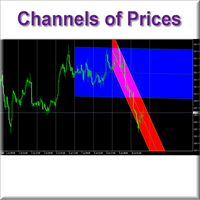
Hello this Indicator will draw Channels to help you to take decision to buy or sell or waiting you can show one channels or two or tens of channels if you want please watch our video for more details https://www.youtube.com/watch?v=5Cq_l9I3Yr0 good luck -------------------------------------------------------------- السلام عليكم هذا المؤشر يرسم قنوات سعرية لمساعدتك على اتخاذ قرار الشراء أو البيع أو الانتظار يمكنك عرض قناة واحدة أو قناتين أو عشرات القنوات إذا أردت يرجى مشاهدة الفيديو لمزيد من التف

The Deviator trend indicator in calculations uses reliable algorithms. It shows favorable moments for entering the market with arrows, that is, using the indicator is quite simple.
Shows successful signals - can be used with an optimal risk ratio. The indicator can be used both for pipsing on small periods, and for long-term trading.
It uses only one parameter for setting, which sets the number of bars for calculation.
It works on all currency pairs and on all timeframes. Of course, the a

The Trend ADW indicator can be used both for piping for small periods and for long-term trading. When using, it is recommended to look at an additional indicator for a filter of possible false signals.
The indicator shows the direction of the trend, signaling this using pivot points. It can be used with an optimal risk ratio. The arrows indicate favorable moments and directions for entering the market. Uses one parameter to adjust (adjust from 1 to 3). It works on all currency pairs and on al
BBMA Dashboard Fx This is a Multi pair and Multi time frame dashboard. The founder of the system is Mr. Oma Ally, which is a system based from Bollinger Band and Moving Average( BBMA ).
BBMA consists of the use of 2 indicators: Moving Averages Bollinger Bands BBMA consists of 3 types of entries: Extreme MHV Re-Entry This Dashboard Help you to scan current Extreme and Reentry setup ( MHV not included).
The features of BBMA Dashboard : 1.Current TRENDS in Market Based on BBMA method.

Teknolojide ki yüksek gelişim, üretim, e ticaret, lojistik vb tüm sektörlerde kullanıma başlandığı gibi artık finansal piyasalarda da “ yapay zeka ve algoritma” kullanılmaya başlandı. Smart Algoritma indikatörü; kaynak kodu içinde yer alan algoritma ve yapay zekası ile hiçbir analize ihtiyaç duyulmadan gün içi bütün forex enstrümanları için size buy ve sell sinyalleri yanında hedef kanal (gün içi en yüksek ve en düşük seviyeler) verir. İndikatör texti aşağıda ki bölümlerden oluşur ve herkesin a

Smart Gread Ultimate Edition (SGUL) indicator - based on smart order grid strategy.
Maximum customization and flexibility of strategies are the main features of this indicator.
In the right corner there is a table with the number and volume of orders.
List of adjustable parameters:
K: 2.0 - Factor of the next order increase (if the price moves in the other direction).
TP: 50 - The number of points at which the order is closed with a profit (minimum profit per 1 lot).
Step: 80 -

パラボリックのデータをもとにトレンドの方向性を1分足から月足まで表示します。 1分足から 月足 まで表示されているので今どの方向に価格が動いているのかがすぐに分かります。 更新はティク毎ではなくディフォルトでは1秒毎、もちろん変更も可能なのでチャートの表示が遅くなるようなことはありません。 機能: どの通貨でも表示可能になります。 パラボリックの数値を変更することは可能になります。 上昇時と下降時のアイコンの色を指定することが可能になります。 表示位置(Y軸)が変更可能 になります。 表示位置 (左上 、 右上 、 左下 、 右下) が 指定 が可能 になります。 フォント を指定することが可能になります。 フォントサイズ が 変更可能 になります。 アイコンのサイズ が 変更可能 になります。 週足、 月足 の非表示 が 可能 になります。
FREE
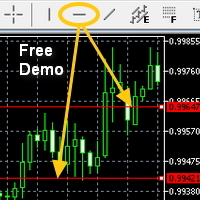
Attach the indicator on the chart and draw the red line from the button on MT4's built-in menu bar then the alert will be sent to you(push,email,popup and sound ) This demo version works only on USD/CHF
Please find the version here MT4 - https://www.mql5.com/en/market/product/43120
NT5 - https://www.mql5.com/en/market/product/43021 Hi You all know the red line (the MT4 built-in red line) drawn from the menu bar on MT5. It is often used
FREE
SYSTEM INTRODUCTION: The Binary Options Conqueror System Is Specifically Designed For Binary Options Trading. Unlike Other Systems And Indicators That Were Adopted From Other Trading Environments For Binary Options. Little Wonder Why Many Of Such Systems Fail To Make Money . Many End Up Loosing Money For Their Users. A Very Important Fact That Must Be Noted Is The Fact That Application Of Martingale Is not Required. Thus Making It Safer For Traders Usage And Profitability. A Trader Can Use F

This algorithm is created for you to receive alerts as to when the green stochastic line has crossed above the red stochastic line to launch a long trade and vice-a-versa for short trades. This indicator is a work horse for your profit picture! HOW TO USE 1. When the green stochastic line has crossed above the red stochastic line with a green background, this is an ideal place for a long entry. 2. When the green stochastic line has crossed below the red stochastic line with a red background, thi
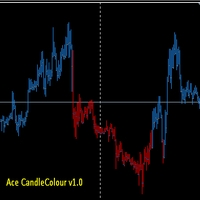
if you prefer to trade manually on forex, maybe this can help you to analyze and when to open orders. u can use anytimeframe and pair forex , how to use it ? simple Blue Colour = Trend is Up White Colour = Trend Sideway Red Colour = Trend is Down Timeframe recommend m15 - day 1 When is the order start time? for example, if the color now comes out blue, wait for shift candle 3 after the last color comes out. if the color is still the same and does not change immediately open a buy position.
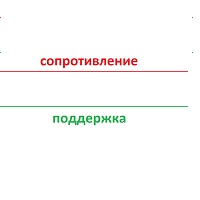
Торгуя на рынке форекс, многие используют уровни поддержки сопротивления убеждая себя что, если цена закрепится выше-ниже уровня, рынок пойдет далее по направлению-данное убеждение работает только в том случае, если учитывается направление движения рынка с более старшего временного интервала! Исходя из выше сказанного был написан индикатор уровней который рассчитывается по математической формуле Индикатор уникален тем, что он помимо основных уровней, учитывает и уровень с более старшего временно
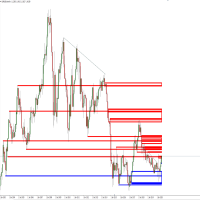
This product makes your trend lines perfectly horizontal and brings them to present automatically. SPEND YOUR TIME TRADING AND NOT FORMATTING TREND LINES! Makes for the cleanest of charts! This product is ideal for S/D, S/R, and other technical analysis styles! The most important part is that you won't know how you ever traded with out it! First month is free!

NEW YEAR SALE PRICE FOR LIMITED TIME!!! Please contact us after your purchase and we will send you the complimentary indicators to complete the system Cycle Sniper is not a holy grail but when you use it in a system which is explained in the videos, you will feel the difference. If you are not willing to focus on the charts designed with Cycle Sniper and other free tools we provide, we recommend not buying this indicator. We recommend watching the videos about the indiactor and system before pu

Advanced version of CyberZingFx Volume Plus, the ultimate MT4 indicator for traders seeking highly accurate buy and sell signals. With an additional strategy and price action dot signals that enhances its effectiveness, this indicator offers a superior trading experience for professionals and beginners alike. The CyberZingFx Volume Plus Advanced version combines the power of volume analysis and historical price data with an additional strategy, resulting in even more precise and reliable signals
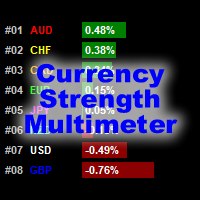
貨幣強度萬用表指示器顯示以下每種貨幣的強度,方向和等級: AUD CAD CHF EUR GBP JPY NZD USD 此外,它還顯示以下每種貨幣對的強度,方向和等級: AUDCAD AUDCHF AUDJPY AUDNZD AUDUSD CADCHF CADJPY CHFJPY EURAUD EURCAD EURCHF EURGBP EURJPY EURNZD EURUSD GBPAUD GBPCAD GBPCHF GBPJPY GBPNZD GBPUSD NZDCAD NZDCHF NZDJPY NZDUSD USDCAD USDCHF USDJPY
該指標適用於任何圖表和任何時間範圍。每個貨幣和貨幣對的強度,方向和排名數據都可以通過指標緩衝區訪問。您可以將指標拖放到圖表上以顯示所有信息,也可以將指標配置為僅顯示其所在特定圖表的貨幣和貨幣對。
數據顯示為貨幣和貨幣對的水平條形圖。它還顯示僅針對貨幣的連續折線圖
指標輸入和默認值如下: BarsLimit = 60-計算中使用的條數。 Hours = 1-計算中使用的小時數。 ShowAllCurrencyPairs

Based on a combination of indicators, E13 Acid Fulx is an excellent indicator for knowing when to buy or sell on any asset and temporaryity. The indicator myself I have used it as a tool for my analysis when trading Forex. It is a useful and easy-to-understand trend indicator. If you combine it with your own analyses you will surely get a good result in your operation.
FREE

Buy and sell signals using the MACD histogram. The interface is simple and easy to understand. You can perzonalize the indicator in several ways according to its visual style or even more importantly, its setting of parameters to detect market signals. Using the Multiplier option in the menu you can increase the indicator period although it is recommended to use the default settings.
FREE

Based on a combination of indicators, PS Acid Fulx is an excellent indicator for knowing when to buy or sell on any asset and temporaryity. The indicator myself I have used it as a tool for my analysis when trading Forex. It is a useful and easy-to-understand trend indicator. If you combine it with your own analyses you will surely get a good result in your operation.
FREE

The principle of this indicator is very simple: detecting the trend with Moving Average, then monitoring the return point of graph by using the crossing of Stochastic Oscillator and finally predicting BUY and SELL signal with arrows, alerts and notifications. The parameters are fixed and automatically calculated on each time frame. Example: If you install indicator on EURUSD, timeframe M5: the indicator will detect the main trend with the Moving Average on this timeframe (for example the Moving

Cluster indicator working in the price channel. For operation, the indicator builds a channel line - (dashed line).
Inside the channel, cluster sections are determined that determine the direction of the price movement - (histograms in two directions),
start with large arrows. Small arrows are plotted above / below each histogram - indicator increase volatility.
The indicator does not redraw the values.
Works on any tools and timeframes. Entrances are made when large arrows appear, inside s

The Reaction indicator forms arrows (by default, red and blue). The indicator is set in the usual way to any trading symbol with any time interval.
This is an indicator of trend and trading signals, based on the principle of a combined analysis of calculated reference points within the channel as well as overbought and oversold levels.
Input parameters Period - indicator period; LevelUp - overbought level; LevelMid - balance level; LevelDown - oversold level.
Indicator Benefits High accur

The indicator is designed to trade binary options on small time frames up to m 30 Signals The blue up arrow is a buy signal. The red dn arrow is a sell signal. The signal will appear together with the advent of a new candle and during formation Signals on the current candle Expiration time one candle from the timeframe on which you are trading You can use moving average to filter out false signals. Or escort support levels. This tool is reliable in trading.
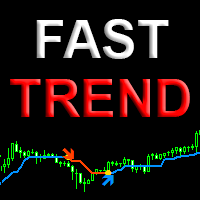
Fast trend is a professional version of the trend direction indicator and entry points. The indicator with high probability determines the direction of the trend on any currency pairs, stocks, cryptocurrency without redrawing the result. To determine the trend, it uses Price action and its own unique filtering algorithm. Suitable for all types of trading, both for scalping and for long-term trading. This version of the indicator is another branch of the evolution of the Simple Trend indica

The Fixed Event indicator shows points for entering the market, points of potential market reversal.
The indicator combines several progressive algorithms. Combined systems for analyzing historical data are projected onto lines in the form of straight lines connecting extremes. That is the pivot point of the market. These extremes or pivot points of the market can be used as level lines! Which is very convenient for finding support and resistance lines. Ready trading system.
Uses one parame

The key difference between the Trend Canal indicator and other channel indicators (for example, from the Bollinger indicator) is that Trend Canal takes into account not simple moving averages, but twice smoothed ones, which allows one to more clearly determine the market movement, and on the other hand makes the indicator less sensitive. Trend Canal is a non-redraw channel indicator based on moving averages.
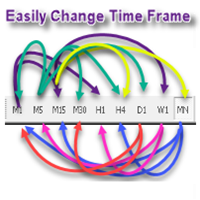
Hello this Indicator can Change TimeFrame easily and faster for current chart only or for all charts in same time (very fast) you can change it by press any number from 1 to 9 please watch our video https://www.youtube.com/watch?v=f6jWz_Y7dMs good luck -------------------------------------------------------------- السلام عليكم هذا مؤشر لتغيير الفريم للشارت الحالي او لجميع الشارتات بشكل اسرع وأسهل يمكنك تغيير الفريم بالضغط على اي رقم من 1 الى 9 بحيث يتمت غيير فريم الشارت الحالي فقط او جميع الشار
Check out other great products from https://www.mql5.com/en/users/augustinekamatu/seller
This indicator is the best so far at estimating reversal points especially on high time frames. It does not repaint and is based on a combination of moving averages computed using custom functions. No inputs required, it is simple plug and play. The principles used ensure that it can be used on CFDs, Commodities and Stock with incredibly great results. With proper money management and portfolio balancin
FREE

The indicator informs when the current bar closes and a new bar opens. TIME is an important element of trading systems. BarTimerPro indicator helps you CONTROL THE TIME . Easy to use: place on the chart and set “alarms” if it necessary. In the tester, the indicator does not work. Key Features
Shows the time elapsed since the opening of the current bar Indicator Updates Every Second Setting the appearance (31-36) and the location (21-24) of the indicator, changing all texts (41-50). 4 types of
FREE
The indicator informs when the current bar closes and a new bar opens. TIME is an important element of trading systems. BarTimerPro indicator helps you CONTROL THE TIME . Easy to use: place on the chart and set “alarms” if it necessary. In the tester, the indicator does not work. See the Lite version BarTimerPro-Lite
Key Features
4 operating modes: Shows the time elapsed since the opening of the current bar (11) Shows the time remaining until the current bar closes (11) Indicator Updates Ever
FREE
本指标用来关闭或开启价格标尺和时间标尺。选择true为显示标尺,选择false为关闭标尺。(价格标尺关闭后,再开启有可能显示全不。但可以通过周期切换的方式解决。) 本指标 设置了D 和P 两个标签,可以实时的通过点击开启或关闭标尺。相关的参数可以自定义修改,如标签的名称、位置、坐标等。....... labD_Window = 0 标签显示的窗口选择 labD_Corner = 0 标签 显示的 角落选择 abD_X = 0 标签 显示的 横轴距离 labD_Y = 35 标签 显示的 竖轴距离 labD_Txt = "D" 标签 显示的 文字 labD_FontSize = 11 标签 显示字体的大小 真是奇葩的描述字数限制,系统要求至少300个字。剧情不够只能掺水了。
FREE
Fully automated Forex Expert advisor that trades with accuracy. With volatility it executes pending orders and secures the safe entry .
No special indicator is used.
Just catch the market movement with special algorithms Recommended pair is Eur/Usd
Can be started with only $50 1% to 2% Draw Down only 20% to 25% monthly return Tight SL with good TP Developed for Metatrader 4
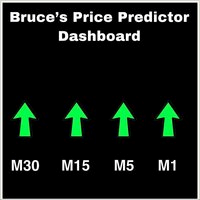
This is a Dashboard Indicator based on Bruce's Price Predictor Indicator . This Dashboard will Give you a visual to see the trend direction without having to flip through timeframes, so you can always be trading in direction of the trend, with little effort. I Recommend www.CoinexxBroker.com as a great broker and the one I personally use
*Non-Repainting Dashboard Arrows *For Desktop MT4 Only *Great For Scalping *Great For Swing Trading *Dashboard Arrow Entry Alerts *Dashboard Arrow Signals

Please check the " What's new " tab regularly for a complete and up-to-date list of all improvements + parameters. FREE indicator for my trading utility Take a Break . This indicator allows you to manage multiple other EAs with just one Take a Break EA instance. Simply specify the corresponding Chart Group in the indicator(s) and Take a Break EA settings and you are good to go.
Setup example (Indicator + EA)
You want Take a Break to manage 3 other EAs: EA1 on EURUSD, EA2 on EURGBP, EA3 on G
FREE

The Currency Strength Breakout indicator monitors eight currencies across M1, M5, M15, M30 & H1 time frames all in the same window.
Trade the strongest currency against the weakest with alerts for pullbacks giving you the opertunity to enter the trend. Please note: I have made the decision to give this Indicator away and many more for free with limited support so that I can concentrate on Custom EA.
View More Products - https://www.mql5.com/en/users/robots4forex/seller#!category=1
Monitoring
FREE
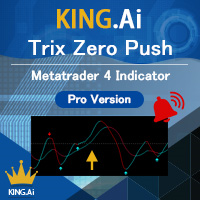
The brand new trading indicator using TRIX strategy is exclusive presented by KING.Ai. Exclusive Functions including Mobile Push Notification . This indicator with Three-mode alerts is developed by KING.Ai ONLY. It is probably impossible that you could find a TRIX indicator like this one. It is very difficult for you to trade with the Trix strategy as there is limited time for traders to monitor every currency. However, the Trix strategy is very profitable especially using in DAY CHAT. It
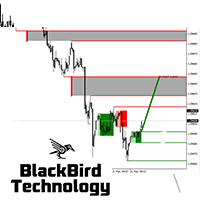
Multi Signal Indicator contains a whole series of intersting buy,sell and exit signals that can be separately turned on/off. Signals : Liquidity Pools Liquidity Pools Forecast Projection Reversal Blocks Pinbar groups Overbought/Oversold with Moving Average Band (5 MA bands) Moving Average Difference Liquidity is an important aspect in the market, especially for institutional investors, as they need lots of liquidity to enter or exit the market. Therefore, institutional traders focus more on dema
指标功能:完成十字光标跟随,多个窗口鼠标位置的同步显示。 功能 开启 :点击"H"标签,标签变成"S",开启十字光标,通过鼠标点击,完成第二个以上窗口的位置同步。 可以大周期同步小周期 (注意:在大周期同步小周期时,要注意小周期中的数据是否足够多) , 也可以小周期同步大周期。 功能关闭:点击 "S"标签,会变成"H"。或者通过键盘的"ESC"键,关闭。
指标可以多个窗口加载,也可以单窗口加载。
参数设置: LabWindow:标签显示的窗口 LabConer :标签显示的角落位置 LabX :标签位置横坐标 LabY :标签位置竖坐标 LabShowBackup :标签背景显示于背景 LabFontName :标签的字体名称 LabFontSize :标签的字体大小
FREE

Este indicador Tick Bid Transaction identifica las ventas que ofrece tu Broker. Relaciona el volumen “no real” y los Ticks de la demanda de un cierto modo, luego el algoritmo marca con un punto donde se realiza una transacción, según el tamaño del punto significa que la venta es mayor o menor o, hubo muchas ventas al mismo tiempo lo que nos dice que si el punto es muy grande es muy probable que el Activo baje como así también si hay una cierta acumulación de puntos de diferentes tamaños. Este in

Este indicador Tick Ask Transaction es representado en una ventana separada tick a tick del Ask e identifica las compras que ofrece tu Broker. Relaciona el volumen “no real” y los Ticks de la oferta de un cierto modo, luego el algoritmo marca con un punto donde se realiza una transacción, según el tamaño del punto significa que la compra es mayor o menor o, hubo muchas compras al mismo tiempo lo que nos dice que si el punto es muy grande es muy probable que el Activo suba como así también si hay
DPPD(動態價格百分比偏差)是遵循“低買高賣”規則的簡單有效指標。 指示器可以發送電子郵件,警報和MQL ID推送通知。也可以將個人通知設置為任何偏差級別。 單個通知可以具有並添加單個評論。 DPPD為什麼動態?因為不是從靜態點測量偏差。偏差是相對於給定平均值的價格偏差(以百分比表示)。 任何時間段的建議設置為200日均線,根據一般共識,這是一條很大的波動和趨勢,但是其他任何設置也可能有效,如果使用得當,則非常有效。 該指標將在任何時間點通知交易者價格低於或高於給定平均值的多少。 指標適用於所有時間範圍,可以使用任何類型的價格和任何移動平均線方法。 指標的每個級別均設置為10%偏差,以便更容易發現極端偏差。通常,最佳買賣機會從10%開始。
MetaTrader 市场 - 在您的交易程序端可以直接使用为交易者提供的自动交易和技术指标。
MQL5.community 支付系统 提供给MQL5.com 网站所有已注册用户用于MetaTrade服务方面的事务。您可以使用WebMoney,PayPal 或银行卡进行存取款。
您错过了交易机会:
- 免费交易应用程序
- 8,000+信号可供复制
- 探索金融市场的经济新闻
注册
登录