 MetaTrader 5
 专家
 指标
 程序库
 实用工具
 窗口小部件
 规则
适用于MetaTrader 4的新技术指标 - 146
 下面列出的技术指标信号对MetaTrader 4平台的开仓交易和平仓交易起着至关重要的作用。
指标的本质就是一种交易品种的数学转换,旨在预测价格变化。

If you trade or wish to trade the popular HLHB Trend-Catcher System, then this indicator is for you! It detects when the HLHB system entry rules are met and sends out an alert in the form of notifications to your mobile phone and to your pc. By automatically sending you notifications, this indicator lessens your trading work load as you don't have to sit in from of your pc all day checking all the chats for when the entry rules are met. This indicator does all the dirty work for you. When the si
FREE
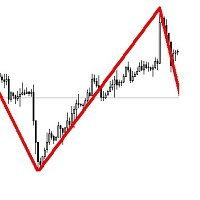
Have you ever wanted to be able to catch a trend just as it is beginning? This indicator attempts to find the tops and bottoms of a trend. It uses in-built indicators and studies their reversal patterns. It cannot be used on its own it requires Stochastic(14) to confirm signal. Red for sell, Blue for buy. There are no parameters required just attach to a chart and it is ready to go. Check out other great products from https://www.mql5.com/en/users/augustinekamatu/seller A Winning Trading Stra
FREE
KijunSen vs Price Ichimoku Strategy MM Description in English and Italian =
This Indicator is based on one of the Strategies with Ichimoku Indicator, in particular is the cross of the KijunSen with the Current Price; it will give you of Buy and Sell when they Cross, with Arrows and Alerts.
When you attach the indicator on the chart , a window will open where , in the INPUT section, you can also choose to change the main Ichimoku values.
SIGNAL INPUT =
· BUY = when Price cross above the K

Ultimate Price Predictor (Trade like a pro) Message Me Immediately After Purchase For Installation Help and Strategy
This is an arrow indicator that shows precise price reversals. A great arsenal to add to any chart.
Ultimate Price Predictor points price reversals with high degree of accuracy and it is great for scalping on the 5min time frame, Or swing trading on the 1hr time frame. Buy and sell arrows are shown on the chart as for entry signals. They do not repaint. *Great For Scalping *Grea
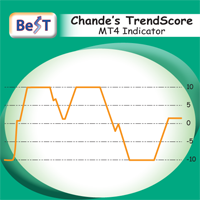
BeST_Chande TrendScore Indicator points the start of a trend with high degree of accuracy and it is amazing for scalping on the 1min timeframe. It is also a simple way to rate trend strength. It indicates both the direction and strength of a trend and can be easily combined with various trend-following, swing and scalping strategies. As of a trend’s direction and strength a value of +10 signals a strong uptrend while a value of -10 signals a strong downtrend. Generally a positive score show

Каждый трейдер должен периодически проводить анализ результатов своей работы на валютном рынке, чтобы выявить сильные и слабые стороны своей системы. Для этого было бы не плохо видеть всю статистику в понятных глазу цифрах, желательно объединенных в табличную форму, чтобы оценка стала более детальной, была возможность узнать текущую доходность, просадку, профит фактор и многие другие характеристики. Существует множество серверов в интернете, которые могут создать мониторинг вашей торговли, обр
The most effective signals generated by Ichimoku strategies. Ichimoku Trade Alarm is a supplement for Ichimoku Trade Panel and it shows the signals that Expert Advisor reacts to.
Visualization of signals: Price / Kijun sen cross - the candle body must be between Min_Candlestick_Body and Max_Candlestick_Body. The candle must close above / below Kijun sen, minimum in 1/3 of its body. Open candle must be located above / below Kijun sen. Chinkou span must be under the price of 26 periods in advanc
Colored candlesticks showing the trend. Based on the price action, it shows the trend and the possible moment of reversal.
No settings required. You can change the colors according to your preference.
Red and green show a trend beginning. The other two colors indicate a withdrawal or a contratrend. The indicator is used with resistance or support analysis. Make sure you use SL and TP, according to the price action.
首先,我要感謝大家“Adamant Levels Logic A”取得的巨大成功
有關邏輯A的更多詳細信息,請參閱以下鏈接:
https://www.mql5.com/en/market/product/36082
在成功之後,我很有信心,這個“Adamant Levels Logic B”指標也將在您成功的交易運營商中發揮重要作用。
堅定級別簡介:
免責聲明: 如果您正在尋找一個花哨,色彩鮮豔,引人注目的指示,請遠離。
沒有考慮價格可以保持,反彈或突破的水平,任何交易者都不能成為一個好交易者。
這些水平幫助交易者以更便宜的價格進入市場。它們可以是支撐阻力,需求供給,支點,斐波納契水平等。
經過多年對價格圖表的研究和分析,我發現很少有復雜的算法和邏輯來找出未來可能的價格行為。
在某些價格點上應用這些邏輯和算法,我達到了價格可以反彈或突破的水平。
我將它們命名為“Adamant Levels”。
是的,它們本質上是堅定的和靜態的。
價格被這些水平吸引並擊退。
這些是未來的價格行為水平,交易者可以通過更高的風險回報率進入市場。
大多數觸發點如價格模

该指标是两个改进的Lanczos滤波器的组合。 第一个过滤器用于推断价格。根据过去的价值,他预测当前柱内可能的价格变动。也就是说,它表明如果过去的趋势保持不变,价格会是多少。 第二个过滤器,用于平滑和平均窗口内的价格,由过滤器的级别决定。由于选择了权重,此过滤器最积极地响应价格变动中存在的周期性组件。 可以使用EF和IF参数调整指标。通过选择 EF 和 IF 的值,您可以获得有关趋势价格变动开始的信号。 EF - 指数滤波器的窗口大小。有效值为 EF = 0 ... 255 。并且在计算期间处理的条数是 2 * EF + 1 。该参数越大,价格序列的过去价值的影响越大。结果以实线绘制。 IF - 调整平均窗口的大小。 IF = 0 ... 255 的值。要计算的条数是 2 * IF + 1 。 IF 值越大,使用此过滤器检测到价格变动的较长时段。结果以虚线显示在图表上。

ShangXia-指标适合所有的周期使用,也适合所有的市场品种。
【ShangXia】向上的箭头是(Buy)信号。 【ShangXia】向下的箭头是(Sell)信号。 【ShangXia】可以在参数里面设置(Alert、Send mail、Send notification),设置为(true)就可以发送即时信号到警报窗口、电子邮件、即时消息。 参数设置说明: 【alert_NO_OFF】:这是警报开关,设置成true,如果出现箭头就会自动警报提示;设置成false,则不会警报提示。 【sendmail_NO_OFF】:这是发送邮件的开关,设置成true,如果出现箭头就会发送邮件到你在MT4设置好的邮箱里面;设置成false,则不会发邮件。 【sendnotification_NO_OFF】:这是发送即时消息的开关,设置成true,如果出现箭头就会发送消息到你的移动设备;设置成false,则不会发消息。 更多好用的指标网址: https://www.mql5.com/en/users/zhengqiuyang/seller

该指标是基于中值和移动平均特性的组合的顺序混合滤波器。
使用中值允许滤除价格序列值中的异常异常值和随机脉冲。同时,中值滤波器不会对价格变动的趋势起作用,而是保持不变。 由于中值滤波器是非线性的,因此使用简单移动平均值进行平均来平滑其值。这种方法使我们不仅可以更准确地识别趋势,还可以更准确地识别价格变动中的周期性成分。此外,它还增加了指标对价格变化的敏感度,并减少了价格序列与指标读数之间的延迟。因此,指标可以相当准确地警告新趋势的开始,以及旧趋势的结束。
您可以使用 FL 参数调整滤波器的深度及其灵敏度。其允许值为0到63.同时, 2 * FL + 1 条用于计算指标值。因此,FL值越大,指标显示价格图表的趋势越强。
这种多时间框架和多品种背离仪表板指示器会在在多个时间框架而不是单个背离中识别出一个或两个不同的背离时发送警报。它可以用于从 M5 到 MN 的所有时间范围。可以启用移动平均线或 RSI 趋势过滤器以仅过滤掉最强的设置。结合您自己的规则和技术,该指标将允许您创建(或增强)您自己的强大系统。 特征 可以检测以下振荡器/指标的背离:MACD(信号线或主线(直方图))、随机指标、OsMA、RSI、CCI、Awesome、OBV、ADX、ATR、MFI、动量和加速器。 可以选择要在仪表板中显示的时间范围。 在仪表板内持续执行发散等级排序。可以禁用此排序,以便更轻松地找到特定符号。然后,交易品种将按照它们在交易品种参数中输入的相同顺序显示,或者按照它们在市场观察窗口中的显示顺序显示。 通过在矩形内单击,将打开一个带有相关交易品种和时间范围的新图表。 指标可以将信号写入全局变量,智能交易系统可以使用这些变量进行自动交易。比如 这个产品 。 将指标放在一张图表上就足够了,您将收到来自您选择的任何交易品种的警报。支持所有 Metatrader 原生警报类型。 将考虑常规/经典(趋势逆转)和隐藏(趋势延续

Trade with Gann on your side!! MASTER CIRCLE 360 CIRCLE CHART, originally created by Gann admitted that this is “The Mother of all charts”. It is one of the last studies that this great trader left for us. The numeric tab le is apparently quite simple like all the tables and is based on square numbers, the SQUARE OF 12 and is by evolution, one of the most important square numbers. Here we can find CYCLE, PRICE AND TIME thanks to angles and grades, to show past and future support and resistance.
Demark Sequential - is an indicator that shows a structure of the trend, its start point and main turning points. And it check it's conditions on the beginning of the candle, so it will be never repainted.
This indicator hasn't any complex formulas, only some bars countdown, but it can be very helpful, especially with some levels indicator such as Fibo or Gann levels (like this ). Algorithm is so simple, but powerful: Setup - starting when current bar closed higher (or lower for short) then clos

Introducing AMAN Signals.
An MT4 Indicator that predicts the trend where the prices are heading!
Indicator parameters Period 1 : the number of bars used for the indicator calculations. Proper values - Above 21. Multiplier 1 : Proper values - from: 5. Period 2 : the number of bars used for the indicator calculations. Proper values - Above 21. Multiplier 1 : Proper values - from: 5. Using the AMAN Signals FAST Indicator: Green: Buy or Bullish Candle Red: Sell or Bearish Candle Strength Percentag

A technical indicator that displays information about the trading volume in the form of a histogram of distribution by price levels. It is used as an independent indicator that helps to evaluate the current objective situation of the instrument, as well as in the format of integration with other methods of analysis, to confirm or filter when making trading decisions. Key Features:
Interactive profile update, real-time work Five modes of histogram calculation The possibility of separating the vol
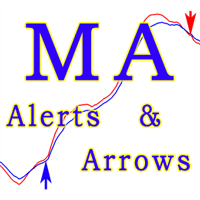
This indicator MA Alerts with Arrows gives you the opportunity to receive signals about the intersection of two moving averages (Moving Average), as well as signals about the price rollback to MA - to enter the transaction. Alert options: Sound and text alerts (alert). Push notification to the mobile terminal. Email notification (message to your e-mail). Visual alert (arrows on the chart). The indicator has the following features: To display or hide the moving averages and arrows themselves. T
Индикатор отображает размер бара и его направление. ---------------------------------------- Цвета гистограммы: * Красный - Медвежий бар.
* Зелёный - Бычий бар.
* Серый - Цена открытия и цена закрытия равны. * Синяя линия - скользящая средняя.
---------------------------------------- Параметры: - Type of Calculation - Тип расчёта ( Low to High, Open to Close ) - Moving Avarage - Период скользящей средней
FREE

Entry and Exit indicator simplifies the trading process by automatically providing the entry price and the take profit price with the appropriate stop loss. The indicator constantly monitors the market for the right entry conditions and send outs signals via push notifications to the trader's mobile phone or pc as desired. Hence a trader do not need to watch the chart all day but only act when signals are sent. This indicator is built around the 'H4 Engulfing System' and the 'Triple Stochastic S

This indicator show you the begin of the Trend by drawing (Up/Down) arrow. It works using compatibility of current fame and the next 3 frames to make it more professional and more profitable. Features:- Simply it gives you entry point as arrow (Buy / Sell) after candle closed. You can use it on time frames ( M1 , M5 , M15 , M30 ) are more profitable. You can use it on any currencies pair. It is historical indicator. No Repaint. No additional indicator needed. Easy to use.
Indicator parameters:-

This indikator is used as a supporting indicator. its function is to find out the position of the price reflection position, but he cannot work alone, requires another set of indicators which will immediately be sold separately
The principle of Supply And Demand can be used as a forex trading analysis tool. One way to use it is to rely on the balance zone as zone stops Supply And Demand and the trading system applied, as well as the legal basis for general supply and demand.

Pattern Explorer is a reliable tool for applying all the power of the most popular Japanese Candlestick Patterns . It uses Machine Learning algorithms to confirm all the patterns. What is the most impressive thing about it? Select Take Profit and Stop Loss and click on “Backtest your strategy” button to backtest your strategy in real time and to see according to your selection: Total signals Testable signals (signals that are reliable to be tested) Profitable signals (%) Loss signals (%) T
Χ15 indicator is a MetaTrader 4 tool that allows you to BUILD & BACKTEST ON REAL TIME your own strategies quickly, easily and efficiently. It contains 15 of the most popular technical analysis indicators that you can use, each one in a different way. Choose the indicators that you want to use, select how you will use them and you will see on the chart BUY (green) and SELL (red) arrows implementing your strategy. Choose Take Profit and Stop Loss and you will see the results of your strategy w

T-Explorer is a Real Time Optimized MetaTrader 4 tool that provides tradable information based on the 10 of the most popular and reliable technical indicators in many timeframes. Our machine learning models calculate the optimum rules and configuration for each indicator in order to provide high probability signals of success. Users are able to customize T-Explorer by selecting suitable timeframes and mode ( FAST, MEDIUM, SLOW ) for the indicators to be used. T-Explorer aggregates an

Currency Explorer is the absolute tool for traders that want to know with quantified certainty the currency strength & weakness of each currency and to trade these by using applicable strategies. Our machine learning models run and provide the strength/weakness of each currency based on multiple factors besides price action. It provides the trader with a QUANTIFIED result for the strength of the 8 most popular and major currencies (EUR, USD, JPY, GBP, AUD, NZD, CAD and CHF) with a scale
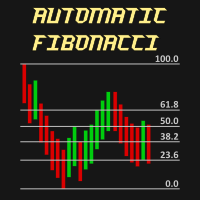
Automatic Fibonacci is an indicator for automatic Fibonacci Levels drawing. It is fully customizable by user. User can also select different Fibobonacci Levels by user settings or can use multiple Automatic Fibonacci indicator in one chart.
All details can be found >>HERE<<
Instructions Move Indicator to the chart (simply drag and drop) When pop up window appears select desired settings. Confirm settings and enjoy the Automatic Fibonacci indicator.
Features Any chart Any time-frame Custom

下一代自动化供需区。适用于任何图表的创新算法。所有区域都是根据市场的价格行为动态创建的。
两种类型的警报 --> 1) 当价格触及区域时 2) 当新区域形成时
你不会再得到一个无用的指标。您将获得一个完整的交易策略和经过验证的结果。
新的功能:
价格触及供需区时发出警报
创建新的供应/需求区时发出警报
推送通知警报
以点为单位的区域宽度标签
关于 MTF 的又一个时间表。因此,现在您将能够看到高于当前 3 个时间帧,而不是高于当前 2 个时间帧
启用/禁用警报/区域/MTF 功能的按钮
您获得的优势:
消除交易中的情绪。
客观化您的交易条目。
通过高概率设置提高您的利润。
节省绘图区域的时间。
像专业人士一样交易金融市场。
任何市场的即时多时间框架分析。
你在图表上看到了什么?
蓝色和红色矩形是当前时间范围的供需区。
虚线样式线是当前上方第一个时间范围内的供需区域。
实线样式线是当前上方第二个时间范围内的

該指標繪製了上個月的開盤價,最高價,最低價和收盤價,為當前月份的較低時段。
這些水平充當了良好的支撐和阻力水平。
大多數時候價格在這個水平內振盪。
等待價格達到這些水平並採取相應行動。
特別注意關卡的融合。
根據我的觀察,如果關閉(白色)水平與任何其他水平匯合,則爆發或反彈的概率很高。
同樣如果Close = open,Open和close比close和low更接近,它是前一個月的錘子,反之亦然。
坦率地說,在現實世界中,不需要這麼多的分析。
只需觀察兩個匯合的級別並採取相應的行動。
根據我的觀察,如果關閉(白色)水平與任何其他水平匯合,則爆發概率很高。
滾動回到前幾個月並觀察這些級別的價格行動以便更好地理解。
輸入參數
沒有輸入參數
打開=顏色綠色
高=顏色洋紅色
低=顏色深卡其布
關閉=顏色白色
享受指標。
FREE

这 出口区域终极版 是一个实用的图表工具,用于显示 每日ATR(平均真实波幅) 和 平均每日波动范围 (ADR) 直接在图表上显示价位,帮助交易者了解资产在一天内的典型波动幅度。通过显示这些价位,可以帮助交易者了解资产在一天内的典型波动幅度。 基于波动率的目标区域 ,该指标回答了一个关键问题:价格今天实际能走多远?该系统根据历史价格走势平均值,绘制出代表当日波动范围的上下边界。 潜在的高低区域 。这使得设置更容易。 盈利目标、追踪止损和每日平仓位 无需猜测 。 该指标计算 ADR ,它衡量用户定义的回溯期内每日最高价和最低价之间的平均距离,以及 ATR ,它考虑了各日之间的任何价格差距。 这两个数值都以水平价格线的形式显示在图表上,并实时更新。交易者可以选择显示其中一个或两个范围,并进行调整。 平均周期 ,并应用 乘数 根据市场情况扩大或缩小区域范围 当价格接近或超过任一边界时,该指标可以发出信号。 通过弹出窗口、移动设备或电子邮件提醒 ,帮助交易者无需时刻盯着屏幕即可

[Deviation of each indicator MT4]集合了18种指标,可以任意选择其中的一种指标来参与计算。能计算出各个指标的背离形态,并且可以提示警报。 参数设置说明: 【indicators】是选择18种指标里的一种参与计算 (这个参数非常重要) 。 【period】是每种指标公共的周期。 【Method】是某些指标的MA模式。 【Apply_to】是某些指标的应用价格。 【Fast_EMA】【Slow_EMA】【MACD_SMA】【K_period】【D_period】【Slowing】这些是部分指标需要的参数,需要这些参数的指标很少。 【Forward_disparity】是K线距离当前低或高的最小距离。 【Forward_count】是向前搜索的最大数。 【***Display form***】向下的是设置箭头和线的大小和颜色。 【alert_NO_OFF】:这是警报开关,设置成true,如果出现箭头就会自动警报提示;设置成false,则不会警报提示。 【sendmail_NO_OFF】:这是发送邮件的开关,设置成true,如果出现箭头就会发送邮件到你在MT4设
FREE
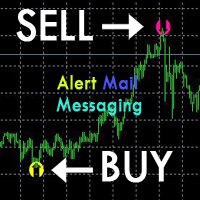
【ZhiBiZZD_MT4】指标适合所有的周期使用,也适合所有的市场品种。 【ZhiBiZZD_MT4】向下的箭头是(Sell)的信号。 【ZhiBiZZD_MT4】向上的箭头是(Buy)的信号。 【ZhiBiZZD_MT4】可以在参数里面设置(Alert、Send mail、Send notification),设置为(true)就可以发送即时信号到警报窗口、电子邮件、即时消息。 参数设置说明: 【alert_NO_OFF】:这是警报开关,设置成true,如果出现箭头就会自动警报提示;设置成false,则不会警报提示。 【sendmail_NO_OFF】:这是发送邮件的开关,设置成true,如果出现箭头就会发送邮件到你在MT4设置好的邮箱里面;设置成false,则不会发邮件。 【sendnotification_NO_OFF】:这是发送即时消息的开关,设置成true,如果出现箭头就会发送消息到你的移动设备;设置成false,则不会发消息。 更多好用的指标网址: https://www.mql5.com/en/users/zhengqiuyang/seller

The indicator shows on the selected range tick volumes in the form of a horizontal histogram Highlights the maximum and most significant price levels near which correction and price reversals are most likely Allows you to conduct trend and counter trend trading using support and resistance levels It works on all timeframes, on any currency pairs, metals and cryptocurrency Can be used when working with binary options Distinctive features Shows the most significant levels of support and resistanc

Stochastic Candles Indicator It will convert the stochastic indicator from separate window to the chart window by drawing oversold-overbought coloring candles. Red is overbought and blue is oversold by default.And you can change the color later on the external indicator setting.This is Multi timeframe indicator that means it can show appearance result from another timeframe.E.g: If you set timeframe H1 then it will draw candles from Timeframe H1 whatever timeframe you attach on. It will be us

The indicator should be used to confirm your trade system, it is not an independent thing for trading, you need to remember this. The indicator is as simple to use as possible and is based on the classic trend definition:
1. Each subsequent maximum is higher than the previous one for the uptrend. 2. Each subsequent low is lower than the previous one for a downtrend. 3. The trend changes when the last high / low breaks through.
The indicator is MTF, i.e. if you are working on M30, you can choos

Определение текущей тенденции - одна из самых важных задач трейдера независимо от стиля торговли. Индикатор Speed Trend поможет с достаточно высокой вероятностью это сделать. В расчетах индикатора используется авторская методика. Speed Trend подходит для любой валютной пары, любого таймфрейма, и не меняет свои показания. Индикатор очень просто в настройке, что является хорошим преимуществом для исследований.
Параметры
Основные настройки ( Main Settings ): IndicatorPeriod - период для рас

vIntelligent algorithm of the indicator TrendWX with accuracy generates input signals and output levels. Strategy for trading on trend, filtering and all the necessary functions built into one tool! The principle of the indicator is to automatically determine the current state of the market, analyze historical data, based on historical data, and display to the trader instructions for further actions. The system itself shows in the form of arrows when to buy and when to sell.
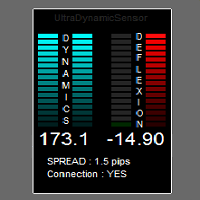
The purpose of the indicator is to measure the dynamics of price movement, capturing sudden acceleration,
and examination of the direction in which the price is moving.
Indicator due to its nature, is dedicated to TimeFrame M1, but it can be freely used on higher TF'ach.
Calculation and display will be identical to the M1.
Indicator all calculations done on ticks, ie single price movements.
Are not taken into account the conditions candle (the color of the candle, the candle shape, values : ope
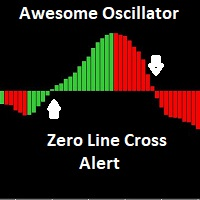
The Awesome Oscillator (AO) is an indicator used to measure market momentum. AO calculates the difference between a 34 Period and 5 Period Simple Moving Average. The Simple Moving Averages that are used are not calculated using closing price but rather each bar's midpoints. This indicator has email and pushup "mobile" features Alert, for any suggestions, please don't hesitate, thanks
FREE

Signals and Alerts for Accelerator/Decelerator indicator based on these MQL5 posts: Accelerator Oscillator and Signals of the Indicator Accelerator Oscillator . Note : this tool is based on the code of Accelerator indicator developed by MetaQuotes Software Corp.
Features The signals are triggered at closing of last bar/opening of a new bar; Any kind of alerts can be enabled: Dialog Box, Email message, SMS notifications for smartphones and tablets, and Sound alerts; Customizable arrows. By d
FREE

There are a lot of support tools in the Forex trading market, such as ea - robot., to help the transaction become automated and can be traded 24 hours a day, and there are also lots of points. The quote is called an "indicator", such as: sar parabolic, cci, macd., bollinger band ... combining all the junk issues will give a "signal" and we call it "trading signal". But,null, and perhaps many market participants have not defined what the trend is, and what is the wave, to have more effective "str
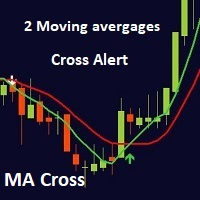
This indicator is a full 2 moving averages cross Alert ( email and push notification "mobile"), 2 MA with full control of MA method and applied price for each moving average "slow and fast", -simple, exponential, smoothed, linear weighted. -close, open, high, low, median price, typical price, weighted price. you can modify periods as well for both MA. For any suggestions don't hesitate, thanks
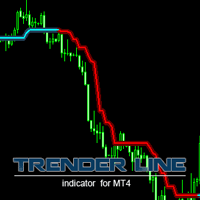
This is a trend-tracking indicator that determines the change in trend through changes in color. It can capture the big trend market and assist trend traders to enter and hold positions. A small rebound in the market will be filtered until the end of the trend. In the turbulent market, the horizontal line in the indicator can also be used as a support or pressure reference. More EA&Indicators click here https://www.mql5.com/en/users/chenshaofei/seller parameter Period - indicator period (large s

The latest Binary Options arrow indicator in the Garuda Signals product line. Binary options signal based on multiple time frame cross over analysis. Gets confirmation from the most consistent signals known to man; Ichimoku, SMA, Bollinger Bands; and also uses the 1 Hour time frame as trend confirmation , so you don't have to open up multiple chart and waste time. - Can be used for all time frames up to 1 hour, but is most POWERFUL for 1 and 5 min options. - Place your Call/PUT based on the Arro
What is Double Top and Bottom Double top and bottom patterns are chart patterns that occur when the underlying investment moves in a similar pattern to the letter "W" (double bottom) or "M" (double top). Double top and bottom analysis is used in technical analysis to explain movements in a security or other investment, and can be used as part of a trading strategy to exploit recurring patterns. You can find MT5 version hier
Indicator shows you 2 Level target and stop loss level. Stoploss level
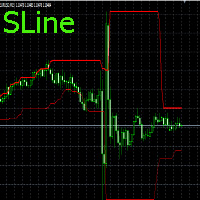
Входные параметры отсутствуют.По индикатору просто определять направление движения цены.Если линии сходятся,то используем ордера на пробой,если расходятся используем SELL,BUY,SELLLIMIT,BUYLIMIT.Работает на любых периодах.С любыми парами.Для нахождения минимального и максимального расстояния между линиями,нужно использовать инструмент"перекрестие".Для пары EURUSD на периоде М15,можно применять значения :для схождения <80 п.п.,а максимальное >500-800 п.п. Удачи в торговле!!! There are no input
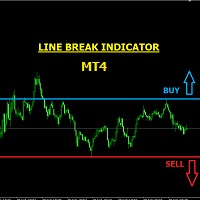
LINE BREAK INDICATOR This is a semi-automatic indicator that shows buy and sell arrows when your trendline (or horizontal line) is broken. You must first draw your lines, it will alert you of breaks through email, pop-ups, etc. It is important that you use just two main lines to avoid confusion, because the indicator signals BUY when the upper trendline or upper horizontal line is broken, and it signals SELL when the lower trendline or lower horizontal line is broken. It can be used for any curr

DAY BREAK INDICATOR
NB: THIS INDICATOR SHOWS MUCH DETAILS AND CORRECT SIGNALS ONLY ON THE CURRENT DAY'S CHART. PAST CHARTS AND STRATEGY TESTER DOESN'T SHOW MUCH POTENTIAL. It is an indicator for the current day's market purposely. This is an arbitrary Asian support and resistance breakout indicator for the current day only. Signals are no more valid for the next day ONLY FOR SCALPING AND INTRADAY TRADING. It signals in the direction of only the intraday trend. It should never be used for swing
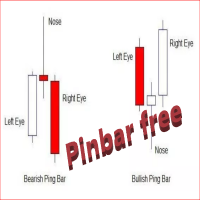
The Free Pin Bar MT4 indicator identifies Pin Bars It will even give you sound or email alerts if want them. If you download it and like it please leave a review! It would be wonderful
Pin Bars are purely based on price action as reflected by the candle formations created by Forex price movements. input Parameters are maximum allowed body/length ratio for the Nose bar. Nose body should be position in top (bottom for bearish pattern) part of the Nose bar. tells the indicator that the Left Ey
FREE

识别趋势指标使用基于移动中位数的健壮过滤方法 -XM 算法和更复杂的 ( 由作者开发 XC,XF,XS, 四种类型的移动平均线,无延迟 SMAWL, EMAWL, SSMAWL , LWMAWL ) 算法。“识别趋势”指示器使您可以非常准确地(最重要的是,稍有延迟)确定(1)真实趋势运动的开始,以及(2)识别侧面趋势(平坦)。这样的指标既可以用于根据剥头皮交易策略进行交易,也可以在使用长期交易策略时使用。上一个屏幕截图详细介绍了指标操作算法。 指标读数是可视的,非常简单,不需要评论。 指标的蓝线标志着上升趋势,黄金线是平坦的,红线是下降趋势。因此,当红色或金色线被蓝色替换时,买入的入口点和卖出的入口点 - 相反,当蓝色或金色线被红色替换时。 该指标有各种警报。当指示器指示(趋势方向)在最后两个柱上重合时,警报被激活。 箭头也指示了价格走势发生变化的可能时刻。
指标设置。 Price type -价格
FREE

商品通道指数 (CCI) 指标的多货币和多时间框架修改。 您可以在参数中指定任何所需的货币和时间范围。 此外,该面板还可以在跨越超买和超卖水平时发送通知。 通过单击带有句点的单元格,将打开该符号和句点。 这是 MTF 扫描仪。
默认情况下,从图表中隐藏仪表板的键是“D”.
参数 CCI Period — 平均周期. CCI Applied price — 价格类型。 Clear the chart at startup — 启动时清除图表。 Set of Pairs — 符号集 — Market Watch — 来自 MT 的“市场观察”的货币对; — Specified manually — 在参数“Pairs”中手动指定对。 — Current pair — 当前对。 Pairs (separated by a space or semicolon) — 由空格或分号分隔的符号列表。 货币名称的书写方式应与经纪商的名称完全相同,并保留大小写和前缀/后缀。 Time Frames (separated by a space or semicolon) — 由空格或分号分隔的
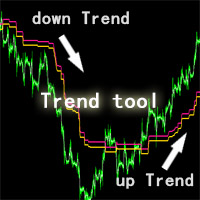
这款智币趋势工具适合所有品种,适合5分钟以上周期,是一款很好的判断趋势的工具! 价格在两条线的下方是下跌趋势,价格在两条线的上方是上涨趋势 参数设置说明: till_breakeven_rate:确定通道线跟随价格的紧密程度,直到交易平衡。推荐80 space1:确定从支持或阻力开始到上涨或下跌大于start_at_pips_profit2的通道线的宽度。建议3-5每个标准差等于6个点。它应该比space2和space3更宽,所以交易有第一次打开时成长的空间。 expand_rate1:确定在交易平衡后通道线将跟随价格的紧密程度。建议20-60 start_at_pips_profit2:确定在执行第二组设置之前交易必须达到的上涨或下跌的点数。建议40-60 space2:确定上涨或下跌大于start_at_pips_profit2后的通道线的宽度。建议1.5-3每个标准差等于6个点。它应该小于space1但大于space3。 expand_rate2:确定上涨或下跌大于start_at_pips_profit2后通道线将跟随价格的接近程度。建议50-100 start_at_pi
FREE
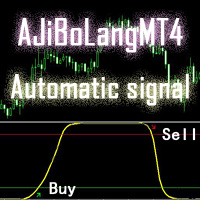
这款AJiBoLang指标适合所有周期的信号,非常适合短线的信号 看图表上的箭头做单就可以了,绿色箭头做Buy单,红色箭头做Sell单。 做Buy单后,如果黄色线走到上方水平向前行驶了一段距离,这时候就可以抛售出Buy单。 做Sell单后,如果黄色线走到下方水平向前行驶了一段距离,这时候就可以抛售出Sell单。 如果黄色线走在中间,并且还没有做任何单,这时候如果黄色线向上折返,就可以做Buy单,并且这单的准确性会更高。 如果黄色线走在中间,并且还没有做任何单,这时候如果黄色线向下折返,就可以做Sell单,并且这单的准确性会更高。 参数说明: 【alert_NO_OFF】:这是警报开关,设置成true,如果出现箭头就会自动警报提示;设置成false,则不会警报提示。 【sendmail_NO_OFF】:这是发送邮件的开关,设置成true,如果出现箭头就会发送邮件到你在MT4设置好的邮箱里面;设置成false,则不会发邮件。 【sendnotification_NO_OFF】:这是发送即时消息的开关,设置成true,如果出现箭头就会发送消息到你的移动设备;设置成false,则不会发消息。
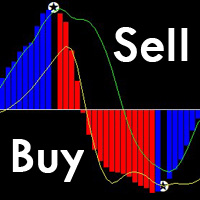
这是一款独特的MACD指标,它比传统MACD要准确,而且好用。它适合任何图表周期,并且适合任何市场品种。 红色的柱子是(Buy)的波段信号、蓝色的柱子是(Sell)的波段信号。 黄色线和绿色线是趋势线,这两条线永远不会交叉。 Buy:蓝色柱子中,再看绿色线向上穿越中间0轴。 Sell:红色柱子中,再看黄色线向下穿越中间0轴。 这款MACD的背离形态信号的准确率在99%: 背离形态Buy:价格一个波段比一个波段低,而指标的柱子却越缩越高,这种情况下可以立即做Buy单。 背离形态Sell:价格一个波段比一个波段高,而指标的柱子却越缩越低,这种情况下可以立即做Sell单。 注意:指标里面的五角星会随着价格波动而变化。

Indicator for determining adjustments and price reversals It gives signals for inputs and shows the general direction of the price movement. Allows you to conduct trend and counter trend trading It works on all timeframes, on any currency pairs, metals and cryptocurrency Can be used when working with binary options Distinctive features Does not redraw; Thanks to simple settings, you can quickly adapt to any trading instrument; It works on all timeframes and on all symbols; Suitable for trading c
*Non-Repainting Indicator Message Me Immediately After Purchase For VIP Installation Help and Free Strategy Bruce's Price Predictor is an indicator that shows precise price reversals. A great arsenal to add to any chart. Bruce's Price Predictor points price reversals with high degree of accuracy and it is great for scalping on the 1min time frame, Or swing trading on the 1hr time frame. Buy and sell arrows are shown on the chart as for entry signals. They do not repaint but confirmation ent

Mystic Arrow - уникальный авторский индикатор, отображающий сигналы в направлении основной тенденции, и против нее. Благодаря разнообразию настроек и фильтров индикатор можно настроить под свой стиль торговли. Mystic Arrow подходит для любого таймфрейма, валютной пары. Сигналы индикатора не пропадают ни при каких условиях. Отличительной особенностью является возможность настроить сигналы индикатора отдельно для тенденции и против нее. Имеет в качестве отключаемого фильтра показания ценового кан
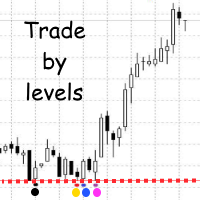
The Trade by levels indicator is designed to automatically determine the formation of a model for entering the market on the chart of the selected instrument.
Definitions: ⦁ BFl is the bar that formed the level. ⦁ BCL1 and BCL2 bars, confirming the level.
The graphical model: ⦁ levels high\low the bars BFL and BCL1 must match the accuracy to the point ⦁ there can be any number of bars between BFL and BCL1. ⦁ between BCL1 and BCL2 intermediate bars
FREE
The RSI S-RoC indicator differs from the standard RSI in that it takes into account the price rate of change when calculating values. When the price moves in a trend, the indicator produces good entry signals oncethe price touches its levels. The level values can be configured in the indicator settings. They can also be modified and adjusted directly in the indicator window. You can also set on a chart signal lines. Once they are crossed, the indicator will produce a sound alert or play a user
FREE
Advanced Trend Finder follow trend. Color change trend changed.
Works in EURUSD/GBPUSD/XAUUSD/USOIL/US500/USDJPY/USDCAD/JP225/USDTRY/USDMXN and all pairs
Best timeframes 5M/15M/1H/4H/DAILY
Signal on close of a bar.
DOES NOT repaint. DOES NOT repaint. DOES NOT repaint. DOES NOT repaint.
DOES NOT recalculate. DOES NOT recalculate. DOES NOT recalculate. DOES NOT recalculate Settings SoundOn : true/false EmailOn : true/false PushNotificationOn : true/false
ver 1.1 update notes:
Added Alert Arr

The diamond top and bottom are reversal patterns. It represents a rally to a new high with a drop to a support level followed by a rally to make a new high and a quick decline, breaking the support level to make a higher low. The bounce from the higher low is then followed by a rally, but making a lower high instead. Once this behavior is identified, prices then break the trend line connecting the first and second lows and start to decline further. You can find MT5 version hier
Indicator shows
Trend Line PRO 指标是一个独立的交易策略。 它显示趋势变化,交易的入口点,以及自动计算三个级别的止盈和止损保护 Trend Line PRO 非常适合所有元交易者符号:货币,金属,加密货币,股票和指数 该指标用于真实账户交易,这证实了该策略的可靠性 促销活动 。购买趋势线专业版指标, 即可获赠优化工具 (用于快速查找最佳指标参数)。
趋势线专业的优点 永远不要重绘它的信号; 将其作为独立策略的可能性; 它有三个自动水平止盈和止损水平 该指标具有iCustom信号缓冲区,允许您基于它创建交易机器人 具有通知功能 该指标已证明其在真实账户交易中的有效性
如何设置和优化趋势线PRO指标: 通过更改幅度参数以及 TP 和 SL 水平,将重点放在指标面板上的利润上 您可以使用以下方式自动优化指标参数: Optimizer Utility 详细说明(ENG): 这里
趋势线PRO指标如何工作: 在指示信号以向上或向下箭头的形式出现后,等待信号形成的当前蜡烛的结束 在同一方向开仓(最多可以同时开3个订单,不同级别的止盈保护) 设置指标建议的止损和止盈水平 在价格达到第一
該指標繪製的水平非常“堅定”且性質強烈。
這些水平在一生中充當強烈的價格拒絕水平,從不重新粉刷。
為了將我所有的邏輯級別整合到您的交易系統中,需要以1個月的訂閱價格訂購6個月的所有邏輯級別。
希望這會有所幫助。
免責聲明:如果您正在尋找一個花哨,色彩鮮豔,引人注目的指示,請遠離。
沒有考慮價格可以保持,反彈或突破的水平,任何交易者都不能成為一個好交易者。
這些水平幫助交易者以更便宜的價格進入市場。它們可以是支撐阻力,需求供給,支點,斐波納契水平等。
經過多年對價格圖表的研究和分析,我發現很少有復雜的算法和邏輯來找出未來可能的價格行為。
在某些價格點上應用這些邏輯和算法,我達到了價格可以反彈或突破的水平。
我將它們命名為“Adamant Levels”。
是的,它們本質上是堅定的和靜態的。
價格被這些水平吸引並擊退。
這些是未來的價格行為水平,交易者可以通過更高的風險回報率進入市場。
大多數觸發點如價格模式,圖表模式,收斂和分歧,趨勢線故障等都出現在這些“堅定的水平”上。
所以等待在這些級別上發生觸發並進入。
特別注意不同堅定程度的融合
特別注意RS
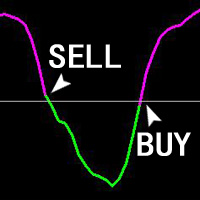
这款智币狙击指标分析系统使用了强大的内部循环调用指标自己的外部指标,然后,再前后周期调用分析。
本指标分析系统的数据计算非常复杂(前后循环周期调用),所以减小了信号的滞后性,而达到提前预测的准确性。
本指标可以用在MT4上的所有周期,最适合15分钟、30分钟、1小时、4小时的周期使用。
做多单:
当出现紫色线,并且紫色线在0轴上方,即可下单做多(买涨单)!
做空单:
当出现绿色线,并且绿色线在0轴下方,即可下单做空(买跌单)!
注意:
如果下单后出现了相反信号,最好的办法是立即平仓止损,并且再反向做单!
因为下单后出现反信号,这个时候持仓单的亏损会很小,所以止损掉也不会有很大损失!
我们下单盈利需要抓大波段,这款指标有很强的抓大波段的能力!而且滞后性非常小!

The indicator helps to identify possible rollbacks and reversals. Shows the direction of the price movement and is painted in the appropriate color. Allows you to conduct trend and counter trend trading It works on all timeframes, on any currency pairs, metals and cryptocurrency Can be used when working with binary options Distinctive features Does not redraw; Simple and clear settings; It works on all timeframes and on all symbols; Suitable for trading currencies, metals, options and cryptocurr
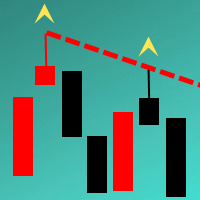
The Indicator automatically draws trend lines on the specified timeframe ( Trend lines period parameter). The lines are drawn based on the last two known fractals of the specified period. A peculiarity of this Indicator is that the lines are drawn with accuracy up to 15 minutes. It allows analyzing the chart on smaller timeframes without loosing the precision of drawing the lines in relation to the extrema of the prices. It is suitable for an intraday and medium term trading. The minimum timefr

Taurus All4
Taurus All4 is a high-performance indicator, it will tell you the strength of the trend, and you will be able to observe the strength of the candle. Our indicator has more than 4 trend confirmations.
It is very simple and easy to use.
Confirmation Modes Candle Trend Confirmations: When the candle switches to light green the trend is high. When the candle switches to light red the trend is reverting down. When the candle changes to dark red the trend is low. Trendline Trend Confirm

Технический индикатор Forex ForexMarshalsTrend - это уникальный, эксклюзивный и прорывной финансовый инструмент, основанный на сложном математическом алгоритме колебаний стоимости конвертации цены, который способен прогнозировать дальнейшие изменения цены. Индикатор относится к группе трендовых индикаторов. Он предоставляет возможность принимать правильные решения о своевременном входе или выходе из рынка и в своих настройках указывает, следует ли открывать длинную или короткую позицию для получ
UniversalIndicator is a universal indicator. A great helper for beginners and professional traders. The indicator algorithm uses probabilistic and statistical methods for analyzing the price of a trading instrument. The indicator is set in the usual way. Advantages of the indicator works on any time period works with any trading tool has a high probability of a positive forecast does not redraw Indicator Parameters LengthForecast = 30 - the number of predicted bars
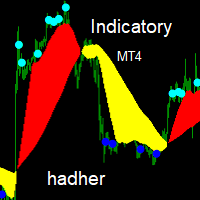
Indicatory is an indicator uses price action and averaging movement to trigger it's signals buy signal when the blue sun completely sunset's under the yellow clouds Sell signals when the aqua sun completely rise's over the red clouds you could call the indicator to any EA code for auto trading ,optimizing,sell signal index buffer number is (2) buy signals index buffer number is (3)... try to avoid weak signals which occur at the end of clouds ,strong signals occur's when there is a wid
MetaTrader 市场 - 在您的交易程序端可以直接使用为交易者提供的自动交易和技术指标。
MQL5.community 支付系统 提供给MQL5.com 网站所有已注册用户用于MetaTrade服务方面的事务。您可以使用WebMoney,PayPal 或银行卡进行存取款。
