 MetaTrader 5
 专家
专家
 指标
指标
 程序库
程序库
 实用工具
实用工具
 窗口小部件
窗口小部件
 规则
规则
适用于MetaTrader 4的新技术指标 - 139
 下面列出的技术指标信号对MetaTrader 4平台的开仓交易和平仓交易起着至关重要的作用。
指标的本质就是一种交易品种的数学转换,旨在预测价格变化。
下面列出的技术指标信号对MetaTrader 4平台的开仓交易和平仓交易起着至关重要的作用。
指标的本质就是一种交易品种的数学转换,旨在预测价格变化。 
PLEASE HELP REVIEW/ SUPPORT/ SHARE THIS OTHER INDICATOR HERE https://www.mql5.com/en/market/product/51637 AS YOU DOWNLOAD THIS ONE FOR FREE. THANKS.
The indicator was created to make trading very easy to understand. It is based on five moving average crosses and pivot points. Download the "EASY TREND" on my Product list for a more advanced and profiting trades. You can trade with this indicator alone and get the maximum out of the market. If you are a new trader, just open your chart window
FREE
Overview The Slope is a simple MT4 indicator that calculates the slope of recent price movement and displays it as a histogram below the chart. It is designed to help traders read whether recent price movement is positive, negative, or relatively flat. The indicator can be used as a visual momentum and direction filter alongside the trader's own chart analysis. Key Features Calculates the slope of recent price movement. Displays positive and negative slope values as a histogram. Allows the calcu
FREE

Embark on the pinnacle of Binary Options evolution. Our indicator isn't just adaptive—it's relentless. Picture a ninja riding a serpent, shadowing its every move; that's how this tool trails the market trend, unwavering till the end. Built upon the foundational prowess of the Ichimoku indicator and honed with an array of fine-tuned oscillators, it epitomizes accuracy and precision. Dive deep without getting lost in the Ichimoku's intricacies—our indicator simplifies the process for you. Perhaps

This indicator Super Channel Arrow and zak indicator.Indicator displays trend movement. Indicator calculates automatically line. Features
FiltPer - displays indicator channel period. FiltPer2 - displays indicator period. deviation - displays indicator channel deviation. How to understand the status: If the arrow is green, trend is up. If the arrow is red, trend is down. best FiltPer ,period timeframe M1-H1 (100);H4-MN (50) best FiltPer2, period timeframe M1-H1 (50);H4-MN (25) //////////////////

If you need more information than a few numbers in the iExposure index, this indicator is for you.
Better iExposure indicator is an improvement over the original information, such as:
Separate profit column for BUY and SELL Separate SL column for BUY and SELL Separate TP column for BUY and SEL Average Price as Horizontal Line in Chart Pip Value www.foxwave.eu
This Signal Zero Risk indicator uses Donchian channel and ATR indicators. This trend tracking system uses historical data to buy and sell. This indicator does not repaint. The point at which the signal is given does not change. You can use it in all graphics. You can use it in all pairs. This indicator shows the input and output signals as arrows and alert. Open long deals on blue arrows Open short deals on red arrows It tells you that you should quit the transaction.
Parameters Alerts - notif
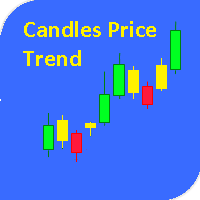
Индикатор рассчитывается по оригинальной формуле и окрашивает свечи в зависимости от общей тенденции на рынке. Синие указывают на восходящий тренд, красные на нисходящий, желтые свечи указывают остановку или возможный разворот. На сильных уровнях или при резком развороте желтые могут не сформироваться но алерт все равно предупредит вас об этом. Достоинства данного индикатора это наименьшее запаздывание, сигнал подается еще вовремя формирования разворотного бара. Настройки: Length - чувствительно

智能交易系统。所有時間範圍、貨幣、加密貨幣、金屬...所有 MT4 以及任何螢幕和範本都會自動配置。初學者將簡單地根據信號進行交易。獨特的彈性演算法的參數在設定中是開放的。
想法1:除了「買進/賣出」之外,在極值點也給予「獲利」訊號。這種策略會增加結果 - 當您獲得最大利潤並進行更多交易時。 如果觸發了“止盈”或“止損”,或者您平倉了,該指標很快就會在相同方向上發出新信號- 當趨勢在回滾後繼續時,或在相反方向上- 如果趨勢改變。 可用的「訊號優化器」和訊號過濾器:「Filter_Stoch_M15」(僅隨機 M15 方向的訊號)、「Filter_Stoch_H1」以及指示風險交易的「TrendLine_Gray_when_risk」。 思路二:可以准确选择交易时刻。 随机指标线 M1、M5、M15、M30、H1、H4 在一个窗口中同步。 它们的反转(进入点)和每分钟的走势都可以在一张图表上看到所有时间范围。 想法 3:一个紧凑的货币活动扫描仪,它会自动将带有新信号的图表切换到顶部屏幕。 单击扫描仪上的符号,您可以轻松创建所需的图表。 您在 1 个图表上配置的“CO

VR Sync Charts 是用于在窗口之间标记同步的实用程序。 使用VR Sync Charts,您的趋势水平、横水平、斐波那契折返将与所有图表同步。 该实用程序允许同步MetaTrader终端中的所有标准图形对象,您的所有趋势、江恩线和其他对象都将被准确复制到相邻图表。 您不再需要手动复制您的划线和标记。在下面的图片和视频中,您可以查看和评定VR Sync Charts实用程序的工作。 建议: 在所有图表上指定指标。 在终端设置中设置为通过双击选择一个对象。 对该程序无法在策略测试器中进行测试,请看下面的视频。 有点 同步任何图形对象 将图表与任何时间范围同步 所有更新都是免费的 适合初学者和专业交易者 设置数量不大,有助于有选择地做同步 适用于任何金融工具(Forex, CFD, Crypto, Metalls, Futures) 易于安装和配置,该程序带有文本和视频说明 版本: MetaTrader 5 博客上的更多信息 跳转 您的反馈是最好的感谢! 留下评价。 技术支持、设置、set文件、试用期可以在 聊天群
Description: The indicator predicts, with a specific probability, if the actual candlestick range will expand or contract compared to the range of a previous candle. Furthermore, the indicator shows the possible high or low of the actual candle, based on trend direction. (Recommended for Daily, Weekly, or Monthly timeframes).
KEY LINKS: Indicator Manual – How to Install – Frequent Questions - All Products How to use the indicator: Determines, with a certain probability, if there will b

Mars 2 is a Oscilator indicator. I s a powerful indicator of TREND for any par and any timeframe. It doesn't requires any additional indicators for the trading setup.The indicator gives clear signals about opening and closing trades.This Indicator is a unique, high quality and affordable trading tool.
Perfect For New Traders And Expert Traders Low risk entries. Never repaints signal. Never backpaints signal. Never recalculates signal. For MT4 Only Great For Scalping Great For Swing Trading A

Must be owned and used by Fibonacci traders who like to open position by pending order (limit order). The strategy is that you just have to wait for the automatic custom fibonacci appear then manual place your pending order, stop loss and take profit at the level of Fibonacci. The position will be opened when the price make a successful retest. Fibo Heart Indi come with pop-up alert, email and mobile push notification. Suitable for all instruments and all time frames. Don't miss the trading set

Dear traders! This indicator automatically displays multiple Anchored VWAPs (AVWAPs) on the chart. They act as strong Supports or Resistances. They add a lot of confluence to trading systems. As per feedbacks from users, we have incorporated BOTH AVWAPs in latest version. HL AVWAPs and Time AVWAP.
Let us understand about them in brief. In Inputs section, from Display Choice, user can select either or both of abovementioned AVWAPs.
1. HL AVWAPs - Anchor VWAP Bands from Swing High / Low, w

Scalpises Assistant is a complete trading system for scalping on any currency pair. The indicator itself analyzes the market and gives the trader signals to open orders. Also sends signals using email and push notifications. This indicator displays information in two windows. In the main window, the indicator draws signals in the chart in the form of arrows. In the additional window, the indicator shows the ratio of the number of profitable and loss-making signals, shows the current signal on o
The RSI Symmetric indicator approximated by function of the known Buzzer indicator.
Display for the high timeframe is provided.
2 types of signals are of interest:
1. Position of the RSI line concerning the approximated line
2. The trend direction of the approximated line
Indicator parameters:
RSI TimeF rame - the worker timeframe (it has to be equal or more than current);
RSI Period - no comments;
Buzzer Period is the period of approximation of the RSI Symmetric indicator;
Buzzer Ave
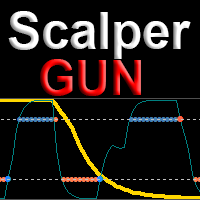
Scalper gun - the main weapon for trade in scalping and swing, with visualization and alert of entry points. The indicator works in both trend and non-trend market conditions. Suitable for beginners and experienced traders. SCALPER GUN surpasses popular top indicators of this site in speed, quality of visualization and accuracy of entry !!!
Before buying, download the Scalper gun demo and compare it with similar indicators for scalping in the MT4 tester. Features This is a complete trading sy

Market Zones This indicator provides an easy way to get to trade based on Gaussian statistical levels similar to the Market Profile methodology. Using an exclusive formula the indicator estimates dinamic zones where the market movements statistically remains most of the time (70%), this allows to see the market on a simplified way avoiding following non-relevant bar movements. Prices stay calm inside market zones and tend to move faster outside the zones. This is crutial to identify best zones

Индикатор ViPa-это мощный инструмент ,который работает как в трендовых,так и флетовых рыночных условиях.Отлично подходит как для новичков,так и опытных трейдеров.
1.Очень прост в использовании. 2.Не имеет входящих параметров. 3.Визуализация с помощью понятных картинок. 4.Не требует дополнительных индикаторов. 5.Работает по всем инструментам. 6.Идеально подходит для скальпинга. 7.Не перерисовывается. 8.Входы с низким риском.

SIGNALINE INDICATOR This indicator for all pairs and all timeframes I have just completed the M5 timeframe for deep optimization EURJPY yet. EURJPY M5 Optimization ( TP=150 , SL=130 , IndicatorPeriod=6 , Mov1=22 , Mov2=48 ) (*)Added 20.05.2019 You can find this signal page below https://www.mql5.com/en/signals/583477 Other optimizasyon results will be added on this signalpage. Input Parameters: IndicatorPeriod: Default is 8. Mov1 : Default is 21. Mov2 : Default is 48.
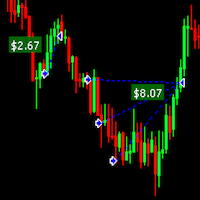
Draw Profit indicator can efficiently help those traders who want to see on the chart all closed positions output: profit or loss. If set DrawProfit on your chart managed by an Expert Advisor (EA) you will see clearly it’s performance by its profits & losses. My other products: https://www.mql5.com/en/users/hoangvudb/seller
Input parameters: Show Profit Labels : show profit of orders with a label (true/false). Profit Mode : available options: Show in currency. Show in pips. Show in currency a
FREE
Overview The M.O.D.E stands for Multiple Oscillator Divergence Exit . It is an MT4 indicator that checks for divergence between price and multiple oscillators. The purpose is to help traders observe potential weakening in the current price movement when price and oscillator behavior disagree. The indicator was originally designed as an exit and warning tool, but traders may also use it as a divergence reference within their own analysis process. Key Features Checks divergence across multiple osc
FREE

This is triangular moving average(TMS). TMS uses Simple Moving Averages for moving average calculation. If TMA periods is 5,five SMAs are used for calculation. TMA weights middle part of the price series. In other words,TMA is less noisy and more accurate .
Input Parameters TMAPeriods ----- Defines perids for TMA calculation.
ModeForTMA ----- Defines mode for TMA calculation.This is normally SMA.
AppliedPriceForTMA ----- Defines applied price for TMA calculation. ShowNormalMA -----Show normal m

Description The indicator measures a currency’s relative strength, on different timeframes, through certain percentile spread analysis. This allows you to compare which are the strongest currency pairs, against the weakest pairs. These spreads are based on comparison against USD. KEY LINKS: Indicator Manual – How to Install – Frequent Questions - All Products How is "Clever Spread Currencies Strength" useful to you? This indicator determines a currency’s strength for different timeframe

Golden Chip provides Basic Market Structure, Fibonacci, supply and Demand Zones. Letting you identify when a sell off point is approaching or whne a buy opportunity is arriving. The awesome thing about Golden Chip is that, you will see rejection levels or continuation before ANYBODY ! This indicator moves directly with price and lines up perfectly with the Chart. Some indicators would lag but NOT this one ! Golden Chip is amazing for Clean chart (Naked Chart). GOLDEN CHIP IS ONLY ON METATRADER (

Attention!!! Do not try to test an Indicator in Tester, this is very difficult and mathematical calculation will consume all your Memory of computer. Test can be provide only on high performance computers. In Forward trading Indicator run without any problems. Better is rent product and test this calculation. After buy this indicator - BOILERMAKER, we will give for FREE our another indicator - Keltner MTF , contact us - after buy. PLEASE ONLY BUY LIFETIME LICENSE NO RENT!!! We add on MQL ma

Description: Indicator which uses trend, breakout and reversal innovative indicators to show a complete visual trading strategy, with transparent metrics. It follows simple visual patterns, which will improve your trading significantly. Support: We create great tools for the entire trading community. Most of them are free. If you believe in what we do Support Us Here. KEY LINKS: Indicator Manual – How to Install – Frequent Questions - All Products
Outstanding Features Shows cur

EasyTrend Pro is the powerful trend indicator provided with all necessary for trade and it is very easy to use. Everyone has probably come across indicators or Expert Advisors that contain numerous input parameters that are difficult to understand. But here, input parameters are simple and it is no need to configure anything — neural network will do all for you.
Difference from a classic version
The real-time multi time frame panel is added, so you can check a trend for other timeframes without
ZhiBiTMG是一款集合了趋势和马丁格尔的指标,适合所有的市场品种和所有图表周期。 市面上很多指标违背了趋势却声称很准确,但是真的准确吗?其实都不准确!因为市场必须顺势而行。 这款ZhiBiTMG指标就是在趋势的前提下,给出马丁格尔信号。这样才能顺应市场规律。 使用说明: 红色线是向下的趋势线(Sell),一共三条线;默认情况下,只打开了两条线的下单信号,也可以在参数里面打开或关闭任意一条线的下单信号。 蓝色线是向上的趋势线(Buy),一共三条线;默认情况下,只打开了两条线的下单信号,也可以在参数里面打开或关闭任意一条线的下单信号。 参数说明: 【Arrow_Sell_Down_1】:第一条向下趋势线的下单信号开或关,默认是开的状态; 【Arrow_Buy_UP_1】:第一条向上趋势线的下单信号开或关,默认是开的状态; 【Arrow_Sell_Down_2】:第二条向下趋势线的下单信号开或关,默认是开的状态; 【Arrow_Buy_UP_2】:第二条向上趋势线的下单信号开或关,默认是开的状态; 【Arrow_Sell_Down_3】:第三条向下趋势线的下单信号开或关,默认是关的状态;

Arrow indicator for easy determination of trend estimates All arrows remain in place and after closing the candle does not disappear. Can send notifications to your phone or email Works on any currency pairs, metals and cryptocurrency Suitable for working with binary options Distinctive features Does not redraw; Defines trend changes; Sends signals to a smartphone or email; Advanced settings for fine tuning; Works on all timeframes and on all symbols; Suitable for trading currencies, metals, opt
This indicator was developed to support multiple timeframe analysis. In the indicator settings, the user can set the color, width, and style of the horizontal lines for each timeframe. This way, when the horizontal lines are inserted into the chart, they will be plotted with the timeframe settings.
MTF Lines also allows visibility control of another objets like rectangles, trend lines and texts.
This is a product developed by Renato Fiche Junior and available to all MetaTrader 4 and 5 users!
FREE
I present to your attention the indicator ADX-MA Arrows MTF . The indicator is based on the two standard indicators Moving Average and Average Directional Movement Index . It represents the entry signals in the form of arrows. All signals are generated on the current bar. It is maximally simplified to use both for trading exclusively with one indicator and for using the indicator as part of your trading systems.
A feature of the indicator is that the indicator timeframe can be set independently

Strong Retracement Points Pro edition! SRP (Strong Retracement/Reversal Points) is a powerful and unique support and resistance indicator. It displays the closest important levels which we expect the price retracement/reversal! If all level are broken from one side, it recalculates and draws new support and resistance levels, so the levels might be valid for several days depending on the market! If you are still hesitating to start using this wonderful tool, you can check this link to see how ef

CSS " currency strength slope " is a a multi currency strength indicator that use Forex major currencies, EUR, USD, CAD, AUD, NZD, JPY, CHF, GBP. it use 28 major pairs to calculate the power of every currency using a based moving averages algorithm : you will see volatility clearly between currencies. input: MA Fast & Slow. - MA Mode : simple, exponential, smoothed, linear weighted
- Applied Price : close, open, high, low, median price, typical price, weighted price.

Voodoo Scalper Bars enjoy scalping. Color change trend changed.
Works in EURUSD/GBPUSD/XAUUSD/USOIL/US500/USDJPY/USDCAD/JP225/USDTRY/USDMXN and CFD's all pairs
The input parameters are optimized for all pairs best timeframes M1 and M5 Voodoo Scalper Bars used Bar Charts
Signal on close of a bar.
DOES NOT repaint. DOES NOT repaint. DOES NOT repaint. DOES NOT repaint.
DOES NOT recalculate. DOES NOT recalculate. DOES NOT recalculate. DOES NOT recalculate NOTE : SCALPING COLOR CHANGED FOLLOW Setti

Chart Patterns Detect 15 patterns (Ascending Triangle, Descending Triangle, Rising Wedge, Falling Wedge, Bullish Flag, Bearish Flag, Bullish Rectangle, Bearish Rectangle Symmetrical triangle, Head and Shoulders, Inverted Head and Shoulders, Triple top, Triple Bottom, Double Top, Double Bottom) Use historical data to calculate the probability of each pattern to succeed (possibility to filter notification according to the chance of success) gives graphic indication about the invalidation level and

Supply Demand Zone Pro Indicator works with all products and timeframes. It is using a new calculation method, and now you can select the desired zone on any timeframe! Strongest Zones are already enabled by default This is a great advantage in trading.This indicator has a built in backtester enabled by default, just move the chart.
Supply and Demand ?
Supply is a price zone where sellers outnumbered buyers and drove the price lower. Demand is a price zone where buyers outnumbers sellers and dr
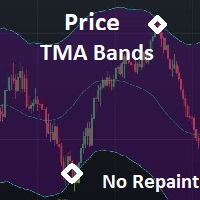
This is a simple PriceTMA bands, non repaint! it can be used for a trend following system or sometimes reversals. as a main signal or a filter for others strategies, it depends on the trader main strategy. calculations for this indicator are a combined Algorithm between moving averages "MA" and average true range"ATR". good luck with your trading! i hope it is helpful Cheers

This indicator is just a simple ATR indicator. It calculates the Average True Range and let you tell it to show the percentage of the ATR. You will then see the % of the ATR on the screen. I like to use it to calculate different things for my trading. If I use the really great AW Recovery System ( https://www.mql5.com/en/market/product/28868 ) there is a great strategy made by the developer, where you watch the daily ATR and set the steps calculated on part of the ATR. So if you put the Part of

В основе индикатора TDI лежат следующие индикаторы: RSI, Moving Average, Bollinger bands, но основным из них нужно выделить RSI, весь расчет индикатора завязан от его значений.
Зеленая линия (линия RSI) – сглаженные простой (по умолчанию) скользящей средней значения индикатора RSI, период сглаживания 2.
Красная линия (сигнальная линия) – сглаженные простой (по умолчанию) скользящей средней значения индикатора RSI, период сглаживания 7.
Синие линии – индикатор Bollinger bands по умолчанию пери
FREE

KT Auto Support Resistance Levels:适用于 MetaTrader 4/5 的多周期支撑阻力、智能区域与水平仪表盘 摆动高点、Pivot 枢轴点、订单块、前期高低点。每个交易者标记市场的方式都不太一样,最后承受代价的往往是图表本身。把太多方法堆在同一张图上,它就不再是一张清晰的地图,而会变成噪音。 KT Auto Support Resistance Levels 正是为了解决这个问题而设计。它会同时扫描月线、周线、日线以及当前周期,然后自动把真正重要的水平直接绘制到您的 MetaTrader 图表上。当图表开始变得拥挤时,只需点击一次,就可以把这些水平合并成干净的 Smart Zones。实时面板还会持续显示价格上方和下方最近的水平,让您不必在图表上来回寻找。 可以把它看作一位永远不会疲惫的图表分析师,始终帮您标记关键位置。
它能为您做什么
从多个经过验证的来源寻找并绘制水平:摆动点、Pivot 枢轴点、前期价格以及订单块中点,覆盖多个时间周期。 当您想要更简洁的图表时,可以把彼此接近的水平合并成清晰的 Smart Zones。 保持一个实时面板,显示
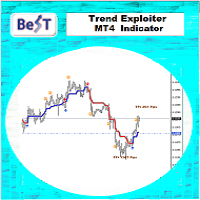
BeST_Trend Exploiter is a Metatrader Indicator based on a smart proprietary algorithm which can detect the market Median Trend while it filters out the noise providing Buy and Sell Signals and also wherever it is applicable it provides us with TP Levels of High Probability. Additionally as it has Built Inside all the necessary features it can be used as a Complete Strategy of very Impressive Results. Essential Advantages of the Indicator
Clear and Easily Understandable trading rules. Real Time
This indicator was specially developed to support the powerful day trading strategy described in the book "The Price in Time". The NTZ BOX indicator automatically creates: The Day separators The No Trading Zone divided with the Green Box, the Peach Box and the Turqoise Box Extensions of the long and short Take Profit levels The Yellow Box to display the range of the Asian session The Money Manager for a perfect Position Sizing calculated on your risk percentage Using the NTZ BOX indicator will e
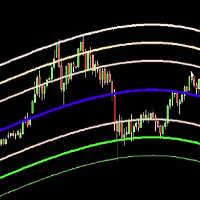
The Belkhayate center of gravity indicator is best used to confirm major turning points, and distinguish price extremes. Generally if price reaches the upper or lower levels one should expect a turn around coming soon, or at least a pull back towards the centre line if there is a strong trend. The upper and lower levels are red and green lines.
Our indicator use the same parameters as the well known trader M.Mostafa Belkhayate the inventor of the indicator, allow the use of buffers for your EA a

This indicator Master XR indicator.Indicator displays trend movement. Indicator calculates automatically line. Features
FiltPer - displays indicator period. deviation - displays indicator deviation. deviation2 - displays indicator deviation. How to understand the status: If (Timeframe M1-H1) FiltPer = 100; If ( Timeframe H4-MN) FiltPer = 5-20; ////////////////////////////////////////////////////////////////////////////////////////////////////////////////////////////////////////////////////// //

This indicator Super MA Pluss indicator.Indicator displays trend movement. Indicator calculates automatically line. Features
FiltPer - displays indicator period. How to understand the status: If the arrow is green, trend is up. If the arrow is red, trend is down. /////////////////////////////////////////////////////////////////////////////////////////////////////////////////////////////////////////////////// ///////////////////////////////////////////////////////////////////////////////////////

Индикатор внутри коробки считает количество баров и высоти коробки. фильтрация коробки происходит с помощью пробоя в пунктах или в процентах. Входные парамеиры Минмальное количество баров в нутри коробки Максимальное высота коробки Варянт величины (фылтрация коробки) величина в пунктах после пробоя коробки величина в % после пробоя коробки Максимальное количество стрелок, сигналы на покупку или на продажу.

Ultra Advanced Zig Zag 是一款适用于 MetaTrader 4 的 Zig Zag(之字形)指标。Zig Zag 工具连接波段高点和波段低点,使市场的主要波浪更容易辨认。它直接显示在 MetaTrader 4 的图表上,供交易者作为分析时的辅助参考。 主要特点
- 突出显示市场的主要波段
- 有助于研究市场结构,例如更高的高点和更低的低点
- 有助于为斐波那契和图表形态分析做准备
- 易于使用,加载到图表后即可直接查看其显示的内容
- 提供演示版,您可以在购买之前先行测试,了解它在自己图表上的显示方式 推荐设置
建议在以下时间周期上使用:M30, H1, H4, D1
建议搭配使用的货币对:EUR/USD, USD/JPY, GBP/USD, USD/CHF, USD/CAD, AUD/USD, EUR/JPY 使用方法
利用波段来研究市场结构,并结合您自己的分析和风险管理。该指标只是图表上的辅助工具,并不能取代您自己的判断。 交易涉及风险。过往业绩并不保证未来的结果。
欢迎您在评论区留言,提出问题和建议。

Ultra Advanced MA Pro 是一款适用于 MetaTrader 4 的移动平均线指标。它面向使用移动平均线研究趋势方向和强度的交易者。它直接显示在 MetaTrader 4 的图表上,供交易者作为分析时的辅助参考。 主要特点
- 基于移动平均线的趋势分析
- 有助于识别主导方向
- 可用作动态支撑和阻力参考
- 易于使用,加载到图表后即可直接查看其显示的内容
- 提供演示版,您可以在购买之前先行测试,了解它在自己图表上的显示方式 推荐设置
建议在以下时间周期上使用:M30, H1, H4, D1
建议搭配使用的货币对:EUR/USD, USD/JPY, GBP/USD, USD/CHF, USD/CAD, AUD/USD, EUR/JPY 使用方法
将移动平均线作为您自己交易形态的趋势过滤器,并配合您自己的分析和风险管理。该指标只是图表上的辅助工具,并不能取代您自己的判断。 交易涉及风险。过往业绩并不保证未来的结果。
欢迎您在评论区留言,提出问题和建议。

Ultra Advanced Points Line 是一款适用于 MetaTrader 4 的技术指标,帮助交易者解读趋势和动量。它是跟踪市场当前阶段的视觉辅助工具。它直接显示在 MetaTrader 4 的图表上,供交易者作为分析时的辅助参考。 主要特点
- 跟踪市场阶段的视觉辅助工具
- 可与支撑、阻力和价格行为相结合
- 适合 M30 至 D1 的时间周期
- 易于使用,加载到图表后即可直接查看其显示的内容
- 提供演示版,您可以在购买之前先行测试,了解它在自己图表上的显示方式 推荐设置
建议在以下时间周期上使用:M30, H1, H4, D1
建议搭配使用的货币对:EUR/USD, USD/JPY, GBP/USD, USD/CHF, USD/CAD, AUD/USD, EUR/JPY 使用方法
将其作为观察当前市场阶段的额外视角,并仅依据您自己的分析和风险管理做出决策。该指标只是图表上的辅助工具,并不能取代您自己的判断。 交易涉及风险。过往业绩并不保证未来的结果。
欢迎您在评论区留言,提出问题和建议。

Ultra Advanced Alfa MA 是一款适用于 MetaTrader 4 的移动平均线指标。移动平均线可以平滑价格波动,帮助交易者看清市场的潜在方向。它直接显示在 MetaTrader 4 的图表上,供交易者作为分析时的辅助参考。 主要特点
- 以移动平均线的方式解读趋势
- 可作为图表上的动态参考区域
- 可用作其他信号的过滤器
- 易于使用,加载到图表后即可直接查看其显示的内容
- 提供演示版,您可以在购买之前先行测试,了解它在自己图表上的显示方式 推荐设置
建议在以下时间周期上使用:M30, H1, H4, D1
建议搭配使用的货币对:EUR/USD, USD/JPY, GBP/USD, USD/CHF, USD/CAD, AUD/USD, EUR/JPY 使用方法
使用该均线解读趋势或过滤其他交易形态,并配合您自己的分析和风险管理。该指标只是图表上的辅助工具,并不能取代您自己的判断。 交易涉及风险。过往业绩并不保证未来的结果。
欢迎您在评论区留言,提出问题和建议。

Ultra Advanced R1S1 Pivot 是一款适用于 MetaTrader 4 的枢轴点指标,专注于第一阻力位(R1)和第一支撑位(S1)。它为交易者提供一组简洁的当日参考价格。它直接显示在 MetaTrader 4 的图表上,供交易者作为分析时的辅助参考。 主要特点
- 专注于 R1 和 S1 枢轴位
- 简洁显示最近的枢轴参考位
- 有助于规划需要关注价格反应的位置
- 易于使用,加载到图表后即可直接查看其显示的内容
- 提供演示版,您可以在购买之前先行测试,了解它在自己图表上的显示方式 推荐设置
建议在以下时间周期上使用:M30, H1, H4, D1
建议搭配使用的货币对:EUR/USD, USD/JPY, GBP/USD, USD/CHF, USD/CAD, AUD/USD, EUR/JPY 使用方法
观察价格在 R1 和 S1 附近的反应,并根据您自己的方法和风险管理来规划止损和目标位。该指标只是图表上的辅助工具,并不能取代您自己的判断。 交易涉及风险。过往业绩并不保证未来的结果。
欢迎您在评论区留言,提出问题和建议。

Ultra Advanced Double MA 是一款适用于 MetaTrader 4 的移动平均线指标,使用两条移动平均线。比较两条均线是研究趋势方向和节奏的常用方法。它直接显示在 MetaTrader 4 的图表上,供交易者作为分析时的辅助参考。 主要特点
- 围绕两条移动平均线构建
- 有助于比较短期和较长期的方向
- 适用于 M30 至 D1 的趋势分析
- 易于使用,加载到图表后即可直接查看其显示的内容
- 提供演示版,您可以在购买之前先行测试,了解它在自己图表上的显示方式 推荐设置
建议在以下时间周期上使用:M30, H1, H4, D1
建议搭配使用的货币对:EUR/USD, USD/JPY, GBP/USD, USD/CHF, USD/CAD, AUD/USD, EUR/JPY 使用方法
通过比较两条均线来解读趋势,并通过您自己的分析和风险管理来确认任何决定。该指标只是图表上的辅助工具,并不能取代您自己的判断。 交易涉及风险。过往业绩并不保证未来的结果。
欢迎您在评论区留言,提出问题和建议。

Ultra Advanced MACD Pro 是一款适用于 MetaTrader 4 的基于 MACD 的指标。MACD 系列指标通过价格的两条移动平均线之间的关系来研究动量。它直接显示在 MetaTrader 4 的图表上,供交易者作为分析时的辅助参考。 主要特点
- 基于移动平均线趋同背离(MACD)的概念
- 帮助交易者跟踪动量的变化
- 可与趋势和价格行为分析相结合
- 易于使用,加载到图表后即可直接查看其显示的内容
- 提供演示版,您可以在购买之前先行测试,了解它在自己图表上的显示方式 推荐设置
建议在以下时间周期上使用:M30, H1, H4, D1
建议搭配使用的货币对:EUR/USD, USD/JPY, GBP/USD, USD/CHF, USD/CAD, AUD/USD, EUR/JPY 使用方法
将 MACD 读数作为您动量分析的参考之一,并配合您自己的规则和风险管理。该指标只是图表上的辅助工具,并不能取代您自己的判断。 交易涉及风险。过往业绩并不保证未来的结果。
欢迎您在评论区留言,提出问题和建议。

Ultra Advanced Money Line 是一款适用于 MetaTrader 4 的技术指标,在价格图表下方的独立窗口中显示震荡指标式的线条。它帮助交易者解读价格走势,而无需在主图表上添加对象。它直接显示在 MetaTrader 4 的图表上,供交易者作为分析时的辅助参考。 主要特点
- 在独立窗口中显示震荡指标式线条
- 保持主价格图表整洁
- 可与其他工具在同一图表上配合使用
- 易于使用,加载到图表后即可直接查看其显示的内容
- 提供演示版,您可以在购买之前先行测试,了解它在自己图表上的显示方式 推荐设置
建议在以下时间周期上使用:M30, H1, H4, D1
建议搭配使用的货币对:EUR/USD, USD/JPY, GBP/USD, USD/CHF, USD/CAD, AUD/USD, EUR/JPY 使用方法
将该线条作为观察市场行为的补充视角,并结合您自己的分析和风险管理。该指标只是图表上的辅助工具,并不能取代您自己的判断。 交易涉及风险。过往业绩并不保证未来的结果。
欢迎您在评论区留言,提出问题和建议。

Ultra Advanced AutoChannel 是一款适用于 MetaTrader 4 的通道指标。顾名思义,它用于自动显示价格通道,使交易者无需手动绘制即可研究市场的波动区间和方向。它直接显示在 MetaTrader 4 的图表上,供交易者作为分析时的辅助参考。 主要特点
- 自动通道分析
- 有助于直观了解价格运行的区间
- 无需手动绘制
- 易于使用,加载到图表后即可直接查看其显示的内容
- 提供演示版,您可以在购买之前先行测试,了解它在自己图表上的显示方式 推荐设置
建议在以下时间周期上使用:M30, H1, H4, D1
建议搭配使用的货币对:EUR/USD, USD/JPY, GBP/USD, USD/CHF, USD/CAD, AUD/USD, EUR/JPY 使用方法
将通道作为方向和区间的直观参考,并通过您自己的分析和风险管理来确认任何想法。该指标只是图表上的辅助工具,并不能取代您自己的判断。 交易涉及风险。过往业绩并不保证未来的结果。
欢迎您在评论区留言,提出问题和建议。

Ultra Advanced All Pivot 是一款适用于 MetaTrader 4 的枢轴点指标。枢轴位标示出市场可能暂停、反转或突破的参考价格,这款工具将它们显示在图表上。它直接显示在 MetaTrader 4 的图表上,供交易者作为分析时的辅助参考。 主要特点
- 基于枢轴点的支撑和阻力参考位
- 有助于规划需要关注价格反应的位置
- 适用于 M30 至日线图
- 易于使用,加载到图表后即可直接查看其显示的内容
- 提供演示版,您可以在购买之前先行测试,了解它在自己图表上的显示方式 推荐设置
建议在以下时间周期上使用:M30, H1, H4, D1
建议搭配使用的货币对:EUR/USD, USD/JPY, GBP/USD, USD/CHF, USD/CAD, AUD/USD, EUR/JPY 使用方法
观察价格在枢轴位附近的表现,并根据您自己的方法和风险管理来设置止损和目标位。该指标只是图表上的辅助工具,并不能取代您自己的判断。 交易涉及风险。过往业绩并不保证未来的结果。
欢迎您在评论区留言,提出问题和建议。
军事狗s-军队将帮助您确定印第安处理的入口点。 他为所有的罪犯工作 您可以通过双击策略从设置中打开ADR级别。 如果您关闭ADR功能,它会发现更多的交易。
特别是,除了你自己的策略,它可以让你通过一个更好的质量过滤器处理输入。
你想ADR水平平均一定的每日成交量和信号的交易,当点的数量接近这些水平? 我们将其设置为50点,在一般设置中,我们关闭了ADR控制。 若要打开,您需要将策略1ADR控制设置设置为true。 实验的指标,以找到合适的设置为您服务。
指数paritates和它看起来在所有时期不同的尝试。 这样的折扣的帮助将有一个互补的效果,为你赢得。 ...............................
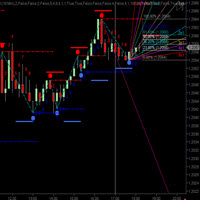
CycleTraderPro CycleWave 指标是1中的9个指标。 它使用CycleTraderPro指标和模式实时识别周期和更多。 CycleWave的9个部分: 绘制循环带并在每个成功循环高或低后实时确认循环高/低。 使用前一个条形的修改%范围绘制每个条形图上方和下方的循环波形价格。 在每个周期后自动绘制Fibonacci Retracement,从周期的低点和高点开始。 自动绘制每个循环的江恩风扇低和高。 每个周期低和高后自动绘制趋势线。 在循环计数方向上使用前一个X条范围的范围自动绘制价格目标窗口。 自动绘制每个周期低和高的突破线。 自动绘制速度线从前一个价格的确切角度移出到未来,以显示价格和时间在一起的位置。 自动绘制拥堵箱,以显示价格可能上涨或下跌的位置。 由于我们如何使用数学和模式,CycleWave可以对许多其他常见指标进行任何自动计算。节省大量时间尝试自己绘制这些值。我们相信4至9巴的循环次数。随着市场的变化,这些值将自动显示在您的图表上。 输入: 1 - Cycles - 设置高峰和低音循
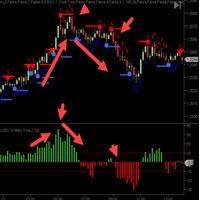
CycleTraderPro关闭强度值指示器测量从新柱的OPEN到该柱的CLOSE的距离。 输入 - 长度= 10默认值 我们将这些值一起添加回长度设置。 如果第一个柱子加上10个刻度,然后下一个柱子是负7个刻度,那么这将记录+3 交易收盘价有两种方式: 1.向低点和低点交易,反之亦然买入,高点和低点。 2.当指标在颜色方向上穿过中间零点时进行交易。红色=卖出/绿色=买入。 Close Strength还将显示一个直方图,以查看过去的动作,以了解市场在停止或撤消之前可以达到多远。 ------------------ The CycleTraderPro Close Strength Value Indicator measures the distance from the OPEN of a new bar to the CLOSE of that bar. Input - length = 10 default We add these values together going back the the length setting. If the 1st bar was pl
FREE
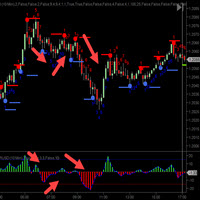
CycleTraderPro Tick Momentum 测量市场在连续收盘方向上移动的价格。 当市场收盘高于其结束时,它将开始计算它移动了多少滴答。 如果下一个柱位于移动中并以相同方向关闭,则Tick Momentum将继续计数,直到市场收盘低于开盘价。然后它将开始向这个方向倒数。 你可以看到这些移动的趋势,零点为正或负。 我们将每个条形图显示为红色,显示为向下,蓝色为蓝色。 然后,我们绘制一条纯白线,表示每次移动的刻度总数。 输入: 1 - 打开或关闭移动平均线 2 - 移动平均线的长度默认为10 当市场处于极端状态时,您可以考虑获利或进入头寸。你会发现市场通常是x刻度和反转 移动平均线是另一条绘制线,平滑了刻度范围。 尝试一个演示,看看它是如何工作的。
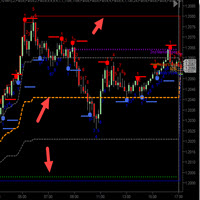
CycleTraderPro Open / High / Low / Medium OHL 获取当天的低点和高点,并绘制这些值: 1.一天中的高点(红线) 2.一天的低点(蓝线) 3.低25%(灰线) 4.范围的50%(橙线) 5.低75%(灰线) 我们期待远高于50%的范围并且短于下方 随着市场的变化,您可以轻松地看到这些水平。如果市场创出一个新的低点或高点,所有价值将随市场日自动移动。 您可以在输入中调整这些级别以适合您的交易方式。 我们发现市场将会在这些水平附近移动,为您提供进入或退出市场的价格水平。 OHL中等水平将自动调整。将此指标与其他指标结合使用时,可以更轻松地查看 价格点,否则很难看到。 随意获取演示并尝试使用OHL Medium指标进行交易。
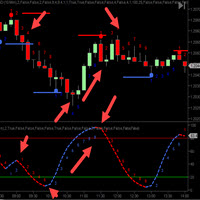
CycleTraderPro电力游戏指标(PPI ) - 是我们最喜欢的指标之一。我们采用所有CT指标并将它们合并为一个指标。 整个指标选择带有开/关功能,这意味着您可以选择自己的指标组合,只绘制这种组合。 我们选择平均混合物。选择5个指标时,PPI会将混合值除以5。 然后,我们绘制每个移动方向的循环计数,以帮助您进入和退出计划的时间。 红色下降,蓝色上升。 它最适合观察趋势和趋势逆转。 输入: 1.首先选择是开启或关闭所有CT指示器 2.显示箭头 - 指示器转动的图表上显示的箭头 - 开/关 3.偏移 - 这告诉图表底池有多远可以绘制转弯箭头。 ----------------- The CycleTraderPro Power Play Indicator (PPI) - is one of our favorite indicators. We take all the CT Indicators and combine them into one indicator.
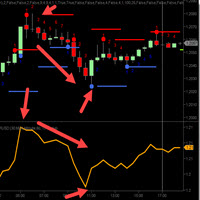
CycleTraderPro Orange Line - Bressert DDS - DoubleStoch - 我的父亲,Walter Bressert 使这些DDS成名多年。 他们使用来自随机的代码,然后再使用1行将它们再次平滑。 根据指标的长度,更长的趋势和更短的市场规模,橙色线是100长度。 交易橙线有两种方式: 1.在同一方向上交易高于和低于50的水平。以上是买入,下面是卖出持有。 2.交叉进行交易。等待它先降到20以下,然后再回到2o以上买入。或者,80以上,然后回到80线以下卖出。 我们建议您按照这些说明使用其他指标并使用停止点。 试用一个演示,看看它是如何为你工作的。 输入: 1.默认情况下,长度设置为100 2.默认情况下,长度设置为100

Keltner MTF (Not repaint!!!) is a channel indicator that can display price channels from different timeframes on a single chart of quotes. For example, on the H1 chart, you can see at the same time the Keltner price channel from the M15 and H4 timeframe. This tactic makes it possible to more clearly understand the tendency of price movements, to determine trading goals and points for making deals. How the Keltner MTF Indicator Works The Keltner MTF indicator can be used both - for trading in

The elite (V3) multi-indicator suite from JoaquinTrading specifically geared towards Forex & binary options, including regulated exchanges such Nadex, Cantor Exchange, and other binary option brokers.
The Probability Tool Suite Elite will provide the given win/loss outcome probabilities of up to 10 strike levels, a specific expiration duration, based on a combination of up to 16 indicators, rules, or conditions and derivative behavior (i.e. expiry, touch, touch & retrace). Using this indicato

The principle of the indicator. The StatChannel ( SC ) indicator is a development of the Bollinger Bands indicator ( ВВ ). BB is a moving average, on both sides of which two lines are drawn, separated from it by standard deviations std multiplied by the corresponding coefficient. At the same time, a moving average with an averaging period (2n + 1) bars is always obtained lagging behind n bars. Sliding std is also lagging behind on n bars, also calculated by (2n + 1) points. Such
Sessions PRO is a perfect tool which divide your chart screen by 3 main market sessions: 1> asian 2> european (with division for Frankfurt and London start) 3> american
Sessions PRO is perfect especially for trading indices, where main pivot points often occurs along with new market center enters the market. With Sessions PRO you see what events happened at their exact corresponding time - European and American moves and pivot points are much more important than asian. Stop analyzing your chart

FZR indicator determines fractal zigzag reversal pattern of all the time frames of the chosen symbol and shows the information in the Info label. Indicator draws the detected pattern in the chosen time frame and also you can select in the menu to draw the trend line according to FZR peaks. What it is FZR? See the first picture in the screenshots. As you can see for every peak of FZR the AO indicator must cross zero line. FZR indicator determines the trend direction.
How to use FZR for trading?
FREE

This indicator is based on the previous option ( https://www.mql5.com/ru/market/product/37376 ) and includes all completions at the time of creation. Availability of additional data allows to understand more deeply the principle of work as this indicator and original. Points on extrema of bars show history of a portrayal of extrema as before. Levels of a reverse show as far as the price for formation of a new shoulder has to deviate. The Price noise parameter has a special impact (the name "devi
The indicator is made on the basis of the algorithm put in the ZigZag History indicator ( https://www.mql5.com/ru/market/product/37376/ ).
In the real option there are no additional buffers and an opportunity to trace work history.
It causes the minimum involvement of random access memory, however productivity practically does not improve. Attention! The Price noise parameter - has significant effect on formation of extrema. Parameters: Depth - is depth of search of a local extremum in bars;
MetaTrader市场是您可以下载免费模拟自动交易,用历史数据进行测试和优化的唯一商店。
阅读应用程序的概述和其他客户的评论,直接下载程序到您的程序端并且在购买之前测试一个自动交易。只有在MetaTrader市场可以完全免费测试应用程序。
