适用于MetaTrader 4的新技术指标 - 7
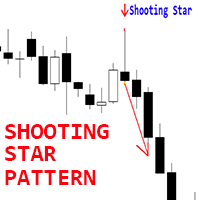
适用于 MT4 的 Crypto_Forex 指标“流星形态”。
- “流星形态”指标是价格行为交易的强大指标:无需重绘,无延迟。 - 指标可检测图表上的看跌流星形态:图表上显示红色箭头信号(见图)。 - 支持 PC、手机和电子邮件提醒。 - “流星形态”指标非常适合与支撑/阻力位结合使用。 ................................................................................................................. // 优秀的交易机器人和指标可在此处获取: https://www.mql5.com/en/users/def1380/seller 这是仅在 MQL5 网站上提供的原创产品。
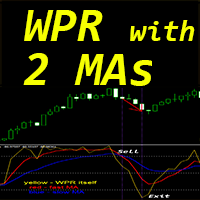
Crypto_Forex 指标“WPR 和 2 条移动平均线”适用于 MT4,无需重绘。
- WPR 本身是剥头皮交易的最佳振荡器之一。 - “WPR 和 2 条移动平均线”指标允许您查看 WPR 振荡器的快速和慢速移动平均线。 - 指标让您有机会尽早看到价格修正。 - 通过参数设置此指标非常容易,可在任何时间范围内使用。 - 您可以在图片上看到买入和卖出入场条件。 - 考虑买入信号条件: (1) - 快速 MA 向上穿过慢速 MA 且 WPR 值低于 -50 值:开启买入交易。 (2) - WPR 值在 -20 以上的超买区域:退出买入交易。 (3) - 卖出交易反之亦然。
// 出色的交易机器人和指标可在此处获得: https://www.mql5.com/en/users/def1380/seller 这是仅在此 MQL5 网站上提供的原创产品。
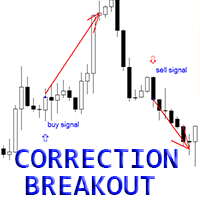
Crypto_Forex MT4 版“修正突破形态”指标。
- “修正突破形态”指标是一款非常强大的价格行为交易指标:无需重绘,无延迟。 - 指标可检测价格修正后的看涨和看跌突破条形: - 看涨修正突破形态 - 图表上显示蓝色箭头信号(见图)。 - 看跌修正突破形态 - 图表上显示红色箭头信号(见图)。 - 提供 PC、手机和电子邮件提醒。 - “修正突破形态”指标可与支撑/阻力位结合使用。 ................................................................................................................. // 优秀的交易机器人和指标可在此处获取: https://www.mql5.com/en/users/def1380/seller 本产品为独家产品,仅在 MQL5 网站上提供。
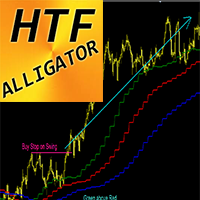
Crypto_Forex MT4 鳄鱼线高时间框架指标。
- 鳄鱼线指标是最强大的趋势指标之一。HTF 表示“高时间框架”。 - 该指标非常适合趋势交易者,也可与价格行动入场相结合。 - HTF 鳄鱼线指标允许您将高时间框架的鳄鱼线附加到您当前的图表上。 - 仅当绿线高于红线且红线高于蓝线时才考虑买入 - 在图表上最新波动幅度的最大值处设置买入止损挂单。 - 仅当绿线低于红线且红线低于蓝线时才考虑卖出 - 在图表上最新波动幅度的最小值处设置卖出止损挂单。 - HTF 鳄鱼线指标让您有机会以低风险获得巨额利润。
// 优秀的交易机器人和指标可在此处获取: https://www.mql5.com/en/users/def1380/seller 这是仅在 MQL5 网站上提供的原创产品。
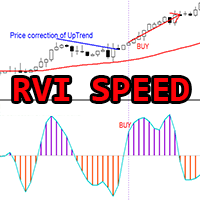
适用于 MT4 的 Crypto_Forex 指标“RVI 速度”,无需重绘。
- 该指标基于物理方程计算。RVI 速度是 RVI 本身的一阶导数。 - Relative_Vigor_Index (RVI) 本身是一个技术动量指标,在趋势市场中非常有用。 - RVI 速度非常适合在价格回调至主趋势方向后进行动量入场。 - 可与合适的趋势指标结合使用,例如标准 EMA(如图所示)。 - RVI 速度指标显示 RVI 本身方向变化的速度,非常灵敏。 - 如果 RVI 速度指标的值小于 0:速度为负;如果 RVI 速度指标的值大于 0:速度为正。 - 指标内置移动端和 PC 端警报。
// 优秀的交易机器人和指标可在此处获取: https://www.mql5.com/en/users/def1380/seller 这是仅在 MQL5 网站上提供的原创产品。
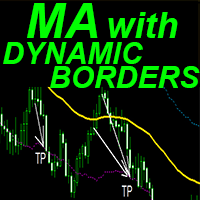
Crypto_Forex MT4 指标“带动态边界的移动平均线”。
- 该指标具有移动平均线的独特功能——动态波动边界。 - 动态波动边界使用平均真实波动范围值进行计算。 - 该指标非常适合止盈目标和边界线上的止损设置。 - 该指标也非常适合与价格行动信号结合使用。 ................................................................................................................. // 优秀的交易机器人和指标可在此处获取: https://www.mql5.com/en/users/def1380/seller 这是仅在 MQL5 网站上提供的原创产品。

产品名称 A arca 主要功能 自动识别关键区间
A arca可自动检测并标示支撑和阻力水平,帮助交易者更轻松地发现潜在的买卖点。 清晰的买卖信号
提供清晰的买入和卖出标记,帮助交易者定义进出场的最佳时机,提高交易决策的效率。 多周期分析
整合不同周期(如M5, M15, H1等)的图表数据,有助于从多角度洞察市场趋势,提高分析的准确度。 可自定义且易于使用的界面
允许用户根据个人需求和策略定制颜色、线条及水平,让技术分析环境更加个性化。 风险管理工具
通过识别可能出现的反转区域,A arca帮助交易者更轻松地设置止损与止盈,提升风险管理的有效性。 主要优势 决策更迅速、更准确
自动识别关键区域,减少手动分析的时间,提高决策速度与自信度。 节省时间和精力
清晰直观的可视化信号,让交易者可将更多精力投入策略和风险控制,而非纠结于繁琐的图表分析。 提升交易成功率
多周期分析与精准信号结合,能有效提高交易成功率并增强整体绩效。 兼容多种交易风格
无论是日内交易、剥头皮交易还是波段交易,A arca都能满足不同投资者的需求。 与众不同之处 智能化自动分析
采用高级算法自动
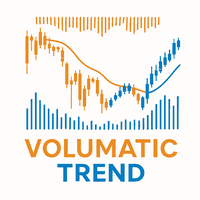
Volumatic Trend is a powerful, trend-following indicator that merges directional analysis with real-time volume behavior. By combining adaptive trend logic and volume overlays, it gives traders a detailed snapshot of market conviction and potential turning points. From instant trend shift detection to volume-weighted candle visuals, this tool brings deeper context to price movement. MT5 Version - https://www.mql5.com/en/market/product/136211/ Join To Learn Market Depth - https://www.mql5.com/
FREE
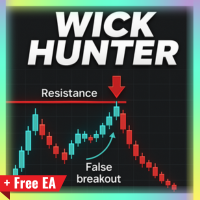
After purchase, you are eligible to receive EA Forex Proton and try it for 14 days completely FREE! This robot automates the alerts from Wick Hunter!
Tired of getting trapped by false breakouts? Wick Hunter is a powerful custom indicator designed to detect fakeouts and identify true reversals before the crowd catches on. Built on the proven False Breakout Strategy , Wick Hunter helps you: Spot liquidity grabs and stop-hunts Enter with precision near wicks Avoid fake breakouts that ruin trades

Overview
The TTM Squeeze indicator helps identify low volatility periods (squeeze) that often precede price breakouts. It uses Bollinger Bands (BB) and Keltner Channels (KC) to determine when the market is "coiling" and ready to move. Configuration Guide Volatility Settings The indicator uses Bollinger Bands to measure market volatility. When BBs are inside Keltner Channels, a squeeze is detected. The squeeze suggests the market is consolidating and may soon break out. True Range Option Optiona
FREE
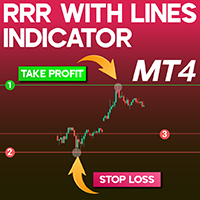
RRR with lines Indicator Download MT4 Effective risk management is crucial for consistent success in financial markets. The RRR with lines is designed to help traders evaluate the relationship between potential profit (Reward) and possible loss (Risk). This powerful tool for MetaTrader 4 (MT4) simplifies the process of calculating the risk-to-reward ratio , aiding traders in making well-informed decisions. «Indicator Installation & User Guide»
MT4 Indicator Installation | RRR with lines Indic
FREE
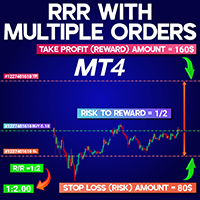
Risk to Reward Ratio Multiple Orders MT4 Risk to Reward Ratio Multiple Orders MT4 is a specialized indicator developed for MetaTrader 4, enabling traders to precisely evaluate the relationship between stop loss (SL) and take profit (TP) levels in real time. Once a position is initiated in MT4 with SL and TP defined, the tool measures the distance between these levels relative to the entry price and presents the risk/reward ratio on the top-left corner of the chart. This feature becomes especiall
FREE
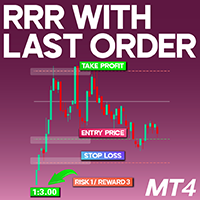
Risk-Reward Ratio with Last Order Indicator for Meta Trader 4 The Risk-Reward Ratio with Last Order (RRO) Indicator is a valuable tool designed for traders who need a precise calculation of their risk-to-reward ratio within the Meta Trader 4 (MT4) environment. This indicator evaluates the distance between the stop loss and the entry price and compares it to the take profit level. It then automatically calculates and displays the risk-to-reward ratio in the upper left corner of the trading chart.
FREE
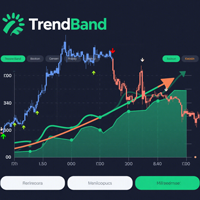
TrendBand Navigator Pro —— 永不重绘的多周期趋势交易系统,独创的多维趋势带算法,为您提供清晰的箭头信号
大箭头定方向 小箭头抓买卖
核心优势 智能过滤噪音 :融合波动率自适应技术,有效规避虚假突破,仅在趋势动能强劲时触发箭头信号 多时间框架兼容 :无论日内短线或波段交易,自动适配1分钟至月线图,满足不同策略需求 视觉化K线图表 :双色K线,辅助判断趋势延续性 零延迟箭头信号 :提前标注潜在反转点,双色箭头醒目提示多空转换
交易策略 第一步:双重验证开仓 1. 大箭头定趋势 - 等待趋势启动信号(彩色趋势带+大箭头) 2. 小箭头抓时机 - 当同方向小箭头出现时立即进场 第二步:智能分批离场 • 保守策略 :反向箭头出现时全仓平仓 • 激进策略 :盈利20-30点后平半仓,剩余仓位带移动止损直至趋势反转

PinBar Hunter – Smart Pin Bar Indicator with Built-in Control Panel and Signal Filters PinBar Hunter is a powerful tool for technical traders that automatically detects classic Pin Bar patterns (reversal candles) on the chart.
It’s designed for price action strategies, candlestick analysis, and trading around key support/resistance levels. Indicator Features: Detects classic Pin Bars (reversal candlestick patterns)
Works on any timeframe and instrument
Suitable for trend-following an

Belladonna is an advanced custom technical indicator for MetaTrader 4 based on Hull Moving Average (HMA). It visualizes the trend direction using colored lines and arrows on the chart. The indicator is optimized to minimize lag and eliminate market noise, making it especially useful for short-term and medium-term trading.
Functions and Features: Moving Average Type: Hull Moving Average (based on two EMA/SMA lines).
Calculation Methods: Support for different types of moving average (SMA, EMA,

MT5 version Overview
The Lowess Channel indicator is a smoothed trend-following tool designed to help traders identify the direction of the trend , detect flat or ranging markets , and spot breakouts from consolidation zones. It creates a central smoothed line with upper and lower channel boundaries, adapting to market noise while maintaining clarity. How It Works The indicator builds a channel around a smoothed price line. The central line reflects the current trend. The upper and lower bound
FREE
Using multiple timeframes for analysis with Multi Timeframe Average Directional Index can provide several significant benefits for traders: Comprehensive Market View: By applying Mtf ADX Standard across different timeframes, traders gain a broader perspective on market dynamics. This allows them to identify trends, patterns, and potential reversal points that might be more apparent or consistent across various scales. Enhanced Pattern Recognition: Multiple timeframes help in identifying repeati
FREE

Using multiple timeframes for analysis with Mtf MACD Standard can provide several significant benefits for traders: Comprehensive Market View: By applying Mtf MACD Standard across different timeframes, traders gain a broader perspective on market dynamics. This allows them to identify trends, patterns, and potential reversal points that might be more apparent or consistent across various scales. Enhanced Pattern Recognition: Multiple timeframes help in identifying repeating patterns or structur
FREE
Level Box Tool is a powerful and user-friendly custom indicator designed for traders who utilize technical analysis tools like rectangles and trend lines to identify key support, resistance, and price zones. This tool simplifies and speeds up the process of marking chart levels, offering both visual clarity and precision with its fully customizable panel, and now includes price-cross alerts — so you’ll never miss a key level again. MT5 Version - https://www.mql5.com/en/market/
FREE

Using multiple timeframes for analysis with Multi Timeframe Average True Range can provide several significant benefits for traders: Comprehensive Market View: By applying Mtf ATR Standard across different timeframes, traders gain a broader perspective on market dynamics. This allows them to identify trends, patterns, and potential reversal points that might be more apparent or consistent across various scales. Enhanced Pattern Recognition: Multiple timeframes help in identifying repeating pat
FREE
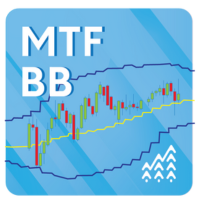
Using multiple timeframes for analysis with Multi Timeframe Bollinger Bands can provide several significant benefits for traders: Comprehensive Market View: By applying Mtf Bands Standard across different timeframes, traders gain a broader perspective on market dynamics. This allows them to identify trends, patterns, and potential reversal points that might be more apparent or consistent across various scales. Enhanced Pattern Recognition: Multiple timeframes help in identifying repeating patt
FREE

Fibomathe Indicator: Support and Resistance Tool for MT4 The Fibomathe Indicator is a technical analysis tool designed for MetaTrader 4 (MT4) that assists traders in identifying support and resistance levels, take-profit zones, and additional price projection areas. It is suitable for traders who use structured approaches to analyze price action and manage trades. Key Features Support and Resistance Levels:
Allows users to define and adjust support and resistance levels directly on the chart. L
FREE

Overview Inspired by Tradingview’s falconCoin, The Market Cipher indicator is a momentum oscillator used to detect overbought/oversold conditions and potential trend reversals. Traders can also use it to spot divergences between price action and momentum for early entry or exit signals. Configuration Guide Core Indicator Settings The indicator calculates momentum using a short-term and a longer-term average. Momentum is plotted as a wave oscillating between overbought and oversold thresholds. Ov
FREE
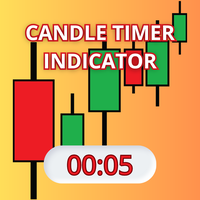
Candle Timer Indicator is a custom tool designed for the MetaTrader 4 (MQL4) trading platform. Its primary purpose is to display a moving timer on the chart, indicating the remaining time before the current candle closes. This feature is particularly useful for traders who need precise tracking of candle closing times for their technical analysis strategies.
Dynamic Color Change: The ti
FREE

Multi Stochastic Display – The Ultimate MTF Trade Scanner for Forex & Crypto Multi Stochastic Display is a powerful multi-timeframe trading tool that gives you a professional edge in analyzing market momentum. Designed for both Forex and Crypto traders, this clean and modern indicator visually presents BUY and SELL signals across 9 timeframes (from M1 to Monthly) for over 25 instruments. Its intuitive panel automatically ranks all instruments based on their strongest stochastic trend – whethe
Supply demand zone with added Alerting system. Why this supply demand indicator is different? Zones are not traditional zones. these are KIRI zones. these are high probability zones where market reacts no matter how much. Most people including me have been missed out of trade because we somehow got distracted. no worries, i have added an alert to our zones now. (Metatrader doesn't show alerts in strategy tester) Most people dont know when to enter the market when it comes to zone based trading.

Tento jedinečný indikátor vám ukazuje rozsah, v ktorom sa pohybujú maloobchodní klienti. Spravidla, ak sa cena udržiava na priemernej úrovni, neskôr dosiahne vrchol a potom sa vráti na opačnú stranu. Indikátor je vhodný pre všetky grafy s možnosťou nastavenia pákového efektu, teda ak zoberieme do úvahy, že retailoví klienti sa pohybujú na trhu s pákovým efektom 500 až 100 páka. Indikátor je vhodný pre väčšie časové rámce H1,H4... s väčšími pákami 100,50,25 ale aj pre malé grafy M5,M15 s pákami

The indicator is based on the calculation of liquidity on the market and thus shows where the market can most likely turn.. It shows the places of liquidity where the price will reach sooner or later... The indicator can be set to several types of liquidity and therefore can display several levels on the graph.. It is a unique tool that can help you very well in your trading The indicator is suitable for currency pairs with the most liquidity (Forex,EURUSD,GBPUSD...) The indicator is suitable fo
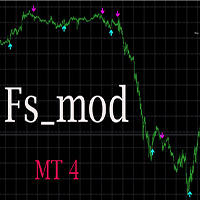
Fs_mod стрелочный индикатор, указатель направления тренда. Индикатор НЕ перерисовывает и не изменяет свои показания, стрелки появляются по закрытию бара и остаются на своих местах. При появлении стрелки дает несколько типов оповещений. Индикатор предназначен для использования на следующих финансовых инструментах: - Forex - индексы - акции. Рекомендуется использовать на таймфреймах не ниже 15 мин

IQ Gold Gann Levels a non-repainting, precision tool designed exclusively for XAUUSD/Gold intraday trading. It uses W.D. Gann’s square root method to plot real-time support and resistance levels, helping traders spot high-probability entries with confidence and clarity. William Delbert Gann (W.D. Gann) was an exceptional market analyst, whose trading technique was based on a complex blend of mathematics, geometry, astrology, and ancient mathematics which proved to be extremely accurate. Download

首先值得强调的是,这个交易指标是非重绘、非回绘和非滞后的,这使得它非常适合手动交易和算法交易。 包括用户手册、预设和在线支持。 AI Trend Pro Max 是一个复杂的全能交易系统,专为寻求精确性、力量和简便性的交易者设计。它基于多年的开发,并继承了之前指标的优势,这是目前最先进的版本——配备了多个信号层、专业级滤波器和智能用户界面。 无论您是初学者还是专业交易者,AI Trend Pro Max 都为您提供了在任何市场条件下自信交易所需的一切。 主要策略和系统逻辑: 多层信号引擎:结合趋势动量、价格强度、成交量、RSI、布林带和蜡烛颜色逻辑,提供高概率的入场信号。 趋势动量:帮助确认趋势是否在增强还是在减弱。
价格强度:衡量价格趋势背后的力度,帮助确认突破或波动是否有真实动能,还是可能会消退。
成交量:作为确认每个价格变动强度和可靠性的层次。
RSI:检测市场中的超买和超卖条件,作为过滤器排除不良交易。
布林带:基于价格扩展和收缩的过滤器,用来避免区间和价格波动较大的走势。
蜡烛颜色策略: 绿色蜡烛 = 买入信号
红色蜡烛 = 卖出信号
紫色蜡烛 = 弱势信号(表示可能的
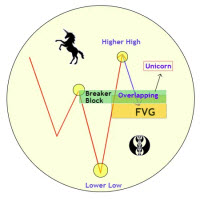
Unicorn Model ICT Indicator — Smart Trading with Precision The Unicorn Model ICT Indicator is a powerful and intelligent tool designed for traders who follow Smart Money Concepts (SMC) and Inner Circle Trader (ICT) methodologies. This indicator simplifies complex price action by visually identifying key market structures and providing high-probability trade setups. Key Features: A Bullish Unicorn Pattern A Lower Low (LL), followed by a Higher High (HH) A Fair Value Gap (FVG), overla
高低点追踪器 是任何重视精确度和清晰度来识别关键价格水平的交易者必不可少的指标。此工具专为使用机构策略(如 ICT(内部交易者) 、 BTMM(银行交易做市商) 和 SMC(智能货币概念)) 的交易者而设计,通过将重要的 高点和低点 直接绘制到当前图表上,简化了多时间框架分析。无论您是剥头皮交易、日内交易还是波段交易,此指标都可让您即时访问主要支撑位和阻力位,而无需不断切换图表。
谁需要这个指标? 此工具非常适合以下交易者: 对于低时间范围条目使用更高的时间范围偏差(例如 ICT 和 SMC)。 需要确定止损追踪和陷阱设置的流动性区域。 依靠关键支撑/阻力位来下订单。 当价格触及机构水平时需要实时警报。 在 1m/5m 图表上交易时,优先考虑多时间框架精度。
它为什么重要?
主要时间范围内的高点和低点通常充当磁性价格区,吸引大量市场活动。这些水平通常是机构订单堆积的地方,形成推动价格大幅波动的流动性池。做市商经常瞄准这些区域来寻找止损点或启动趋势逆转,为精明的资金交易者创造了理想的设置。此外,突破和重新测试通常发生在这些价格点附近,提供高概率的进入机会。通过在从 M5

ICT 亚洲区间指标 是一款功能强大的工具,旨在帮助交易者根据 ICT 亚洲区间交易策略识别关键市场结构和流动性区域。它标记了亚洲交易时段(纽约时间晚上 7 点至午夜)的最高价和最低价,并为接下来的交易时段的市场走势提供了重要见解。该指标通过突出流动性扫荡和公允价值缺口 (FVG) 来提高交易准确性,使其成为 ICT 交易者必不可少的工具。
为什么亚洲范围如此重要? 亚洲交易时段为后续交易时段的价格走势奠定了基础。了解这一范围可让交易者预测市场情绪、找到流动性区域并制定战略性交易入场和出场。
ICT 亚洲指数的主要优势及使用方法 ICT 亚洲区间指标为交易者提供早期市场洞察,帮助他们在伦敦和纽约交易时段开始前预测每日趋势和情绪。通过识别流动性定位,该指标突出了机构交易者可能进入或退出头寸的区域,从而更深入地了解市场行为。该指标还有助于预测波动性和潜在突破点,让交易者为即将到来的交易时段的价格变动做好准备。此外,它还是一种有价值的风险管理工具,为止损和止盈设置提供了明确的参考点,从而降低了整体交易风险。
要有效使用 ICT 亚洲区间指标,交易者首先应确定亚洲区间,即交易时段内
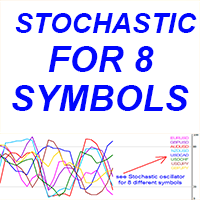
适用于 MT4 的“8 个符号随机指标”外汇指标,无需重绘。
- 随机震荡指标是市场上最好的指标之一 - 是许多交易者的完美工具。 - 超买区域 - 高于 80;超卖区域 - 低于 20。 - 非常适合从高于 80 的区域进行卖出,从低于 20 的区域进行买入。 - “8 个符号随机指标”让您有机会在 1 张图表上控制多达 8 个不同符号的随机指标值。 - 此指标也非常适合与价格行动条目结合使用。 ................................................................................................................. // 出色的交易机器人和指标可在此处获得: https://www.mql5.com/en/users/def1380/seller 这是仅在此 MQL5 网站上提供的原创产品。
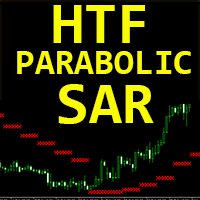
Crypto_Forex 指标抛物线 SAR 更高时间框架适用于 MT4。无需重绘。
- 使用适用于 MT4 的出色辅助 HTF PSAR 指标升级您的交易方法。HTF 表示 - 更高时间框架。 - PSAR 用于确定趋势方向和价格变动中的潜在逆转。 - 此指标非常适合用于追踪止损目的。 - 如果 PSAR 位于价格上方 - 则为下降趋势。 - 如果 PSAR 位于价格下方 - 则为上升趋势。 - 此指标非常适合与价格行动条目结合,以进入主要趋势方向。 ................................................................................................................. // 出色的交易机器人和指标可在此处获得: https://www.mql5.com/en/users/def1380/seller 这是仅在此 MQL5 网站上提供的原创产品。
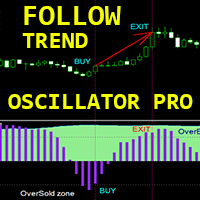
“跟随趋势振荡器专业版” - 是一款适用于 MT4 的高级自定义 Crypto_Forex 指标,高效的交易工具!
- 用户友好的指标提供了在主要趋势方向上进行剥头皮交易的机会。 - 平滑且可调节的振荡器,带有信号直方图部分。 - 振荡器绿色表示上升趋势,棕色表示下降趋势。 - 超卖值:低于 -30;超买值:超过 30。 - 使用此指标,有很多机会升级标准策略。 - 它具有信息价差掉期显示 - 它显示所附外汇对的当前价差和掉期。 - 显示屏还显示账户余额、净值和保证金。 - 可以在图表的任何角落找到信息价差掉期显示: 0 - 左上角,1 - 右上角,2 - 左下角,3 - 右下角。
// 出色的交易机器人和指标可在此处获得: https://www.mql5.com/en/users/def1380/seller 这是仅在此 MQL5 网站上提供的原创产品。
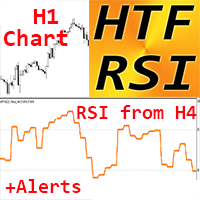
Crypto_Forex 指标 HTF RSI 振荡器适用于 MT4。
- RSI 本身是最好和最受欢迎的振荡器之一。HTF 表示 - 更高时间框架。 - 当 RSI 高于 70 时为超买区域,低于 30 时为超卖区域。 - RSI 提供有关看涨和看跌价格动量的信息。 - 此指标非常适合具有价格行动条目或与其他指标结合使用的多时间框架交易系统。 - HTF RSI 指标允许您将更高时间框架的 RSI 附加到当前图表。 - 指标具有内置的移动和 PC 警报。 ................................................................................................................. // 出色的交易机器人和指标可在此处获得: https://www.mql5.com/en/users/def1380/seller 这是仅在此 MQL5 网站上提供的原创产品。
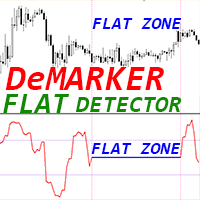
Crypto_Forex 指标“DeMarker FLAT Detector” - 是一种高效的交易辅助工具!无需重绘。 我建议您使用这款出色的 MT4 指标来升级您的交易方法。
- 指标在图表上显示价格平坦区域。它具有“平坦灵敏度”参数 - 负责平坦检测。 - “DeMarker FLAT Detector”可用于价格行动条目确认或与其他指标结合使用。 - 您可以将其用于趋势跟踪系统以检测平坦区域并避免在那里交易。 - 您可以将其用于反转剥头皮 - 从平坦边界交易反转。 - 有很多机会可以使用“DeMarker FLAT Detector”代替标准 DeMarker 振荡器。 - DeMarker 本身提供了其他振荡器中最有效的常规发散信号。 - 当 DeMarker 高于 0.7 时为超买区域,当 DeMarker 低于 0.3 时为超卖区域。
// 出色的交易机器人和指标可在此处获得: https://www.mql5.com/en/users/def1380/seller 这是仅在此 MQL5 网站上提供的原创产品。
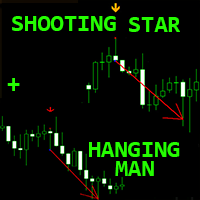
适用于 MT4 的 Crypto_Forex 指标“上吊线和射星形态”。
- 指标“上吊线和射星形态”是价格行为交易的强大工具:无需重绘,无延迟。 - 指标可检测图表上的看跌上吊线和射星形态: - 看跌上吊线 - 图表上的红色箭头信号(见图片)。 - 看跌射星 - 图表上的橙色箭头信号(见图片)。 - 带有 PC、手机和电子邮件提醒。 - 指标“上吊线和射星”非常适合与支撑/阻力位结合使用。 ................................................................................................................. // 出色的交易机器人和指标可在此处获得: https://www.mql5.com/en/users/def1380/seller 这是仅在此 MQL5 网站上提供的原创产品。
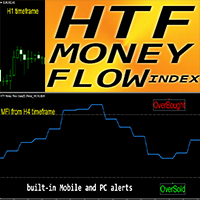
Crypto_Forex 指标 HTF MFI 振荡器适用于 MT4。
- 资金流量指数 (MFI) 是一种技术振荡器,它使用价格和交易量数据来识别超卖和超买区域。 - HTF 表示 - 更高的时间框架。超买 - 当 MFI 高于 80 时,超卖 - 当 MFI 低于 20 时。 - MFI 非常适合与价格行动信号结合使用。它提供有关看涨和看跌价格动量的信息。 - 该指标非常适合与其他指标结合使用多时间框架交易系统。 - HTF MFI 指标允许您将更高时间范围内的 MFI 附加到当前图表。 - 指标具有内置的移动和 PC 警报。
// 出色的交易机器人和指标可在此处获得: https://www.mql5.com/en/users/def1380/seller 这是仅在此 MQL5 网站上提供的原创产品。
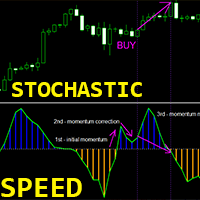
Crypto_Forex 指标“随机速度”适用于 MT4 - 出色的预测工具,无需重绘。
- 该指标的计算基于物理方程。 - 随机速度是随机本身的一阶导数。 - 建议将随机速度指标用于剥头皮动量交易策略(见图片): - 如果随机速度高于 0 - 这是正速度:价格动量上升。 - 如果随机速度低于 0 - 这是负速度:价格动量下降。 - 随机速度指标显示随机本身改变方向的速度 - 它非常敏感。 - 指标具有内置的移动和 PC 警报。 ................................................................................................................. // 出色的交易机器人和指标可在此处获得: https://www.mql5.com/en/users/def1380/seller 这是仅在此 MQL5 网站上提供的原创产品。

Crypto_Forex 指标“主要趋势修正直方图”适用于 MT4,无需重绘。
- 主要趋势修正直方图指标旨在检测大趋势。 - 指标可以采用 2 种颜色:红色表示看跌趋势,蓝色表示看涨趋势(可以更改颜色)。 - 至少 10 个连续的相同颜色的直方图列表示新趋势的开始。 - 指标具有内置的移动和 PC 警报。 - 参数“周期”负责指标的灵敏度。
如何使用指标: 1) 检查至少 10 个连续的相同颜色的直方图列,这意味着新趋势的开始(蓝色 - 表示看涨,红色 - 表示看跌)。 2) 然后,如果出现 1 或 2 个相反颜色的列,然后将其变回主要趋势的颜色 - 那就是趋势修正。 3) 修正后,可以考虑:在主要上涨趋势的情况下开立买入交易,在主要下跌趋势的情况下开立卖出交易。
// 出色的交易机器人和指标可在此处获得: https://www.mql5.com/en/users/def1380/seller 这是仅在此 MQL5 网站上提供的原创产品。
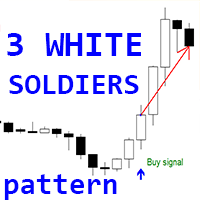
Crypto_Forex 指标“3 白兵模式”适用于 MT4。
- 指标“3 白兵模式”对于价格行为交易非常强大:无需重绘,无延迟。 - 指标检测图表上的看涨“3 白兵”模式:图表上的蓝色箭头信号(见图片)。 - 带有 PC、手机和电子邮件警报。 - 还有它的兄弟 - 看跌“3 黑乌鸦模式”指标可用(点击以下链接)。 - 指标“3 白兵模式”非常适合与支撑/阻力位结合使用。 ................................................................................................................. // 出色的交易机器人和指标可在此处获得: https://www.mql5.com/en/users/def1380/seller 这是仅在此 MQL5 网站上提供的原创产品。
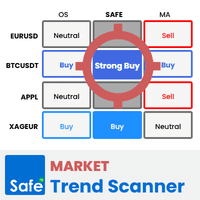
Market Trend Scanner is a trend analyzer or trend screener indicator that helps you know the trend in selected timeframe of all symbols you're watching .
This indicator provides clear & detailed analysis results on a beautiful dashboard, let you able to use this result right away without need to do any additional analysis. How it works
Step 1: Calculate values of 23 selected & trusted technical indicators (Oscillator & Moving Average indicators)
Step 2: Analyze all indicators using best pr

Silver Bullet ICT Indicator for MetaTrader 4 The Silver Bullet ICT Indicator is a sophisticated trading tool developed based on the ICT Strategy , covering three specific time windows in New York local time : London Open Silver Bullet: 3 AM – 4 AM AM Session Silver Bullet: 10 AM – 11 AM PM Session Silver Bullet: 2 PM – 3 PM This indicator is optimized for scalping strategies and performs best on 1-minute, 5-minute, and 15-minute timeframes . «Indicator Installation & User Guide»
MT4 Indicator I
FREE
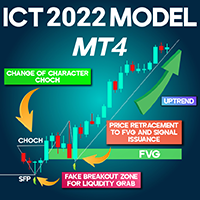
ICT 2022 Model Indicator for MT4 The ICT 2022 Model Indicator is specifically developed based on the principles of ICT trading strategies. It emphasizes critical market behaviors such as liquidity grabs (Sweep), Change of Character (CHoCH), false breakouts (SFP), and fair value gaps (FVG), displaying these elements directly on the price chart.
Once the necessary confirmations are met, the indicator generates a buy signal with a green arrow and a sell signal with a red arrow to assist traders in
FREE
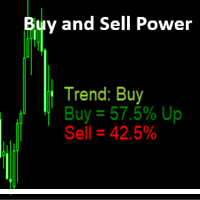
Simple Indicator that shows the Buy and Sell volume in percent.
Settings : Font size for percentage labels Horizontal offset from right edge (pixels) Vertical offset for Signal label from bottom (pixels) Vertical offset for Buy label from bottom (pixels) Vertical offset for Sell label from bottom (pixels) Color for Buy label Color for Sell label Color for Strong Buy signal Color for Buy signal Color for Strong Sell signal Color for Sell signal Color for Neutral signal Default to every tick
FREE

Intraday Fair Value Gap (FVG) Sessions Indicator for MT4 The Intraday FVG Sessions Indicator is a specialized tool designed for MetaTrader 4 (MT4) that integrates session-based price action with Fair Value Gaps (FVGs) . It automatically highlights key highs and lows during New York, London, and Tokyo trading sessions , using horizontal markers to define critical price zones. Additionally, the indicator detects the first Fair Value Gap (FVG) at the session's opening and closing times. Bullish FVG
FREE

我用 货币 力 学 https://www.mql5.com/en/signals/2302402?
量子级交易决策革命
(融合锚定效应 + 损失厌恶心理机制) 全球首创「货币动态 AI 1.0 智能交易指针」
通过 ISO 27001 认证的网络安全协议 85.7% 趋势捕捉精准度
(经 12 国监管沙盒验证) 四维价值体系:
智能波动熵引擎(突破 RSI/MACD 传统局限)
高频流动性预测算法( 2.3σ 级别预警系统)
黑天鹅压力校准( 2020 熔断行情实测认证)
实战交易仪表盘(同步机构级数据流) 首发限时特权:
前 50 位注册用户尊享:
免费尊享版指标试用( 30 天全功能权限) 行为金融学创新模块: 损失厌恶补偿机制(智能盈利护盾) 处置效应中和系统(精准建仓算法) 羊群效应套利模型(市场情绪熵离场信号) 立即点击领取「货币动态 AI 工具包」:
[AI 指针套装 + 市场密码解读手册 限时通道 ] 核心价值强化设计: 信任锚点:国际认证 + 多国监管背书 精准触发:小数点级参数( 85.7%/
FREE
The presented technical analysis indicator marks the points on the price chart of a financial instrument at which the short-term/long-term trend has changed its direction. The indicator identifies the trend direction by analyzing the divergence of the price series with the data of the digital filter selected by the user. The ability of the applied digital filters to adapt to sharp price fluctuations allows achieving high efficiency of the indicator signals in most markets. The indicator signals
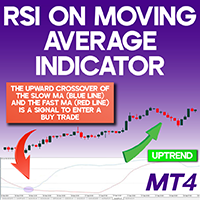
RSI with Moving Average Indicator for MT4 One of the widely used strategies for trend-following trading involves Moving Average Crossovers . The RSI with MA Indicator enhances this approach by integrating the Relative Strength Index (RSI) alongside moving averages, offering a more refined entry and exit strategy. This indicator displays two oscillating lines within the 0 to 100 range, generating buy and sell signals based on their crossovers. «Indicator Installation & User Guide»
MT4 Indicator
FREE
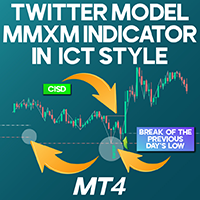
Twitter Model MMXM Indicator in ICT style for MT4
The Twitter Model MMXM Indicator is a MetaTrader 4 (MT4) tool inspired by Inner Circle Trader (ICT) and Smart Money Concepts. It’s engineered to detect daily high/low points over a 24-hour cycle and issues trading alerts based on liquidity grabs, Fair Value Gaps (FVG), and CISD setups.
It also visually marks the New York session's start with a grey horizontal line. «Indicator Installation & User Guide»
MT4 Indicator Installation | Twitter Mod
FREE
The presented indicator sets dynamic support/resistance levels on the price chart. The indicator is easy to use and can be useful for both beginners and professional traders. The middle line of the indicator (Central level) helps to identify the current trend: If the closing price is above the central line - the trend is ascending. If the closing price is below the central line - the trend is descending. The presented indicator allows implementing another version of the trading strategy, which w
FREE
The trend is your friend. A simple truth known to every trader. The presented indicator allows you to visualize the current trend. The indicator identifies the trend using the following definition as an algorithm: A trend is a situation when each subsequent maximum price rise is higher/lower than the previous one, and similarly each subsequent maximum price fall is higher/lower than the previous one; The beginning of a new trend is considered to be when the current maximum/minimum overcomes all
FREE
The presented indicator is the author's implementation of the Double Smoothed Stochastic oscillator developed by William Blau and Walter Bressert. The calculation of values is in many ways similar to the calculation of the classic stochastic oscillator. The indicator takes into account the location of the current price relative to local highs/lows. The indicator gives signals about changing its direction and/or about entering/exiting the overbought/oversold zone. The signal is given after the
FREE

Precision Trading with Advanced Market Analysis! Gain an edge in forex trading with a comprehensive analysis suite that helps you categorize volatility, estimate swing lengths, and make data-driven decisions based on historical market behavior. Key Features: Advanced Swing Detection
Customize sensitivity to price movements by defining minimum bars and price shifts required for a new swing.
Tailor it to your trading style for precise trend identification. Volatility Analysis
FREE

"PACIFIC BREAKOUT" — Catch a Wave of Profit on Breakouts of Sessions! Are You Tired Of Missing Key Breakouts?
Manual calculation of levels, dozens of indicators and missed signals will be a thing of the past! What Does Pacific Breakout Do? This is your personal analytical robot that: The pulse accumulation range of the Pacific session is automatically determined (1:00 GMT+3 Sydney). - We analyze the second candle after the market opens, because the extended spread does not giv

Overview:
"TrendLine Alerts" is a dynamic, multi-functional trading tool designed to monitor and alert traders in real-time when price action touches or breaks critical technical levels. Built for precision, it seamlessly tracks trendlines, horizontal support/resistance, vertical time-based lines, and equidistant channels , ensuring you never miss a key market movement. Whether you’re scalping, swing trading, or managing long-term positions, this indicator acts as your 24/7 market sentinel. K
Martingale Scanner: Smart Trade Analysis for Martingale Strategies The Martingale strategy is a high-risk, high-reward approach that requires precise execution and careful risk management. Without the right tools, traders may struggle to analyze market conditions and adjust trade sizes effectively. Martingale Scanner is designed to simplify and optimize this process, providing traders with a structured way to apply the strategy efficiently across different currency pairs. Why Use Martingale Scan
FREE
MACD Optimiser – AI-Enhanced MACD Settings for Smarter Trading The MACD Optimiser is an advanced tool that supercharges the classic MACD indicator by automatically finding the best parameter settings for different market conditions. Powered by AI and historical data analysis, it eliminates guesswork and helps traders make more precise, data-driven decisions. Why Use MACD Optimiser? Automated Optimization – No more trial-and-error. The tool fine-tunes the MACD’s fast EMA, slow EMA, and sign
FREE

Cross MA Optimiser – Fine-Tune Your Moving Average Strategies in MT4! In the fast-moving world of trading, moving average crossovers are a proven method for identifying trends and trade entry points. However, using the wrong settings can lead to missed opportunities and inefficient strategies. Cross MA Optimiser takes the guesswork out of moving average optimization by automating and fine-tuning your crossover parameters for maximum trading accuracy. Whether you trade with Simple Moving Aver
FREE
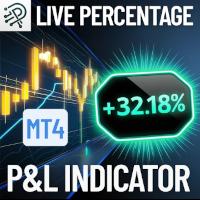
Quickly monitor your floating profit or loss as a percentage of your account balance live and always visible right on your chart! Key Features: Real-Time Calculation: Instantly calculates the combined floating profit or loss from all open trades as a percentage of your current account balance. Easy On-Chart Display: The result is conveniently shown as a label in the lower-right corner of your chart no distractions, always visible. Clear Color Coding: Green for profit, red for loss for imm
FREE

Pro Period Separators For MetaTrader 4 The built-in period separators feature doesn’t allow users to specify the time period, so you can use this indicator to create advanced period separators, you can add daily, weekly, monthly, yearly separators on any time frame. Default Inputs DAILY SEPARATOR SETTINGS show daily separators = Yes hour of the separators = 04 minute of the separators = 00 color of the separators = Silver width of the separators = 1 style of the separators = STYLE_DOT WEEKLY_SE
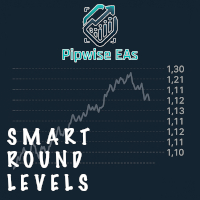
Upgrade your charts instantly. Smart Round Levels draws powerful .00 and .50 round-number zones automatically on any forex pair — including JPY pairs like USDJPY — and features a dynamic live price tracker that follows price in real time. Features: • Automatic round-number detection (.00 & .50) • Auto-adjusts for JPY and non-JPY pairs • Perfect precision with customizable spacing & scale • Fully customizable colors, line widths, font sizes • Real-time yellow price label tha

TRADE HELPER: Multi-Timeframe Trading Assistant TRADE HELPER is a comprehensive multi-timeframe trading assistant designed to enhance your trading decisions by providing real-time analysis across multiple timeframes. This powerful indicator combines RSI analysis, trend strength evaluation, and advanced signal generation to help traders identify high-probability trading opportunities. Key Features Multi-Timeframe RSI Analysis Displays RSI values across seven timeframes (M1, M5, M15, M30, H1, H4,
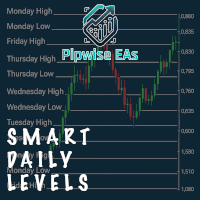
Smart Daily Levels – Extended Highs & Lows from Past Days
Never lose sight of market structure again. Smart Daily Levels automatically draws horizontal lines at the high and low of each day — and extends them forever to the right side of your chart.
Perfect for traders who use: • Support & resistance • Breakout traps • Liquidity zones • Smart Money / price action strategies Core Features • Daily high & low lines from the past X days (default: 10) • Lines start at each day’s open an
Signal Quality Dashboard – Trade Like a Pro Tired of the BS and unreliable signals? It’s time to break free from mediocre systems. The Signal Quality Dashboard is built exclusively for renegade traders who demand real, actionable data. This isn’t your average trading robot—it's a no-nonsense, MQL5-powered solution that combines RSI, MACD, Bollinger Bands, ADX, Volume, and Price Action into one ultra-intelligent dashboard. What It Does:
• Real-Time Signal Scoring: It crunches multiple indicator

Scalper Elite Dashboard – The Ultimate Precision Entry Indicator (MT4) Version: 1.00
Type: Non-Repainting Multi-Logic Signal System
Platform: MetaTrader 4
Dashboard-based, No External API, Lightning Fast Execution What is Scalper Elite Dashboard? Scalper Elite Dashboard is a high-frequency, non-repainting trading indicator designed specifically for scalping, intraday, and short-term swing trading. It combines 6 powerful technical analysis components into a single ultra-visual and inte
MetaTrader市场是 出售自动交易和技术指标的最好地方。
您只需要以一个有吸引力的设计和良好的描述为MetaTrader平台开发应用程序。我们将为您解释如何在市场发布您的产品将它提供给数以百万计的MetaTrader用户。
您错过了交易机会:
- 免费交易应用程序
- 8,000+信号可供复制
- 探索金融市场的经济新闻
注册
登录